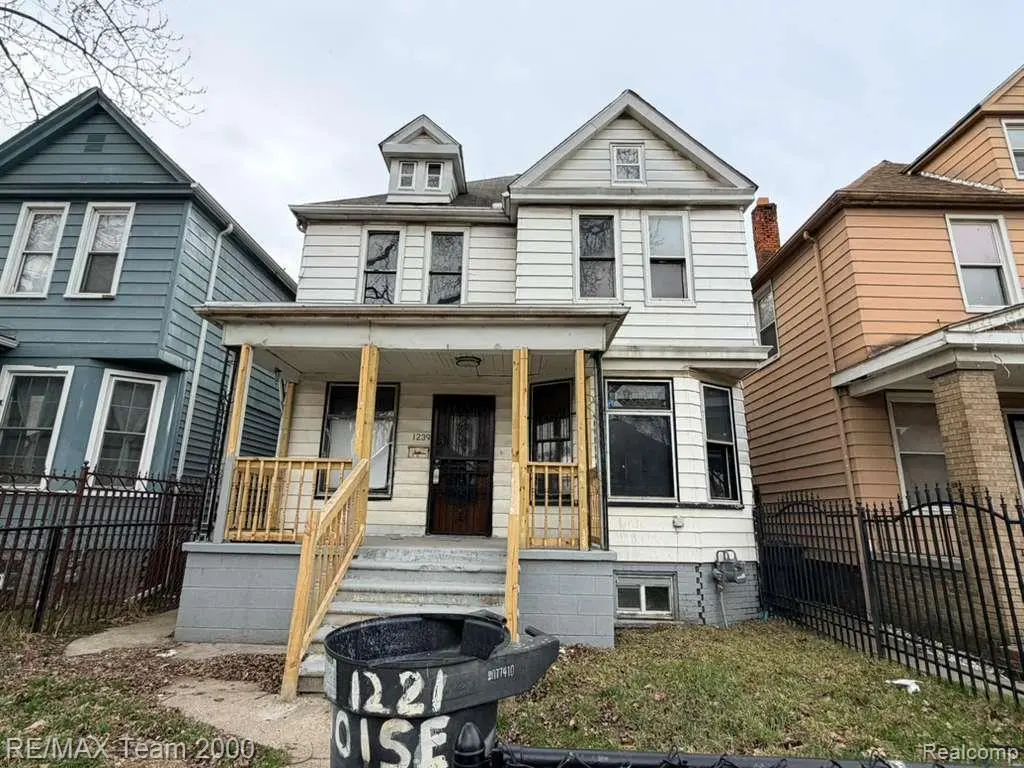
1239 Livernois Ave · Detroit, MI
Flood risk 1/10 · Minimal
- FEMA flood zone
- X (unshaded)
- Chance of flooding over 30 yrs
- 0.0%
- Est. flood insurance / yr
- $473 – $860
Fire risk 1/10 · Minimal
- Est. fire insurance / yr
- $784 – $1,456
Heat risk 3/10 · Minor
- Hot days now (above 95°F)
- 7 days/yr
- Hot days in 30 yrs
- 15 days/yr
Wind risk 2/10 · Minimal
- Chance of severe wind over 30 yrs
- —
Air-quality risk 4/10 · Minor
- Unhealthy air days now
- 6 days/yr
- Unhealthy air days in 30 yrs
- 8 days/yr
Risk factors via First Street. Map © Google.
Why this score? — see what drove the B- grade
The composite is a weighted blend of 9 inputs, each scored 0–100. Each bar is that input's sub-score; the figure is the points it added to the 100-point composite (weight × sub-score).
- Cash flow +20.5/30.0
- ARV discount +15.0/15.0
- Appreciation +10.0/10.0
- 1% rule +6.7/10.0
- DSCR +6.5/10.0
- Livability +3.7/5.0
- Rent growth +2.5/5.0
- Condition / age +2.5/5.0
- Schools +1.3/10.0
$111,000
🖨 Deal sheet 📄 Offer letter ✓ Due diligence
Listing remarks MLS
This handyman special is a fantastic opportunity for investors or buyers looking to add value. Located in an area surrounded by major development and ongoing growth, this property offers strong upside potential. With the right vision and renovations, it can be transformed into a great home or profitable investment. Conveniently situated near shopping, dining, and key amenities, this is your chance to get into an up-and-coming neighborhood at an attractive price point.
Key facts
- 3,920 sq ft lot
- Built 1915
- Listed 50 days
Neighborhood map
What this means for you Summary
Snapshot
- This is a 3-bed/1.0-bath single-family listed at $111k.
Deal economics
- At list price, monthly cash flow is $147 ($2k/yr) — positive.
- The deal already cash-flows at list — no discount required.
- Meets the 1% rule at list price ($1k rent vs $111k).
- Recommended offer: $108k (3.0% below list) — sets the bar for market timing.
- Cap rate 7.9% vs local median 10.2% in Detroit — below-typical yield; the buyer is paying a premium for something (appreciation thesis, condition, location) that the cap rate doesn't capture.
Location & tenants
- Location reads 73/100 on livability (#218 in MI) — a middle-class / working-renter tenant base. Strengths: amenities A+, commute A+, cost of living A+; Watch: schools F, crime F, employment F.
- Detroit Public Schools Community District (urban): math 10% / reading 24% proficiency, ranked #499 of 540 in MI (top 92%) — low school quality limits family demand, transient renter base, plan for 1-2y turnover; 90% free/reduced lunch — lower-income household profile, screen leases tightly.
- Market conditions: 66 active listings in the ZIP; 7 comparable units currently listed for rent nearby; rentals lingering (median 44d on market — plan ~5-8 weeks vacancy on turnover, expect pricing pressure); 57% of comp listings sitting > 30 days — soft ceiling on asking rent; lower-income renter base — watch delinquency; 2,639 units permitted in Wayne County in 2024 (1,216 in 5+ unit buildings).
- This rent runs 36% of the median local income ($43k/yr) — at the standard rent-burdened threshold; future hikes will face affordability resistance.
Forward outlook
- In year one you build about $12k of equity ($767 loan paydown + $11k appreciation (10.0% local appreciation)).
- Wayne County population projected at -17% by 2050 — secular population decline; favor cash flow + early exit over multi-decade hold.
- At projected returns (10.0% appreciation + 3.0% rent growth), your $31k cash investment doubles in ~3 years — after that, you're playing with house money.
- By year 3, paydown + projected appreciation supports a ~$30k cash-out refi (75% LTV) — recoverable capital for the next deal without selling this one.
Negotiation context
- It's been on market 50 days — a 3% lower offer ($108k) is reasonable based on typical stale-listing flexibility.
- 5 sale attempts since 19y ago with the ask held roughly flat each time — persistent listings suggest the price (not the market) is what's stuck; bring a comps-based counter.
- Current owner paid $13k; list at $111k implies a 754% gain — meaningful room to come down on a strong offer.
Risks & watch-outs
- Watch-outs: property tax is 2.7% of price; built in 1915 — expect roof / HVAC / electrical / plumbing capex.
Questions for the listing agent
- It's been on market 50 days. Have you received any prior offers? Is the seller open to a 3% concession, seller financing, or rate buy-down credit?
- Built in 1915 — when were the roof, HVAC, electrical panel, plumbing, and water heater last replaced?
- Property tax is high relative to price — has the assessment been appealed recently, and will the sale trigger a re-assessment?
- Is there a deadline driving the sale (1031 exchange, divorce, estate, relocation)? That informs how much negotiation room exists.
- Schools are F-rated, which usually means shorter tenancies and higher turnover. Who's the typical renter profile here, and what's been the actual vacancy rate?
- Crime grade is F in this area — have there been break-ins, vandalism, or insurance claims at this property in the last 3 years? What carrier currently insures it and at what premium?
- What's the average days-on-market for RENTAL listings here right now (not sales)? A rising rental-DOM trend means longer vacancies and softer asking-rent achievability than the comps imply.
- What's the recent tenant-quality profile in this submarket — average credit score on applications, eviction rate, late-payment / NSF rate, and stable-employment percentage? A property-management company in the area should have these aggregated.
- How much new for-sale + rental construction is in the pipeline within 1–3 miles? Heavy new supply typically softens prices + rents 12–24 months out; constrained supply supports both.
Investment metrics
- 1% rule
- 1.17% ✓
- Cap rate
- 7.88%
- Cash-on-cash
- 5.66%
- DSCR
- 1.25
- GRM
- 7.1
CMA / ARV
- ARV (median comp)
- $170,321
- List price
- $111,000
- Delta
- -34.83%
- Verdict
- UNDERPRICED
- Comps
- 20 within 1.0 mi
Show comp detail 12 sales within ~0.75 mi
| Address | Dist | Beds/Ba | Sqft | Sold | Price | $/sf | Match |
|---|---|---|---|---|---|---|---|
| 1532 Livernois Ave | 0.13mi | 4/2.5 (+1) | 1,524 (+3%) | 9mo | $230,000 | $151 | 70 |
| 1044 N Rademacher St | 0.23mi | 3/1.0 | 1,392 (-6%) | 17mo | $120,000 | $86 | 65 |
| 1715 Casgrain St | 0.28mi | 3/1.0 | 1,440 (-3%) | 23mo | $76,000 | $53 | 64 |
| 1521 Military St | 0.18mi | 4/2.0 (+1) | 1,654 (+12%) | 1mo | $95,000 | $57 | 62 |
| 1538 Junction St | 0.49mi | 3/1.0 | 1,600 (+8%) | 3mo | $93,000 | $58 | 61 |
| 1602 Campbell St | 0.40mi | 3/2.0 | 1,459 (-1%) | 19mo | $137,000 | $94 | 59 |
| 7106 Lisbon St | 0.51mi | 4/1.0 (+1) | 1,460 (-1%) | 13mo | $180,000 | $123 | 58 |
| 1980 Morrell St | 0.66mi | 4/1.5 (+1) | 1,500 (+1%) | 6mo | $225,000 | $150 | 55 |
| 1937 Morrell St | 0.62mi | 3/1.0 | 1,300 (-12%) | 7mo | $150,000 | $115 | 45 |
| 7225 Senator St | 0.72mi | 2/2.0 (-1) | 1,512 (+2%) | 12mo | $92,500 | $61 | 44 |
| 1639 Lansing St | 0.69mi | 3/1.0 | 1,585 (+7%) | 18mo | $70,000 | $44 | 41 |
| 5635 Brandon St | 0.73mi | 4/1.0 (+1) | 1,326 (-10%) | 21mo | $137,000 | $103 | 26 |
Match score weights: distance 35% · size 25% · config 20% · recency 20%. Top-matched comps best support the ARV.
Projected returns pro-forma
10.0% appreciation · 3.0% rent growth · sell at horizon
- IRR
- 28.4%
- Equity multiple
- 3.25×
- Total profit
- $69,874
- Equity at exit
- $99,998
- IRR
- 24.8%
- Equity multiple
- 7.39×
- Total profit
- $198,604
- Equity at exit
- $215,649
Cash invested: $31,080 (down + closing). Projections, not guarantees.
Landlord ↔ Tenant lean methodology
- Overall (STATE)
- 62 Landlord-Friendly
- State Michigan
- 62 Landlord-Friendly · EVEN
- County
- — inherits STATE
- City
- — inherits STATE
ZIP-level market 48209
- Home prices YoY
- 21.8%
- Active inventory
- 66
- Price-to-rent
- 7.1×
Monthly cashflow live
- Estimated rent
- $1,298 high interval (Pro) →
- Mortgage (P&I)
- −$582
- Tax from tax record
- −$251 /mo · $3,008/yr
- Insurance
- −$46
- HOA
- −$0
- Vacancy / Maint / Mgmt
- −$273
- Net cashflow
- $147
Break-even live
UW: 25.0% down · 7.5% · 30yr · 1.5% tax · 5.0% vac · 8.0% maint · 8.0% mgmt
Financing live
Cash to close
- Down payment
- $27,750
- Closing costs
- $3,330
- Reserves months
- —
- Total cash needed
- —
Loan-product check · same deal, 3 products live
Conventional
25% down · 7.5% · 30yr
- Down + closing
- —
- Monthly P&I
- —
- Monthly cashflow
- —
- DSCR
- —
- Eligible?
- —
Personal DTI + credit; lowest rate.
DSCR
20% down · 8.5% · 30yr
- Down + closing
- —
- Monthly P&I
- —
- Monthly cashflow
- —
- DSCR
- —
- Eligible?
- —
No personal income docs; deal must DSCR.
Hard money
10% down · 12.0% · 12mo
- Down + closing
- —
- Monthly P&I
- —
- Monthly cashflow
- —
- DSCR
- —
- Eligible?
- —
Short-term bridge; refi at stabilization.
Rent comps 7 comps
| Address | Beds | Baths | Sqft | Rent | $/sqft | DOM | Units | Dist |
|---|---|---|---|---|---|---|---|---|
| 6628 W Lafayette Blvd Detroit, MI | 2.0 | 1.0 | 900 | $965 | $1.07 | 44d | 1 | 0.29mi |
| 1434 Campbell St Detroit, MI | 3.0 | 1.0 | 1150 | $1,750 | $1.52 | 24d | 1 | 0.36mi |
| 7263 Senator St Detroit, MI | 2.0 | 1.0 | 909 | $1,300 | $1.43 | 44d | 1 | 0.74mi |
| 7265 Senator St Detroit, MI | 2.0 | 1.0 | 1232 | $1,300 | $1.06 | 44d | 1 | 0.74mi |
| 1729 Vinewood St Unit 2 Detroit, MI | 2.0 | 1.0 | 893 | $775 | $0.87 | 13d | 1 | 1.13mi |
| 2488 Woodmere St Detroit, MI | 3.0 | 1.0 | 1000 | $1,453 | $1.45 | 5d | 1 | 1.47mi |
| 4031 Wesson St Apt 109 Detroit, MI | 2.0 | 1.0 | 1000 | $1,190 | $1.19 | 44d | 1 | 1.49mi |
Listing history 18 events
-
2026-06-13statusdays on market $111,000 Pending 50 DOM
-
2026-06-09days on market $111,000 Active 49 DOM
-
2026-06-08days on market $111,000 Active 48 DOM
-
2026-06-07days on market $111,000 Active 47 DOM
-
2026-06-04days on market $111,000 Active 44 DOM
-
2026-06-03days on market $111,000 Active 43 DOM
-
2026-06-02days on market $111,000 Active 42 DOM
-
2026-06-01days on market $111,000 Active 41 DOM
-
2026-05-31days on market $111,000 Active 40 DOM
-
2026-04-21$111,000 Active 472-char remark
Show marketing remark (472 chars)
This handyman special is a fantastic opportunity for investors or buyers looking to add value. Located in an area surrounded by major development and ongoing growth, this property offers strong upside potential. With the right vision and renovations, it can be transformed into a great home or profitable investment. Conveniently situated near shopping, dining, and key amenities, this is your chance to get into an up-and-coming neighborhood at an attractive price point.
-
2013-12-27historical
-
2013-12-27historical
-
2013-05-29$19,900
-
2013-05-29$19,900
-
2007-07-18historical
-
2007-01-21$49,000
-
1993-02-11soldstatus $13,000
ⓘ Source: listings_history table (triggers on properties + properties_extension) + one-shot
backfill from property_details.listing_events for pre-trigger history.
Tax reassessment forecast MI · Partial reset (capped growth)
- Current annual tax
- $3,008 · $251/mo
- Projected year-2 tax
- $3,008 · $251/mo
- Expected delta
- $0/yr ($0/mo · 0.0%)
ⓘ Screening estimate from a state-policy table — verify with the county assessor before closing.
Climate risk First Street
- Flood 1/10 Low FEMA zone X (unshaded) · 0% chance over 30 yrs
- Wildfire 1/10 Low
- Heat 3/10 Moderate 7 d/yr ≥95°F today · 15 d/yr by 30 yrs out
- Wind 2/10 Low
- Air quality 4/10 Moderate 6 unhealthy d/yr today · 8 by 30 yrs out
Nearby sold comps map
Loading sold comps map…
Walkable amenities ~0.75 mi
Loading nearby amenities…
Taxation est. · year 1
- Rental income
- $15,578
- − Mortgage interest
- −$6,218
- − Property taxes
- −$3,008
- − Insurance
- −$555
- − Repairs & maintenance
- −$1,246
- − Management
- −$1,246
- − Depreciation
- −$3,229
- Taxable income
- $75
- Est. tax owed @ 24.0%
- −$18
- After-tax cash flow
- $1,740/yr
For passive investors: Depreciation is non-cash, so a rental often shows a tax loss while cash-flowing — sheltering income. Rental losses are passive: they offset passive income freely, and up to $25,000/yr can offset ordinary (W-2) income if you actively participate and your MAGI is under $100k (phasing out to $0 by $150k); unused losses carry forward. On sale, claimed depreciation is recaptured at up to 25%, and gains may owe capital-gains tax (a 1031 exchange can defer both). Figures are a year-1 estimate at your 24.0% rate — not tax advice; consult a CPA.
Schools (NCES district)
- District
- Detroit Public Schools Community District
- NCES district ID
- 2601103
- Math proficiency
- 10% ▼ -2.00%
- Reading proficiency
- 24% ▲ 6.00%
- Median HH income
- $25,815
- Composite
- 13.06/100
- National rank
- #9564
- State rank
- #499 of 540 in MI
Livability — Detroit
- Score
- 73/100
- State rank
- #218
- US rank
- #5427
Category grades
Schools grade is shown separately in the Schools card above.
Census & demographics
- Census place
- Detroit, MI
- County
- Wayne County · 1,562,939 people
- City population
- 572,865
- Metro
- Detroit-Warren-Dearborn, MI
- Population (ZIP)
- 27,184
- Household income
- $43,161
- Rent vs Own
- Severe rent burden
- 831.0
Population outlook (Wayne County) Hauer SSP2
- Today (2025)
- 1,675,273 people
- By 2030
- 1,620,300 · -3.3%
- By 2040
- 1,502,341 · -10.3%
- By 2050
- 1,384,039 · -17.4%
- By 2075
- 1,124,592 · -32.9%
- By 2100
- 881,193 · -47.4%
Race, ethnicity, and origin ACS 2023
- Neighborhood character
- Predominantly Hispanic (76%)
- Race & ethnicity
- Hispanic / Latino 76% White 17% Two or more races 14% Black 6% Native American 2%
- Hispanic origin (detail)
- Mexican 58% Puerto Rican 7% Cuban 1%
- Common ancestry
- Romanian 2% Lithuanian 0%
- Foreign-born
- 26% · Canada
- Languages at home
- 38% English-only · Spanish 62%
Political lean MEDSL · Wayne
- 2024 margin
- Strong D (+29.0) · D 62.7% · R 33.7% · Other 3.6%
- 2008→2024 swing
- -20.5pp toward R · 2008: 49.5pp · 2024: 29.0pp
- All cycles
- 2024: D+29.0 2020: D+38.1 2016: D+37.3 2012: D+46.9 2008: D+49.5
Not yet ingested
- Civics
- —
Market trends
- HPI YoY
- ▲ 73.77%
- Current HPI
- 412.9753
- Rent YoY
- —
- Metro
- Detroit-Warren-Dearborn, MI
- State GDP YoY
- ▲ 1.37%
- F500 in state
- 28
Industry mix (Fortune 500 HQ in MI)
| Industry | F500 HQs | Revenue |
|---|---|---|
| Automotive Parts | 3 | $48B |
|
||
| Automotive | 2 | $372B |
|
||
| Chemicals | 1 | $45B |
|
||
| Automotive Retail | 1 | $29B |
|
||
| Healthcare / Medical Devices | 1 | $23B |
|
||
| Automotive Technology | 1 | $20B |
|
||
Price history
+753.8% since first listed9 events — show timeline
- 2026-04-21 Listed $111,000 MiRealSource-MiMLS
- 2026-04-21 Listed $111,000 REALCOMP
- 2013-12-27 Listing Removed — REALCOMP
- 2013-12-27 Listing Removed — MiRealSource-MiMLS
- 2013-05-29 Listed $19,900 REALCOMP
- 2013-05-29 Listed $19,900 MiRealSource-MiMLS
- 2007-07-18 Listing Removed — REALCOMP
- 2007-01-21 Listed $49,000 REALCOMP
- 1993-02-11 Sold (Public Records) $13,000 Public Records
Property tax history
+7.8%/yrLatest (2025): $3,008 · -8.8% YoY. Source: county tax records.
Cash-flow waterfall
monthlySold comps — $/sqft
last 12 mo · ≤1 miLoading sold comps…