2279 3rd Ave Unit 3C · New York, NY
Flood risk 1/10 · Minimal
- FEMA flood zone
- X (unshaded)
- Chance of flooding over 30 yrs
- 0.0%
- Est. flood insurance / yr
- $507 – $1,088
Fire risk 1/10 · Minimal
- Est. fire insurance / yr
- $691 – $1,283
Heat risk 6/10 · Moderate
- Hot days now (above 99°F)
- 7 days/yr
- Hot days in 30 yrs
- 15 days/yr
Wind risk 6/10 · Moderate
- Chance of severe wind over 30 yrs
- 27.0%
Air-quality risk 4/10 · Minor
- Unhealthy air days now
- 5 days/yr
- Unhealthy air days in 30 yrs
- 6 days/yr
Risk factors via First Street. Map © Google.
Why this score? — see what drove the F grade
The composite is a weighted blend of 9 inputs, each scored 0–100. Each bar is that input's sub-score; the figure is the points it added to the 100-point composite (weight × sub-score).
- ARV discount +7.5/15.0
- Appreciation +6.6/10.0
- Schools +5.0/10.0
- Rent growth +3.9/5.0
- Livability +3.8/5.0
- Cash flow +2.5/30.0
- Condition / age +2.5/5.0
- 1% rule +1.1/10.0
- DSCR +0.0/10.0
$585,000
🖨 Deal sheet (PDF) 📄 Offer letter ✓ Due diligence
Listing remarks
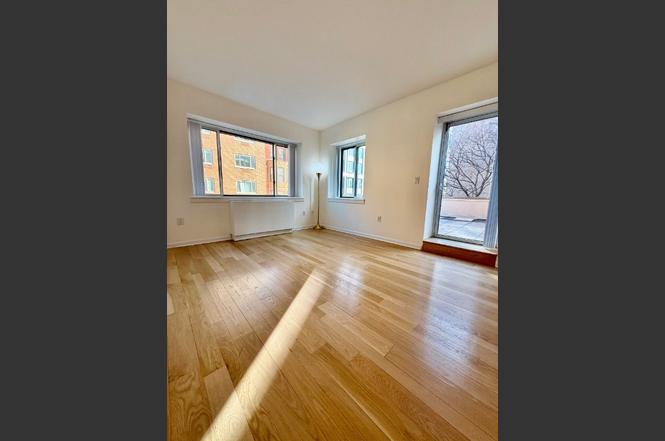
Bright One-Bedroom with Large Private Terrace in Boutique Condo with 421a Tax Abatement. Welcome to Residence 3C at 2279 3rd Avenue a beautifully maintained, move-in-ready one-bedroom, one-bathroom home at The Bridges NYC Condominiums in East Harlem. 757 SQFT Interior & 300 SQFT Private Terrace. Theres a certain sense of calm greets you the moment you step inside Residence 3C. With a private outdoor space and a thoughtful layout, this home offers a peaceful retreat from the energy of New York City. Northern and eastern exposures fill the apartment with natural light throughout the day, highlighting the oak floors and creating a warm, inviting ambiance. The spacious living area flows
Key facts
- Large closet
- Pass-through window
- Granite countertops
Tags
Property features AI
Finance
- HOA & community: Association fee of $780 per month; Pets allowed in building
Exterior
- Home design: Condo/co-op in THE BRIDGES building; Entry on level 3; East and north exposures; Has view
- Construction: Elevator-served building
- Exterior features: Building garden; Community roof deck; Garden; Private outdoor space under 60 sqft; Terrace; Rooftop
Interior
- Kitchen: Dishwasher
- Bedrooms: Total of 3 rooms (includes bedrooms and other rooms)
- Flooring: Hardwood floors
- Bathrooms: 1 full bathroom
- Interior features: Wheelchair accessible; Smoke-free building; Unfurnished
- Laundry & utility: In-unit washer and dryer; No building laundry
Neighborhood map
What this means for you Summary
Snapshot
- This is a 1-bed/1.0-bath condo listed at $585k.
Deal economics
- At list price, monthly cash flow is $-2k ($-24k/yr) — negative.
- To cash-flow at today's rent, offer at most $292k (50.1% below list).
- To meet the 1% rule (rent ≥ 1% of price), the offer needs to be $354k (39.4% below list).
- Recommended offer: $292k (50.1% below list) — sets the bar for cash-flow.
Location & tenants
- Location reads 75/100 on livability (#268 in NY, #4,188 nationally) — a middle-class / working-renter tenant base. Strengths: amenities A+, commute A+, health & safety A; Watch: crime F, cost of living F.
- Zoned schools: Elm Tree Elementary School (math 27% / reading 52%, grade F, #1,444 of 2,108 statewide, top 71%, 806 students, 94% FRL); Mark Twain Is 239 For The Gifted And Talented (math 90% / reading 96%, grade A+, #6 of 729 statewide, top 1%, 1,207 students, 44% FRL); Midwood High School (math 94% / reading 96%, grade A+, #83 of 1,100 statewide, top 8%, 4,062 students, 73% FRL).
- Market conditions: Rents rising fast (+5.6%/yr); 71 active listings in the ZIP; 17 comparable units currently listed for rent nearby; rentals leasing fast (median 1d on market — plan ~1-2 weeks tenant-placement turnaround); 4,467 units permitted in New York County in 2024 (4,463 in 5+ unit buildings).
- At $3,543/mo this rent would consume 94% of the median local household income ($45k/yr) (locally 3992% of renters already pay >50% of income on rent) — very limited rent-growth headroom before tenants either downsize or default.
Forward outlook
- In year one you build about $23k of equity ($4k loan paydown + $19k appreciation (3.2% local appreciation)).
- New York County population projected at +21% by 2050 — long-run rental-demand tailwind backs the buy-and-hold thesis.
- By year 2, paydown + projected appreciation supports a ~$37k cash-out refi (75% LTV) — recoverable capital for the next deal without selling this one.
Negotiation context
- It's been on market 157 days — a 12% lower offer ($515k) is reasonable based on typical stale-listing flexibility.
- 3 sale attempts since 2y ago with the ask held roughly flat each time — persistent listings suggest the price (not the market) is what's stuck; bring a comps-based counter.
Risks & watch-outs
- Watch-outs: HOA is 22% of rent.
- Climate carrying-cost: major wind risk, 27% chance of damaging wind over 30y; extreme-heat days projected 7→15/yr by 2055 (HVAC capex compounding) — expect insurance premiums to compound above CPI over the hold.
Questions for the listing agent
- What do current leases actually rent for vs. the listed asking? Can we see a recent rent roll and the last 12 months of T-12 income?
- It's been on market 157 days. Have you received any prior offers? Is the seller open to a 50% concession, seller financing, or rate buy-down credit?
- What does the HOA fee cover, when was the last increase, and are there any pending special assessments or reserve-fund shortfalls?
- Any open or pending special assessments — roof, HVAC, plumbing, elevator, façade? What's the per-unit balance and payoff schedule, and is the seller paying it off at close or rolling it to the buyer?
- Why hasn't it sold? Are there any deal-killer items the seller is aware of (foundation, flood, title, zoning, code violations)?
- Is there a deadline driving the sale (1031 exchange, divorce, estate, relocation)? That informs how much negotiation room exists.
- Schools are B-rated — typically a magnet for longer-tenancy family renters. What's the average tenant stay here, and is there a school-zone premium baked into asking?
- Crime grade is F in this area — have there been break-ins, vandalism, or insurance claims at this property in the last 3 years? What carrier currently insures it and at what premium?
- The area grade is low — what's the realistic commute time and amenity access for the typical tenant pool here? Any planned neighborhood developments (good or bad) we should know about?
- What's the average days-on-market for RENTAL listings here right now (not sales)? A rising rental-DOM trend means longer vacancies and softer asking-rent achievability than the comps imply.
- What's the recent tenant-quality profile in this submarket — average credit score on applications, eviction rate, late-payment / NSF rate, and stable-employment percentage? A property-management company in the area should have these aggregated.
- How much new apartment / multifamily construction is in the pipeline within 1–3 miles? Heavy new supply (>2% of stock underway) typically softens rents 12–24 months out; light construction supports rent growth.
Investment metrics
- 1% rule
- 0.61% ✗
- Cap rate
- 2.14%
- Cash-on-cash
- -14.83%
- DSCR
- 0.34
- GRM
- 13.8
CMA / ARV
No comps found within radius.
Projected returns pro-forma
3.23% appreciation · 5.62% rent growth · sell at horizon
- IRR
- -4.2%
- Equity multiple
- 0.75×
- Total profit
- $-41,130
- Equity at exit
- $270,697
- IRR
- 1.5%
- Equity multiple
- 1.26×
- Total profit
- $41,959
- Equity at exit
- $423,228
Cash invested: $163,800 (down + closing). Projections, not guarantees.
Landlord ↔ Tenant lean methodology
- Overall (CITY)
- 0 Strongly Tenant-Friendly
- State New York
- 15 Strongly Tenant-Friendly · D+10
- County
- — inherits STATE
- City New York
- 0 Strongly Tenant-Friendly · D+34
ZIP-level market 10035
- Home prices YoY
- 1.0%
- Rents YoY
- 5.6%
- Active inventory
- 71
- Price-to-rent
- 13.8×
Monthly cashflow live
- Estimated rent
- $3,543 medium interval (Pro) →
- Mortgage (P&I)
- −$3,068
- Tax est. 1.5%
- −$731 /mo · $8,775/yr
- Insurance
- −$244
- HOA
- −$780
- Vacancy / Maint / Mgmt
- −$744
- Net cashflow
- $-2,024
Break-even live
Sensitivity live
| Price | -10% $-1,620 | -5% $-1,822 | +0% $-2,024 | +5% $-2,226 | +10% $-2,428 |
|---|---|---|---|---|---|
| Rent | -10% $-2,304 | -5% $-2,164 | +0% $-2,024 | +5% $-1,884 | +10% $-1,744 |
| Rate | -1.0pp $-1,729 | -0.5pp $-1,875 | base $-2,024 | +0.5pp $-2,176 | +1.0pp $-2,330 |
UW: 25.0% down · 7.5% · 30yr · 1.5% tax · 5.0% vac · 8.0% maint · 8.0% mgmt
Financing live
Cash to close
- Down payment
- $146,250
- Closing costs
- $17,550
- Reserves months
- —
- Total cash needed
- —
Loan-product check · same deal, 3 products live
Conventional
25% down · 7.5% · 30yr
- Down + closing
- —
- Monthly P&I
- —
- Monthly cashflow
- —
- DSCR
- —
- Eligible?
- —
Personal DTI + credit; lowest rate.
DSCR
20% down · 8.5% · 30yr
- Down + closing
- —
- Monthly P&I
- —
- Monthly cashflow
- —
- DSCR
- —
- Eligible?
- —
No personal income docs; deal must DSCR.
Hard money
10% down · 12.0% · 12mo
- Down + closing
- —
- Monthly P&I
- —
- Monthly cashflow
- —
- DSCR
- —
- Eligible?
- —
Short-term bridge; refi at stabilization.
Rent comps 17 comps
| Address | Beds | Baths | Sqft | Rent | $/sqft | DOM | Units | Dist |
|---|---|---|---|---|---|---|---|---|
| 5 Lincoln Ave Bronx, NY | 1.0–3.0 | 1.0–2.5 | 1011 | $2,856 | $2.82 | 0d | 181 | 0.41mi |
| 2413 3rd Ave Bronx, NY | 1.0–3.0 | 1.0–2.0 | 857 | $2,953 | $3.44 | 1d | 21 | 0.46mi |
| 77 E 110th St Unit 1322508P New York, NY | 2.0 | 1.5 | 990 | $6,360 | $6.42 | 26d | 1 | 0.74mi |
| 230 W 126th St Unit 20C New York, NY | 2.0 | 1.0 | 860 | $4,555 | $5.30 | 26d | 1 | 0.85mi |
| 132 W 134th St New York, NY | 2.0 | 1.0 | 750 | $4,500 | $6.00 | 26d | 1 | 0.86mi |
| 2051 2nd Ave Unit 1565856P New York, NY | 2.0 | 1.0 | 914 | $6,836 | $7.48 | 1d | 1 | 0.95mi |
| 1635 Lexington Ave Unit 6D New York, NY | 2.0 | 2.0 | 1112 | $6,000 | $5.40 | 26d | 1 | 1.04mi |
| 1399 Park Ave Unit 10C New York, NY | 2.0 | 2.0 | 962 | $5,500 | $5.72 | 1d | 1 | 1.05mi |
| 122 E 102nd St Unit 1021896P New York, NY | 2.0 | 1.0 | 742 | $5,429 | $7.32 | 18d | 1 | 1.13mi |
| 30 Morningside Dr #2096 New York, NY | 1.0–2.0 | 1.0–2.0 | 780 | $5,550 | $7.11 | 1d | 2 | 1.29mi |
| 1 Morningside Dr New York, NY | 3.0 | 1.0–2.0 | 1655 | $6,335 | $3.83 | 0d | 1 | 1.35mi |
| 1501 Lexington Ave #932 New York, NY | 1.0 | 1.0 | 583 | $7,403 | $12.69 | 1d | 3 | 1.37mi |
| 543 W 122nd St New York, NY | 2.0 | 1.0–2.0 | 1057 | $7,948 | $7.52 | 4d | 7 | 1.38mi |
| 215 E 96th St Unit 688 New York, NY | 1.0 | 1.0 | 717 | $7,810 | $10.89 | 1d | 1 | 1.39mi |
| 175 E 96th St Unit 1251683P New York, NY | 2.0 | 1.0 | 600 | $5,305 | $8.84 | 4d | 2 | 1.40mi |
| 215 E 95th St #1293 New York, NY | 1.0–2.0 | 1.0–1.5 | 740 | $5,420 | $7.32 | 1d | 2 | 1.44mi |
| 420 Central Park W Unit 6K New York, NY | 2.0 | 2.0 | 1060 | $8,000 | $7.55 | 24d | 1 | 1.45mi |
HOA detail condo
- Monthly dues
- $780 · $9,360/yr
- Assessments
- None detected in remarks — confirm with the listing agent.
Listing history 17 events
-
2026-06-21days on market $585,000 Active 157 DOM
-
2026-06-18days on market $585,000 Active 154 DOM
-
2026-06-17days on market $585,000 Active 153 DOM
-
2026-06-15days on market $585,000 Active 151 DOM
-
2026-06-13days on market $585,000 Active 149 DOM
-
2026-06-10days on market $585,000 Active 145 DOM
-
2026-06-08days on market $585,000 Active 144 DOM
-
2026-06-04days on market $585,000 Active 140 DOM
-
2026-06-03days on market $585,000 Active 139 DOM
-
2026-06-01days on market $585,000 Active 137 DOM
-
2026-05-31days on market $585,000 Active 136 DOM
-
2026-01-15$585,000 Active
-
2025-09-22soldstatus $540,000
-
2025-09-16price $540,000
-
2025-05-18price $599,000
-
2025-05-01status Active
-
2024-10-21$649,000 Active
ⓘ Source: listings_history table (triggers on properties + properties_extension) + one-shot
backfill from property_details.listing_events for pre-trigger history.
Climate risk First Street
- Flood 1/10 Low FEMA zone X (unshaded) · 0% chance over 30 yrs
- Wildfire 1/10 Low
- Heat 6/10 Major 7 d/yr ≥99°F today · 15 d/yr by 30 yrs out
- Wind 6/10 Major 27% chance of damaging wind over 30 yrs
- Air quality 4/10 Moderate 5 unhealthy d/yr today · 6 by 30 yrs out
Nearby sold comps map
Loading sold comps map…
Walkable amenities ~0.75 mi
Loading nearby amenities…
Taxation est. · year 1
- Rental income
- $42,512
- − Mortgage interest
- −$32,769
- − Property taxes
- −$8,775
- − Insurance
- −$2,925
- − Repairs & maintenance
- −$3,401
- − Management
- −$3,401
- − HOA
- −$9,360
- − Depreciation
- −$17,018
- Taxable loss
- −$35,137
- Est. tax savings @ 24.0%
- +$8,433
- After-tax cash flow
- $-15,856/yr
For passive investors: Depreciation is non-cash, so a rental often shows a tax loss while cash-flowing — sheltering income. Rental losses are passive: they offset passive income freely, and up to $25,000/yr can offset ordinary (W-2) income if you actively participate and your MAGI is under $100k (phasing out to $0 by $150k); unused losses carry forward. On sale, claimed depreciation is recaptured at up to 25%, and gains may owe capital-gains tax (a 1031 exchange can defer both). Figures are a year-1 estimate at your 24.0% rate — not tax advice; consult a CPA.
Schools (NCES district)
No district data.
Livability — New York
- Score
- 75/100
- State rank
- #268
- US rank
- #4188
Category grades
Schools grade is shown separately in the Schools card above.
Census & demographics
- Census place
- New York, NY
- County
- New York County · 1,599,927 people
- City population
- 7,731,280
- Metro
- New York-Newark-Jersey City, NY-NJ-PA
- Population (ZIP)
- 38,862
- Household income
- $45,121
- Rent vs Own
- Severe rent burden
- 3992.0
Population outlook (New York County) Hauer SSP2
- Today (2025)
- 1,825,725 people
- By 2030
- 1,904,611 · +4.3%
- By 2040
- 2,052,719 · +12.4%
- By 2050
- 2,206,601 · +20.9%
- By 2075
- 2,509,427 · +37.4%
- By 2100
- 2,702,933 · +48.0%
Race, ethnicity, and origin ACS 2023
- Neighborhood character
- Diverse neighborhood (Simpson 0.68)
- Race & ethnicity
- Hispanic / Latino 42% Black 35% White 14% Two or more races 13% Asian 6% Native American 2%
- Hispanic origin (detail)
- Mexican 5% Puerto Rican 16% Dominican 10%
- Common ancestry
- Lithuanian 2% Romanian 1% Scotch-Irish 1%
- Foreign-born
- 23% · Canada, China, Jamaica
- Languages at home
- 54% English-only · Spanish 34% Other Indo-European 3% Russian/Polish/Slavic 2%
Political lean MEDSL · New York
- 2024 margin
- Solid D (+64.8) · D 82.4% · R 17.6%
- 2008→2024 swing
- -7.4pp toward R · 2008: 72.2pp · 2024: 64.8pp
- All cycles
- 2024: D+64.8 2020: D+74.5 2016: D+77.2 2012: D+69.6 2008: D+72.2
Not yet ingested
- Civics
- —
Market trends
- HPI YoY
- ▲ 3.23%
- Current HPI
- 317.1637
- Rent YoY
- ▲ 5.62%
- Metro
- New York-Newark-Jersey City, NY-NJ-PA
- State GDP YoY
- ▲ 2.60%
- F500 in state
- 92
Industry mix (Fortune 500 HQ in NY)
| Industry | F500 HQs | Revenue |
|---|---|---|
| Financial Services | 10 | $950B |
|
||
| Consumer Goods | 9 | $162B |
|
||
| Insurance | 4 | $225B |
|
||
| Telecommunications | 2 | $144B |
|
||
| Pharmaceuticals | 2 | $112B |
|
||
| Media / Entertainment | 2 | $69B |
|
||
Price history
-9.9% since first listed6 events — show timeline
- 2026-01-15 Listed $585,000 RLS at REBNY
- 2025-09-22 Sold (Public Records) $540,000 Public Records
- 2025-09-16 Price Changed $540,000 RLS at REBNY
- 2025-05-18 Price Changed $599,000 RLS at REBNY
- 2025-05-01 Relisted — RLS at REBNY
- 2024-10-21 Listed $649,000 RLS at REBNY
Property tax history
-1.8%/yrLatest (2025): $281 · -0.0% YoY. Source: county tax records.
Cash-flow waterfall
monthlySold comps — $/sqft
last 12 mo · ≤1 miLoading sold comps…