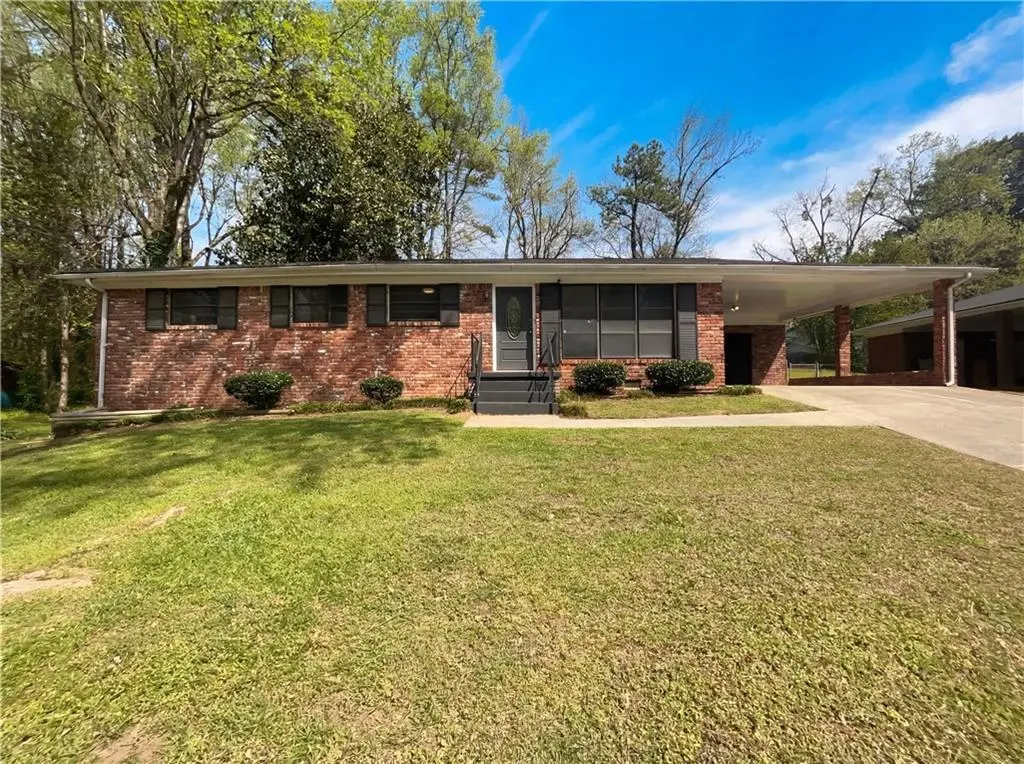
2855 Jerome Rd · South Fulton, GA
Flood risk 5/10 · Moderate
- FEMA flood zone
- X (unshaded)
- Chance of flooding over 30 yrs
- 0.51%
- Est. flood insurance / yr
- $473 – $860
Fire risk 3/10 · Minor
- Est. fire insurance / yr
- $963 – $1,789
Heat risk 5/10 · Moderate
- Hot days now (above 105°F)
- 7 days/yr
- Hot days in 30 yrs
- 18 days/yr
Wind risk 6/10 · Moderate
- Chance of severe wind over 30 yrs
- 27.0%
Air-quality risk 4/10 · Minor
- Unhealthy air days now
- 4 days/yr
- Unhealthy air days in 30 yrs
- 6 days/yr
Risk factors via First Street. Map © Google.
Why this score? — see what drove the C grade
The composite is a weighted blend of 9 inputs, each scored 0–100. Each bar is that input's sub-score; the figure is the points it added to the 100-point composite (weight × sub-score).
- ARV discount +15.0/15.0
- Cash flow +14.3/30.0
- Appreciation +10.0/10.0
- Schools +4.5/10.0
- DSCR +4.4/10.0
- 1% rule +3.7/10.0
- Rent growth +2.7/5.0
- Livability +2.5/5.0
- Condition / age +2.5/5.0
$204,000
🖨 Deal sheet 📄 Offer letter ✓ Due diligence
Listing remarks MLS
Step into 2855 Jerome Rd to find fresh interior paint throughout the residence. The layout includes partial flooring replacement in designated areas. The kitchen features an accent backsplash and all stainless steel appliances along with new appliances. Exterior space provides a patio and a fenced in backyard. This home is a perfect blend of style and comfort, waiting for you to make it your own. Included 100-Day Home Warranty with buyer activation
Key facts
- Walk in closet
- Fresh interior paint
- Patio
Tags
Neighborhood map
What this means for you Summary
Snapshot
- This is a 3-bed/1.5-bath single-family listed at $204k.
Deal economics
- At list price, monthly cash flow is $38 ($462/yr) — positive.
- The deal already cash-flows at list — no discount required.
- To meet the 1% rule (rent ≥ 1% of price), the offer needs to be $177k (13.3% below list).
- Recommended offer: $177k (13.3% below list) — sets the bar for 1% rule.
- Cap rate 6.5% vs local median 4.6% in South Fulton — top-decile yield for the area; either an underpriced asset or a hidden risk that comps aren't pricing in. Stress-test before assuming the spread holds.
Location & tenants
- Location reads: area grade C — affects rentability + tenant quality, not the cash-flow math above.
- Fulton County (suburban): math 49% / reading 53% proficiency, ranked #12 of 174 in GA (top 7%) — acceptable for families but not a draw, mixed tenant base, ~2y average lease.
- Market conditions: Rents flat; 651 active listings in the ZIP; 30 comparable units currently listed for rent nearby; rentals at typical pace (median 22d on market — plan ~3-4 weeks tenant-placement turnaround); 40% of comp listings sitting > 30 days — soft ceiling on asking rent; 11,565 units permitted in Fulton County in 2024 (8,159 in 5+ unit buildings).
- This rent runs 32% of the median local income ($67k/yr) — at the standard rent-burdened threshold; future hikes will face affordability resistance.
Forward outlook
- In year one you build about $22k of equity ($1k loan paydown + $20k appreciation (10.0% local appreciation)).
- Fulton County population projected at +38% by 2050 — long-run rental-demand tailwind backs the buy-and-hold thesis.
- At projected returns (10.0% appreciation + 0.9% rent growth), your $57k cash investment doubles in ~3 years — after that, you're playing with house money.
- By year 2, paydown + projected appreciation supports a ~$35k cash-out refi (75% LTV) — recoverable capital for the next deal without selling this one.
Negotiation context
- It's been on market 84 days — a 6% lower offer ($192k) is reasonable based on typical stale-listing flexibility.
- 2 sale attempts; this cycle's ask has dropped $18k (8%) from the opening price — seller is motivated, your offer sets the floor, not the list.
Risks & watch-outs
- Climate carrying-cost: moderate flood risk; major wind risk, 27% chance of damaging wind over 30y; extreme-heat days projected 7→18/yr by 2055 (HVAC capex compounding) — expect insurance premiums to compound above CPI over the hold.
Questions for the listing agent
- It's been on market 84 days. Have you received any prior offers? Is the seller open to a 13% concession, seller financing, or rate buy-down credit?
- Built in 1968 — when were the roof, HVAC, electrical panel, plumbing, and water heater last replaced?
- Why hasn't it sold? Are there any deal-killer items the seller is aware of (foundation, flood, title, zoning, code violations)?
- Is there a deadline driving the sale (1031 exchange, divorce, estate, relocation)? That informs how much negotiation room exists.
- What's the average days-on-market for RENTAL listings here right now (not sales)? A rising rental-DOM trend means longer vacancies and softer asking-rent achievability than the comps imply.
- What's the recent tenant-quality profile in this submarket — average credit score on applications, eviction rate, late-payment / NSF rate, and stable-employment percentage? A property-management company in the area should have these aggregated.
- How much new for-sale + rental construction is in the pipeline within 1–3 miles? Heavy new supply typically softens prices + rents 12–24 months out; constrained supply supports both.
Investment metrics
- 1% rule
- 0.87% ✗
- Cap rate
- 6.52%
- Cash-on-cash
- 0.81%
- DSCR
- 1.04
- GRM
- 9.6
CMA / ARV
- ARV (median comp)
- $246,329
- List price
- $204,000
- Delta
- -17.18%
- Verdict
- UNDERPRICED
- Comps
- 16 within 1.0 mi
Show comp detail 8 sales within ~0.75 mi
| Address | Dist | Beds/Ba | Sqft | Sold | Price | $/sf | Match |
|---|---|---|---|---|---|---|---|
| 5530 Old Bill Cook Rd | 0.17mi | 3/2.0 | 1,200 (-2%) | 4mo | $40,000 | $33 | 83 |
| 5370 Longmeadow Ln | 0.35mi | 3/1.5 | 1,248 (+2%) | 4mo | $87,500 | $70 | 77 |
| 5637 Sturbridge Way | 0.27mi | 3/2.0 | 1,252 (+2%) | 6mo | $265,000 | $212 | 76 |
| 2760 Swansea Ct | 0.12mi | 4/2.0 (+1) | 1,347 (+10%) | 2mo | $295,900 | $220 | 69 |
| 5550 Old Bill Cook Rd | 0.20mi | 3/1.5 | 1,308 (+7%) | 14mo | $160,000 | $122 | 67 |
| 5341 Sand Bar Ln | 0.35mi | 3/2.0 | 1,093 (-11%) | 1mo | $245,000 | $224 | 63 |
| 5633 Westhill Cir | 0.09mi | 3/2.0 | 1,080 (-12%) | 23mo | $160,000 | $148 | 55 |
| 5425 Twin Lakes Dr | 0.29mi | 3/2.5 | 1,344 (+10%) | 13mo | $215,000 | $160 | 55 |
Match score weights: distance 35% · size 25% · config 20% · recency 20%. Top-matched comps best support the ARV.
Projected returns pro-forma
10.0% appreciation · 0.95% rent growth · sell at horizon
- IRR
- 24.2%
- Equity multiple
- 2.93×
- Total profit
- $109,974
- Equity at exit
- $183,779
- IRR
- 21.0%
- Equity multiple
- 6.52×
- Total profit
- $315,255
- Equity at exit
- $396,327
Cash invested: $57,120 (down + closing). Projections, not guarantees.
Landlord ↔ Tenant lean methodology
- Overall (STATE)
- 90 Strongly Landlord-Friendly
- State Georgia
- 90 Strongly Landlord-Friendly · R+3
- County
- — inherits STATE
- City
- — inherits STATE
ZIP-level market 30349
- Home prices YoY
- 4.6%
- Rents YoY
- 0.9%
- Active inventory
- 651
- Price-to-rent
- 9.6×
Monthly cashflow live
- Estimated rent
- $1,769 high interval (Pro) →
- Mortgage (P&I)
- −$1,070
- Tax from tax record
- −$204 /mo · $2,450/yr
- Insurance
- −$85
- HOA
- −$0
- Vacancy / Maint / Mgmt
- −$371
- Net cashflow
- $38
Break-even live
UW: 25.0% down · 7.5% · 30yr · 1.5% tax · 5.0% vac · 8.0% maint · 8.0% mgmt
Financing live
Cash to close
- Down payment
- $51,000
- Closing costs
- $6,120
- Reserves months
- —
- Total cash needed
- —
Loan-product check · same deal, 3 products live
Conventional
25% down · 7.5% · 30yr
- Down + closing
- —
- Monthly P&I
- —
- Monthly cashflow
- —
- DSCR
- —
- Eligible?
- —
Personal DTI + credit; lowest rate.
DSCR
20% down · 8.5% · 30yr
- Down + closing
- —
- Monthly P&I
- —
- Monthly cashflow
- —
- DSCR
- —
- Eligible?
- —
No personal income docs; deal must DSCR.
Hard money
10% down · 12.0% · 12mo
- Down + closing
- —
- Monthly P&I
- —
- Monthly cashflow
- —
- DSCR
- —
- Eligible?
- —
Short-term bridge; refi at stabilization.
Rent comps 30 comps
| Address | Beds | Baths | Sqft | Rent | $/sqft | DOM | Units | Dist |
|---|---|---|---|---|---|---|---|---|
| 2890 Jerome Rd Atlanta, GA | 3.0 | 1.5 | 1229 | $1,761 | $1.43 | 43d | 1 | 0.08mi |
| 5645 Deerfield Trl Atlanta, GA | 3.0 | 1.5 | 1496 | $1,495 | $1.00 | 21d | 1 | 0.15mi |
| 5712 Westhill Cir Atlanta, GA | 4.0 | 2.0 | 1441 | $1,710 | $1.19 | 3d | 1 | 0.19mi |
| 5410 Twin Lakes Dr Atlanta, GA | 3.0 | 2.0 | 1277 | $2,040 | $1.60 | 43d | 1 | 0.27mi |
| 5370 Longmeadow Ln Atlanta, GA | 3.0 | 2.0 | 1248 | $1,600 | $1.28 | 16d | 1 | 0.33mi |
| 5380 Sand Bar Ln Atlanta, GA | 3.0 | 2.0 | 1361 | $1,961 | $1.44 | 3d | 1 | 0.45mi |
| 2710 Dunmoreland Ter Atlanta, GA | 3.0 | 1.0 | 1198 | $1,540 | $1.29 | 43d | 1 | 0.50mi |
| 5690 Hampton Ct Atlanta, GA | 2.0 | 3.0 | 1184 | $1,495 | $1.26 | 43d | 1 | 0.58mi |
| 3100 Godby Rd Atlanta, GA | 1.0–2.0 | 1.0–2.5 | 959 | $1,395 | $1.45 | 1d | 34 | 0.66mi |
| 3110 Godby Rd Unit 15a College Park, GA | 2.0 | 1.5 | 1062 | $1,150 | $1.08 | 2d | 1 | 0.67mi |
| 3110 Godby Rd Unit 5d College Park, GA | 2.0 | 2.0 | 1016 | $1,150 | $1.13 | 1d | 1 | 0.67mi |
| 2883 Windsor Forrest Ct Atlanta, GA | 3.0 | 2.5 | 1115 | $1,895 | $1.70 | 1d | 1 | 0.74mi |
| 5071 Windsor Forrest Ln Atlanta, GA | 3.0 | 2.5 | 1303 | $1,881 | $1.44 | 12d | 1 | 0.81mi |
| 2817 Windsor Forrest Ct Atlanta, GA | 3.0 | 2.5 | 1408 | $1,697 | $1.21 | 43d | 1 | 0.81mi |
| 5850 Old Bill Cook Rd Atlanta, GA | 2.0 | 1.0 | 768 | $1,450 | $1.89 | 43d | 1 | 0.82mi |
| 2500 Pleasant Hill Rd Atlanta, GA | 2.0–3.0 | 1.5–2.5 | 1405 | $1,449 | $1.03 | 24d | 2 | 0.86mi |
| 5750 Buffington Rd Atlanta, GA | 1.0–3.0 | 1.0–2.0 | 1142 | $1,702 | $1.49 | 1d | 19 | 0.95mi |
| 5740 Buffington Rd Atlanta, GA | 1.0–3.0 | 1.0–2.5 | 964 | $2,149 | $2.23 | 3d | 16 | 1.00mi |
| 5515 Scofield Rd Atlanta, GA | 3.0 | 2.0 | 1109 | $1,788 | $1.61 | 10d | 1 | 1.06mi |
| 2865 Spruce Point Rd Atlanta, GA | 4.0 | 2.0 | 1050 | $1,910 | $1.82 | 43d | 1 | 1.08mi |
| 6056 Carriage Ct Atlanta, GA | 3.0 | 2.0 | 1400 | $1,599 | $1.14 | 5d | 1 | 1.08mi |
| 5442 Scofield Rd Atlanta, GA | 3.0 | 1.5 | 1368 | $1,775 | $1.30 | 43d | 1 | 1.11mi |
| 6230 Cedar Wood Dr Atlanta, GA | 3.0 | 2.0 | 1238 | $1,694 | $1.37 | 43d | 1 | 1.15mi |
| 2431 Old National Pkwy College Park, GA | 1.0–3.0 | 1.0–2.0 | 1031 | $1,780 | $1.73 | 1d | 1 | 1.15mi |
| 2555 Flat Shoals Rd #404 College Park, GA | 3.0 | 2.5 | 1408 | $1,700 | $1.21 | 24d | 1 | 1.18mi |
| 2301 Godby Rd Atlanta, GA | 2.0 | 1.0 | 1054 | $1,225 | $1.16 | 43d | 1 | 1.26mi |
| 395 Fox Trail Dr Atlanta, GA | 3.0 | 2.0 | 1400 | $1,980 | $1.41 | 11d | 1 | 1.32mi |
| 6090 Emerald Pointe Cir Atlanta, GA | 3.0 | 2.0 | 1200 | $1,875 | $1.56 | 18d | 1 | 1.42mi |
| 5267 Joan of Arc Pl Atlanta, GA | 3.0 | 1.0 | 1066 | $1,743 | $1.64 | 43d | 1 | 1.43mi |
| 5477 Denny Dr Atlanta, GA | 4.0 | 3.0 | 1500 | $1,650 | $1.10 | 43d | 1 | 1.47mi |
Listing history 21 events
-
2026-06-18days on market $204,000 Active 84 DOM
-
2026-06-17days on market $204,000 Active 83 DOM
-
2026-06-16days on market $204,000 Active 82 DOM
-
2026-06-15days on market $204,000 Active 81 DOM
-
2026-06-13days on market $204,000 Active 79 DOM
-
2026-06-09days on market $204,000 Active 75 DOM
-
2026-06-08days on market $204,000 Active 74 DOM
-
2026-06-07days on market $204,000 Active 73 DOM
-
2026-06-04pricedays on market $204,000 Active 70 DOM
-
2026-06-03days on market $209,000 Active 69 DOM
-
2026-06-01days on market $209,000 Active 67 DOM
-
2026-05-31days on market $209,000 Active 66 DOM
-
2026-04-23price $209,000 452-char remark
Show marketing remark (452 chars)
Step into 2855 Jerome Rd to find fresh interior paint throughout the residence. The layout includes partial flooring replacement in designated areas. The kitchen features an accent backsplash and all stainless steel appliances along with new appliances. Exterior space provides a patio and a fenced in backyard. This home is a perfect blend of style and comfort, waiting for you to make it your own. Included 100-Day Home Warranty with buyer activation
-
2026-04-09price $215,000 452-char remark
Show marketing remark (452 chars)
Step into 2855 Jerome Rd to find fresh interior paint throughout the residence. The layout includes partial flooring replacement in designated areas. The kitchen features an accent backsplash and all stainless steel appliances along with new appliances. Exterior space provides a patio and a fenced in backyard. This home is a perfect blend of style and comfort, waiting for you to make it your own. Included 100-Day Home Warranty with buyer activation
-
2026-03-26$222,000 New 452-char remark
Show marketing remark (452 chars)
Step into 2855 Jerome Rd to find fresh interior paint throughout the residence. The layout includes partial flooring replacement in designated areas. The kitchen features an accent backsplash and all stainless steel appliances along with new appliances. Exterior space provides a patio and a fenced in backyard. This home is a perfect blend of style and comfort, waiting for you to make it your own. Included 100-Day Home Warranty with buyer activation
-
2026-03-26$222,000 Active 452-char remark
Show marketing remark (452 chars)
Step into 2855 Jerome Rd to find fresh interior paint throughout the residence. The layout includes partial flooring replacement in designated areas. The kitchen features an accent backsplash and all stainless steel appliances along with new appliances. Exterior space provides a patio and a fenced in backyard. This home is a perfect blend of style and comfort, waiting for you to make it your own. Included 100-Day Home Warranty with buyer activation
-
2026-03-13soldstatus $215,000
-
1978-09-25soldstatus $33,309
-
1976-07-01soldstatus $31,000
ⓘ Source: listings_history table (triggers on properties + properties_extension) + one-shot
backfill from property_details.listing_events for pre-trigger history.
Tax reassessment forecast GA · Resets to sale price
- Current annual tax
- $2,450 · $204/mo
- Projected year-2 tax
- $2,450 · $204/mo
- Expected delta
- $0/yr ($0/mo · 0.0%)
ⓘ Screening estimate from a state-policy table — verify with the county assessor before closing.
Climate risk First Street
- Flood 5/10 Major FEMA zone X (unshaded) · 51% chance over 30 yrs
- Wildfire 3/10 Moderate
- Heat 5/10 Major 7 d/yr ≥105°F today · 18 d/yr by 30 yrs out
- Wind 6/10 Major 27% chance of damaging wind over 30 yrs
- Air quality 4/10 Moderate 4 unhealthy d/yr today · 6 by 30 yrs out
Nearby sold comps map
Loading sold comps map…
Walkable amenities ~0.75 mi
Loading nearby amenities…
Taxation est. · year 1
- Rental income
- $21,227
- − Mortgage interest
- −$11,427
- − Property taxes
- −$2,450
- − Insurance
- −$1,020
- − Repairs & maintenance
- −$1,698
- − Management
- −$1,698
- − Depreciation
- −$5,935
- Taxable loss
- −$3,001
- Est. tax savings @ 24.0%
- +$720
- After-tax cash flow
- $1,182/yr
For passive investors: Depreciation is non-cash, so a rental often shows a tax loss while cash-flowing — sheltering income. Rental losses are passive: they offset passive income freely, and up to $25,000/yr can offset ordinary (W-2) income if you actively participate and your MAGI is under $100k (phasing out to $0 by $150k); unused losses carry forward. On sale, claimed depreciation is recaptured at up to 25%, and gains may owe capital-gains tax (a 1031 exchange can defer both). Figures are a year-1 estimate at your 24.0% rate — not tax advice; consult a CPA.
Schools (NCES district)
- District
- Fulton County
- NCES district ID
- 1302280
- Math proficiency
- 49% ▼ -2.00%
- Reading proficiency
- 53% ▬ 0.00%
- Median HH income
- $68,035
- Composite
- 45.33/100
- National rank
- #2640
- State rank
- #12 of 174 in GA
Livability — South Fulton
No livability data for this city. (Only ~50 U.S. cities are tracked.)
Census & demographics
- Census place
- South Fulton, GA
- County
- Fulton County · 1,094,430 people
- City population
- 127,674
- Metro
- Atlanta-Sandy Springs-Alpharetta, GA
- Population (ZIP)
- 79,872
- Household income
- $67,023
- Rent vs Own
- Severe rent burden
- 4258.0
Population outlook (Fulton County) Hauer SSP2
- Today (2025)
- 1,203,707 people
- By 2030
- 1,299,706 · +8.0%
- By 2040
- 1,488,256 · +23.6%
- By 2050
- 1,664,580 · +38.3%
- By 2075
- 2,036,072 · +69.2%
- By 2100
- 2,222,402 · +84.6%
Race, ethnicity, and origin ACS 2023
- Neighborhood character
- Predominantly Black (89%)
- Race & ethnicity
- Black 89% Hispanic / Latino 5% Two or more races 4% White 3%
- Foreign-born
- 9% · Canada
- Languages at home
- 88% English-only · Spanish 6% French/Haitian/Cajun 1%
Political lean MEDSL · Fulton
- 2024 margin
- Solid D (+44.9) · D 71.9% · R 27.0% · Other 1.1%
- 2008→2024 swing
- +9.8pp toward D · 2008: 35.0pp · 2024: 44.9pp
- All cycles
- 2024: D+44.9 2020: D+46.4 2016: D+42.1 2012: D+29.6 2008: D+35.0
Not yet ingested
- Civics
- —
Market trends
- HPI YoY
- ▲ 18.01%
- Current HPI
- 407.99
- Rent YoY
- ▲ 0.95%
- Metro
- Atlanta-Sandy Springs-Alpharetta, GA
- State GDP YoY
- ▲ 2.66%
- F500 in state
- 28
Industry mix (Fortune 500 HQ in GA)
| Industry | F500 HQs | Revenue |
|---|---|---|
| Paper / Packaging | 2 | $29B |
|
||
| Retail | 1 | $160B |
|
||
| Transportation / Logistics | 1 | $91B |
|
||
| Airlines | 1 | $62B |
|
||
| Consumer Goods | 1 | $47B |
|
||
| Utilities | 1 | $25B |
|
||
Price history
+574.2% since first listed9 events — show timeline
- 2026-04-23 Price Changed $209,000 FMLS
- 2026-04-23 Price Changed $209,000 GAMLS
- 2026-04-09 Price Changed $215,000 GAMLS
- 2026-04-09 Price Changed $215,000 FMLS
- 2026-03-26 Listed $222,000 FMLS
- 2026-03-26 Listed $222,000 GAMLS
- 2026-03-13 Sold (Public Records) $215,000 Public Records
- 1978-09-25 Sold (Public Records) $33,309 Public Records
- 1976-07-01 Sold (Public Records) $31,000 Public Records
Property tax history
+5.3%/yrLatest (2025): $2,450 · -4.3% YoY. Source: county tax records.
Cash-flow waterfall
monthlySold comps — $/sqft
last 12 mo · ≤1 miLoading sold comps…