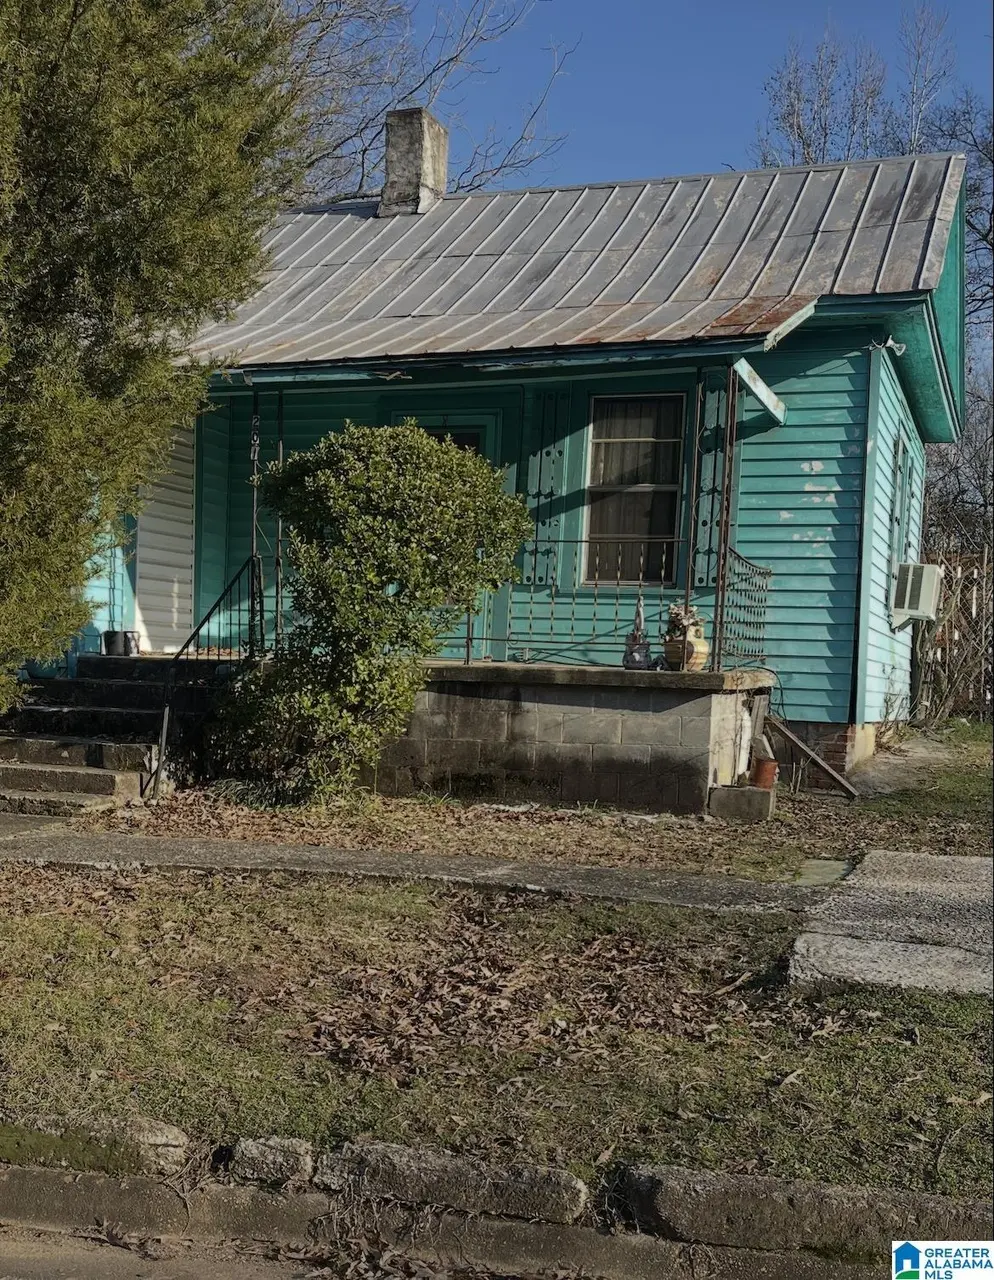
201 Ball Ave · Bessemer, AL
Flood risk 1/10 · Minimal
- FEMA flood zone
- X (unshaded)
- Chance of flooding over 30 yrs
- 0.0%
- Est. flood insurance / yr
- $507 – $1,088
Fire risk 2/10 · Minimal
- Est. fire insurance / yr
- $916 – $1,700
Heat risk 6/10 · Moderate
- Hot days now (above 108°F)
- 7 days/yr
- Hot days in 30 yrs
- 19 days/yr
Wind risk 6/10 · Moderate
- Chance of severe wind over 30 yrs
- 33.0%
Air-quality risk 3/10 · Minor
- Unhealthy air days now
- 2 days/yr
- Unhealthy air days in 30 yrs
- 5 days/yr
Risk factors via First Street. Map © Google.
Why this score? — see what drove the B+ grade
The composite is a weighted blend of 9 inputs, each scored 0–100. Each bar is that input's sub-score; the figure is the points it added to the 100-point composite (weight × sub-score).
- Cash flow +30.0/30.0
- ARV discount +15.0/15.0
- 1% rule +10.0/10.0
- DSCR +10.0/10.0
- Rent growth +5.0/5.0
- Livability +3.0/5.0
- Condition / age +2.5/5.0
- Schools +1.8/10.0
- Appreciation +0.0/10.0
$33,000
🖨 Deal sheet (PDF) 📄 Offer letter ✓ Due diligence
Listing remarks
Charming fixer-upper located at 201 Ball Avenue Full of historic character and renovation potential, this property offers a great opportunity for investors, flippers, or buyers looking to restore a classic home. Situated on a quiet street with mature surroundings, this home is ready for your vision and personal touch
Key facts
- 9,147 sq ft lot
- Built 1920
Neighborhood map
What this means for you Summary
Snapshot
- This is a 2-bed/1.0-bath single-family listed at $33k.
Deal economics
- At list price, monthly cash flow is $745 ($9k/yr) — positive.
- The deal already cash-flows at list — no discount required.
- Meets the 1% rule at list price ($1k rent vs $33k).
- Cap rate 33.4% vs local median 5.9% in Bessemer — top-decile yield for the area; either an underpriced asset or a hidden risk that comps aren't pricing in. Stress-test before assuming the spread holds.
Location & tenants
- Location reads 59/100 on livability (#331 in AL) — a working-class tenant base; expect higher turnover. Strengths: commute A+, cost of living A+, housing A; Watch: crime F, amenities F, employment F.
- Jefferson County (suburban): math 9% / reading 32% proficiency, ranked #104 of 129 in AL (top 81%) — low school quality limits family demand, transient renter base, plan for 1-2y turnover.
- Zoned schools: Mcadory Elementary School (math 14% / reading 40%, grade F, #392 of 627 statewide, top 65%, 667 students, 61% FRL); Mcadory Middle School (math 2% / reading 33%, grade F, #199 of 257 statewide, top 77%, 854 students, 74% FRL); Mcadory High School (math 8% / reading 17%, grade F, #237 of 305 statewide, top 78%, 1,162 students, 72% FRL) — zoned schools average 69% FRL vs 49% district-wide (21 pts higher); higher-poverty schools than district average — tighter screening recommended.
- Market conditions: Rents rising fast (+14.8%/yr); 312 active listings in the ZIP; 19 comparable units currently listed for rent nearby; rentals at typical pace (median 26d on market — plan ~3-4 weeks tenant-placement turnaround); solid renter incomes; 2,114 units permitted in Jefferson County in 2024 (556 in 5+ unit buildings).
- This rent is only 18% of the median local income ($82k/yr) — well below the 30% rent-burden line; pricing power to push rent on renewal without tenant pushback.
Forward outlook
- Local home prices are declining (-3.0%/yr); year-one equity from $228 of loan paydown is wiped out by about $990 of value loss. Plan a longer hold.
- Jefferson County population projected to shrink 4% by 2050 — rents likely to lag national; underwrite the cash flow, not the appreciation.
- At projected returns (-3.0% appreciation + 8.0% rent growth), your $9k cash investment doubles in ~2 years — after that, you're playing with house money.
Negotiation context
- Only 0 days on market — expect competitive offers; lowballing is unlikely to land.
Risks & watch-outs
- Watch-outs: built in 1920 — expect roof / HVAC / electrical / plumbing capex.
- Climate carrying-cost: major wind risk, 33% chance of damaging wind over 30y; extreme-heat days projected 7→19/yr by 2055 (HVAC capex compounding) — expect insurance premiums to compound above CPI over the hold.
Questions for the listing agent
- Built in 1920 — when were the roof, HVAC, electrical panel, plumbing, and water heater last replaced?
- Is there a deadline driving the sale (1031 exchange, divorce, estate, relocation)? That informs how much negotiation room exists.
- Schools are D-rated, which usually means shorter tenancies and higher turnover. Who's the typical renter profile here, and what's been the actual vacancy rate?
- Crime grade is F in this area — have there been break-ins, vandalism, or insurance claims at this property in the last 3 years? What carrier currently insures it and at what premium?
- What's the average days-on-market for RENTAL listings here right now (not sales)? A rising rental-DOM trend means longer vacancies and softer asking-rent achievability than the comps imply.
- What's the recent tenant-quality profile in this submarket — average credit score on applications, eviction rate, late-payment / NSF rate, and stable-employment percentage? A property-management company in the area should have these aggregated.
- How much new for-sale + rental construction is in the pipeline within 1–3 miles? Heavy new supply typically softens prices + rents 12–24 months out; constrained supply supports both.
Investment metrics
- 1% rule
- 3.66% ✓
- Cap rate
- 33.37%
- Cash-on-cash
- 96.70%
- DSCR
- 5.30
- GRM
- 2.3
CMA / ARV
- ARV (on-the-fly)
- $55,432
- Comps found
- 2
Show comp detail 2 sales within ~0.75 mi
| Address | Dist | Beds/Ba | Sqft | Sold | Price | $/sf | Match |
|---|---|---|---|---|---|---|---|
| 104 Raimund Ave | 0.54mi | 2/1.0 | 1,145 (+7%) | 22mo | $60,000 | $52 | 44 |
| 912 Avenue I | 0.70mi | 2/1.0 | 926 (-13%) | 13mo | $25,500 | $28 | 34 |
Match score weights: distance 35% · size 25% · config 20% · recency 20%. Top-matched comps best support the ARV.
Projected returns pro-forma
-3.0% appreciation · 8.0% rent growth · sell at horizon
- IRR
- —
- Equity multiple
- 6.25×
- Total profit
- $48,474
- Equity at exit
- $4,920
- IRR
- —
- Equity multiple
- 15.33×
- Total profit
- $132,395
- Equity at exit
- $2,853
Cash invested: $9,240 (down + closing). Projections, not guarantees.
Landlord ↔ Tenant lean methodology
- Overall (STATE)
- 90 Strongly Landlord-Friendly
- State Alabama
- 90 Strongly Landlord-Friendly · R+15
- County
- — inherits STATE
- City
- — inherits STATE
ZIP-level market 35022
- Home prices YoY
- -20.2%
- Rents YoY
- 14.8%
- Active inventory
- 312
- Price-to-rent
- 2.3×
Monthly cashflow live
- Estimated rent
- $1,209 high interval (Pro) →
- Mortgage (P&I)
- −$173
- Tax from tax record
- −$24 /mo · $289/yr
- Insurance
- −$14
- HOA
- −$0
- Lot rent
- −$0
- Vacancy / Maint / Mgmt
- −$254
- Net cashflow
- $745
Break-even live
Sensitivity live
| Price | -10% $763 | -5% $754 | +0% $745 | +5% $735 | +10% $726 |
|---|---|---|---|---|---|
| Rent | -10% $649 | -5% $697 | +0% $745 | +5% $792 | +10% $840 |
| Rate | -1.0pp $761 | -0.5pp $753 | base $745 | +0.5pp $736 | +1.0pp $727 |
UW: 25.0% down · 7.5% · 30yr · 1.5% tax · 5.0% vac · 8.0% maint · 8.0% mgmt
Financing live
Cash to close
- Down payment
- $8,250
- Closing costs
- $990
- Reserves months
- —
- Total cash needed
- —
Loan-product check · same deal, 3 products live
Conventional
25% down · 7.5% · 30yr
- Down + closing
- —
- Monthly P&I
- —
- Monthly cashflow
- —
- DSCR
- —
- Eligible?
- —
Personal DTI + credit; lowest rate.
DSCR
20% down · 8.5% · 30yr
- Down + closing
- —
- Monthly P&I
- —
- Monthly cashflow
- —
- DSCR
- —
- Eligible?
- —
No personal income docs; deal must DSCR.
Hard money
10% down · 12.0% · 12mo
- Down + closing
- —
- Monthly P&I
- —
- Monthly cashflow
- —
- DSCR
- —
- Eligible?
- —
Short-term bridge; refi at stabilization.
Rent comps 19 comps
| Address | Beds | Baths | Sqft | Rent | $/sqft | DOM | Units | Dist |
|---|---|---|---|---|---|---|---|---|
| 704 Avenue I Bessemer, AL | 3.0 | 1.0 | 1232 | $1,200 | $0.97 | 26d | 1 | 0.70mi |
| 808 Fairfax Ave Bessemer, AL | 3.0 | 1.0 | 1042 | $1,050 | $1.01 | 26d | 1 | 0.92mi |
| 810 Fairfax Ave Bessemer, AL | 3.0 | 1.0 | 1042 | $1,050 | $1.01 | 26d | 1 | 0.92mi |
| 4015 Goodwin Rd Bessemer, AL | 3.0 | 2.0 | 1200 | $1,211 | $1.01 | 18d | 1 | 1.05mi |
| 931 Dartmouth Ave Bessemer, AL | 3.0 | 1.0 | 984 | $925 | $0.94 | 46d | 1 | 1.09mi |
| 236 Clifton St Bessemer, AL | 3.0 | 1.0 | 1450 | $1,100 | $0.76 | 46d | 1 | 1.10mi |
| 1600 Holbrook Ave Bessemer, AL | 3.0 | 1.0 | 885 | $999 | $1.13 | 4d | 1 | 1.12mi |
| 622 Jefferson Ave Bessemer, AL | 2.0 | 1.0 | 800 | $850 | $1.06 | 23d | 1 | 1.16mi |
| 622 Jefferson Ave Unit 622 Bessemer, AL | 2.0 | 1.0 | 800 | $850 | $1.06 | 5d | 1 | 1.16mi |
| 1622 Fairfax Ave Bessemer, AL | 2.0 | 2.0 | 1104 | $995 | $0.90 | 4d | 1 | 1.27mi |
| 300 Norwood Ave Bessemer, AL | 3.0 | 1.0 | 966 | $900 | $0.93 | 14d | 1 | 1.30mi |
| 300 Norwood Ave Bessemer, AL | 3.0 | 1.0 | 966 | $1,000 | $1.04 | 26d | 1 | 1.30mi |
| 208 9th Ct S Bessemer, AL | 2.0 | 1.0 | 784 | $650 | $0.83 | 26d | 1 | 1.31mi |
| 3626 Wind Ridge Ln Bessemer, AL | 3.0 | 2.0 | 1305 | $1,850 | $1.42 | 5d | 1 | 1.33mi |
| 1909 Holbrook Ave Bessemer, AL | 2.0 | 1.0 | 1064 | $930 | $0.87 | 46d | 1 | 1.33mi |
| 18 Center St Bessemer, AL | 3.0 | 1.0 | 1418 | $1,100 | $0.78 | 46d | 1 | 1.41mi |
| 10 Center St Bessemer, AL | 3.0 | 1.0 | 1152 | $1,000 | $0.87 | 46d | 1 | 1.45mi |
| 1830 Exeter Ave Bessemer, AL | 2.0 | 1.0 | 913 | $850 | $0.93 | 46d | 1 | 1.48mi |
| 420 19th St S Bessemer, AL | 2.0 | 1.0 | 910 | $850 | $0.93 | 46d | 1 | 1.49mi |
Listing history 2 events
-
2026-06-07remarks 318-char remark
-
2026-06-07$33,000 Pending
ⓘ Source: listings_history table (triggers on properties + properties_extension) + one-shot
backfill from property_details.listing_events for pre-trigger history.
Tax reassessment forecast AL · Resets to sale price
- Current annual tax
- $289 · $24/mo
- Projected year-2 tax
- $289 · $24/mo
- Expected delta
- $0/yr ($0/mo · 0.0%)
ⓘ Screening estimate from a state-policy table — verify with the county assessor before closing.
Climate risk First Street
- Flood 1/10 Low FEMA zone X (unshaded) · 0% chance over 30 yrs
- Wildfire 2/10 Low
- Heat 6/10 Major 7 d/yr ≥108°F today · 19 d/yr by 30 yrs out
- Wind 6/10 Major 33% chance of damaging wind over 30 yrs
- Air quality 3/10 Moderate 2 unhealthy d/yr today · 5 by 30 yrs out
Nearby sold comps map
Loading sold comps map…
Walkable amenities ~0.75 mi
Loading nearby amenities…
Taxation est. · year 1
- Rental income
- $14,513
- − Mortgage interest
- −$1,849
- − Property taxes
- −$289
- − Insurance
- −$165
- − Repairs & maintenance
- −$1,161
- − Management
- −$1,161
- − Depreciation
- −$960
- Taxable income
- $8,929
- Est. tax owed @ 24.0%
- −$2,143
- After-tax cash flow
- $6,792/yr
For passive investors: Depreciation is non-cash, so a rental often shows a tax loss while cash-flowing — sheltering income. Rental losses are passive: they offset passive income freely, and up to $25,000/yr can offset ordinary (W-2) income if you actively participate and your MAGI is under $100k (phasing out to $0 by $150k); unused losses carry forward. On sale, claimed depreciation is recaptured at up to 25%, and gains may owe capital-gains tax (a 1031 exchange can defer both). Figures are a year-1 estimate at your 24.0% rate — not tax advice; consult a CPA.
Schools (NCES district)
- District
- Jefferson County
- NCES district ID
- 0101920
- Math proficiency
- 9% ▼ -24.00%
- Reading proficiency
- 32% ▼ -5.00%
- Median HH income
- $51,712
- Composite
- 18.4/100
- National rank
- #8937
- State rank
- #104 of 129 in AL
Livability — Bessemer
- Score
- 59/100
- State rank
- #331
- US rank
- #20078
Category grades
Schools grade is shown separately in the Schools card above.
Census & demographics
- County
- Jefferson County · 527,445 people
- City population
- 48,018
- Metro
- Birmingham-Hoover, AL
- Population (ZIP)
- 23,126
- Household income
- $81,846
- Rent vs Own
- Severe rent burden
- 554.0
Population outlook (Jefferson County) Hauer SSP2
- Today (2025)
- 669,185 people
- By 2030
- 669,694 · +0.1%
- By 2040
- 661,388 · -1.2%
- By 2050
- 643,086 · -3.9%
- By 2075
- 577,267 · -13.7%
- By 2100
- 474,758 · -29.1%
Race, ethnicity, and origin ACS 2023
- Neighborhood character
- Diverse neighborhood (Simpson 0.56)
- Race & ethnicity
- Black 53% White 41% Hispanic / Latino 3% Two or more races 2% Asian 1%
- Common ancestry
- Italian 1% Slovak 1% Iranian 1%
- Foreign-born
- 4% · Canada, China
- Languages at home
- 96% English-only · Spanish 3% Chinese 1%
Political lean MEDSL · Jefferson
- 2024 margin
- D (+10.4) · D 54.6% · R 44.2% · Other 1.2%
- 2008→2024 swing
- +5.4pp toward D · 2008: 5.1pp · 2024: 10.4pp
- All cycles
- 2024: D+10.4 2020: D+13.2 2016: D+7.2 2012: D+6.0 2008: D+5.1
Not yet ingested
- Civics
- —
Market trends
- HPI YoY
- ▼ -55.40%
- Current HPI
- 219.3839
- Rent YoY
- ▲ 14.80%
- Metro
- Birmingham-Hoover, AL
- State GDP YoY
- ▲ 2.94%
- F500 in state
- 4
Industry mix (Fortune 500 HQ in AL)
| Industry | F500 HQs | Revenue |
|---|---|---|
| Financial Services | 1 | $8B |
|
||
| Healthcare | 1 | $5B |
|
||
Price history
1 event — show timeline
- 2026-05-14 Listed $33,000 Greater Alabama MLS
Property tax history
+0.0%/yrLatest (2025): $289 · +0.0% YoY. Source: county tax records.
Cash-flow waterfall
monthlySold comps — $/sqft
last 12 mo · ≤1 miLoading sold comps…