3590 S Ocean Blvd #102 · South Palm Beach, FL
Flood risk 10/10 · Severe
- FEMA flood zone
- AE
- Chance of flooding over 30 yrs
- 0.99%
- Est. flood insurance / yr
- $1,737 – $8,500
Fire risk 1/10 · Minimal
- Est. fire insurance / yr
- $947 – $1,759
Heat risk 10/10 · Severe
- Hot days now (above 104°F)
- 7 days/yr
- Hot days in 30 yrs
- 27 days/yr
Wind risk 10/10 · Severe
- Chance of severe wind over 30 yrs
- 99.0%
Air-quality risk 2/10 · Minimal
- Unhealthy air days now
- 2 days/yr
- Unhealthy air days in 30 yrs
- 2 days/yr
Risk factors via First Street. Map © Google.
Why this score? — see what drove the D+ grade
The composite is a weighted blend of 9 inputs, each scored 0–100. Each bar is that input's sub-score; the figure is the points it added to the 100-point composite (weight × sub-score).
- 1% rule +8.1/10.0
- Cash flow +7.9/30.0
- Appreciation +7.6/10.0
- ARV discount +7.5/15.0
- Schools +4.3/10.0
- Livability +3.6/5.0
- Rent growth +3.5/5.0
- Condition / age +2.5/5.0
- DSCR +2.0/10.0
$395,000
🖨 Deal sheet 📄 Offer letter ✓ Due diligence
Listing remarks
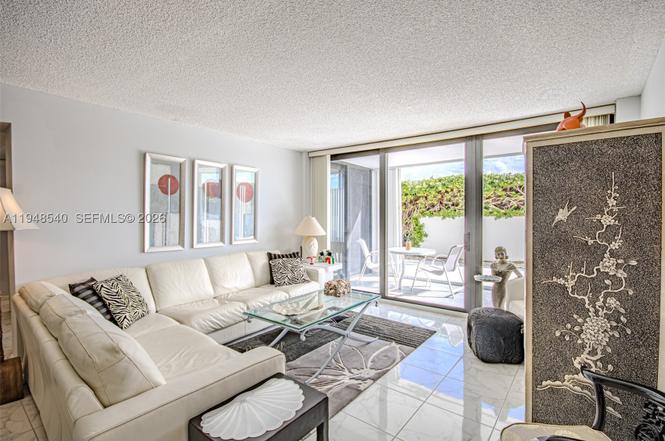
Turn-key, Fully furnished 2-bedroom, 2-bath residence located on the first floor of the desirable ocean-side building at Mayfair house. This well-maintained condo offers effortless island living with easy access-no elevators required. Spacious layout with abundant natural light and tasteful furnishings throughout. The building has undergone extensive recent improvements, concrete restoration, plumbing upgrades, roof replacement, brand new elevators, and additional capital enhancements, providing peace of mind for the new owner. Ideally situated on prestigious South Palm Beach Island, just steps from the ocean with full-service amenities to world-class dinning, shopping, golf, outdoor activi
Key facts
- Ocean-side building
- Concrete restoration
- Plumbing upgrades
Tags
Property features AI
Finance
- Financial info: Pets not allowed
- HOA & community: Monthly association fee; Association pays for cable TV, internet, pest control, sewer, trash and water; Community amenities include bike storage, clubhouse, elevators, fitness center, barbecue and picnic area
Exterior
- Parking: Assigned parking (1 space); 1 covered space; 1-space carport
- Security: Doorman; Key card entry; Phone entry system
- Utilities: Water service available; Sewer service available; Electric service available
- Home design: Attached property; Entry on level 1; 9-story building
- Construction: Block construction; Resale property
- Exterior features: Oceanfront property with ocean access; Storm/security shutters; Security/high-impact doors
Interior
- Kitchen: Dishwasher; Disposal
- Bedrooms: Bedroom located on the main level
- Flooring: Ceramic tile
- Bathrooms: 2 full bathrooms
- Heating & cooling: Central heating (electric); Central air conditioning (electric)
- Interior features: First-floor entry; Bedroom on the main level; Main-level primary suite; Split bedroom layout
- Laundry & utility: Dryer
Neighborhood map
What this means for you Summary
Snapshot
- This is a 2-bed/2.0-bath condo listed at $395k.
Deal economics
- At list price, monthly cash flow is $-841 ($-10k/yr) — negative.
- To cash-flow at today's rent, offer at most $246k (37.6% below list).
- Meets the 1% rule at list price ($5k rent vs $395k).
- Recommended offer: $246k (37.6% below list) — sets the bar for cash-flow.
Location & tenants
- Location reads 72/100 on livability (#340 in FL) — a middle-class / working-renter tenant base. Strengths: crime A+, housing A+, health & safety A+; Watch: schools C-, amenities F, commute F.
- Palm Beach (suburban): math 46% / reading 53% proficiency, ranked #34 of 73 in FL (top 47%) — families likely to look elsewhere, expect single-tenant / working-renter base with shorter leases.
- Market conditions: Rents rising (+3.9%/yr); 447 active listings in the ZIP; 40 comparable units currently listed for rent nearby; rentals at typical pace (median 24d on market — plan ~3-4 weeks tenant-placement turnaround); high-income renter base; 3,974 units permitted in Palm Beach County in 2024 (1,012 in 5+ unit buildings).
- This rent runs 41% of the median local income ($151k/yr) — at the standard rent-burdened threshold; future hikes will face affordability resistance.
Forward outlook
- In year one you build about $23k of equity ($3k loan paydown + $20k appreciation (5.1% local appreciation)).
- Palm Beach County population projected at +30% by 2050 — long-run rental-demand tailwind backs the buy-and-hold thesis.
- By year 2, paydown + projected appreciation supports a ~$37k cash-out refi (75% LTV) — recoverable capital for the next deal without selling this one.
Negotiation context
- It's been on market 136 days — a 12% lower offer ($348k) is reasonable based on typical stale-listing flexibility.
- Current owner paid $165k; list at $395k implies a 139% gain — meaningful room to come down on a strong offer.
Risks & watch-outs
- Watch-outs: flood insurance adds $427/mo; HOA is 33% of rent.
- Climate carrying-cost: in FEMA flood zone AE (mandatory federal flood insurance); severe wind risk, 99% chance of damaging wind over 30y; extreme-heat days projected 7→27/yr by 2055 (HVAC capex compounding) — expect insurance premiums to compound above CPI over the hold.
Questions for the listing agent
- What do current leases actually rent for vs. the listed asking? Can we see a recent rent roll and the last 12 months of T-12 income?
- It's been on market 136 days. Have you received any prior offers? Is the seller open to a 38% concession, seller financing, or rate buy-down credit?
- Built in 1974 — when were the roof, HVAC, electrical panel, plumbing, and water heater last replaced?
- What's the actual annual flood-insurance premium (NFIP or private), and is the property in a SFHA with mandatory coverage?
- What does the HOA fee cover, when was the last increase, and are there any pending special assessments or reserve-fund shortfalls?
- Any open or pending special assessments — roof, HVAC, plumbing, elevator, façade? What's the per-unit balance and payoff schedule, and is the seller paying it off at close or rolling it to the buyer?
- Why hasn't it sold? Are there any deal-killer items the seller is aware of (foundation, flood, title, zoning, code violations)?
- Is there a deadline driving the sale (1031 exchange, divorce, estate, relocation)? That informs how much negotiation room exists.
- The area grade is low — what's the realistic commute time and amenity access for the typical tenant pool here? Any planned neighborhood developments (good or bad) we should know about?
- What's the average days-on-market for RENTAL listings here right now (not sales)? A rising rental-DOM trend means longer vacancies and softer asking-rent achievability than the comps imply.
- What's the recent tenant-quality profile in this submarket — average credit score on applications, eviction rate, late-payment / NSF rate, and stable-employment percentage? A property-management company in the area should have these aggregated.
- How much new apartment / multifamily construction is in the pipeline within 1–3 miles? Heavy new supply (>2% of stock underway) typically softens rents 12–24 months out; light construction supports rent growth.
Investment metrics
- 1% rule
- 1.31% ✓
- Cap rate
- 5.03%
- Cash-on-cash
- -4.50%
- DSCR
- 0.80
- GRM
- 6.3
CMA / ARV
No comps found within radius.
Projected returns pro-forma
5.12% appreciation · 3.92% rent growth · sell at horizon
- IRR
- 6.4%
- Equity multiple
- 1.42×
- Total profit
- $46,333
- Equity at exit
- $226,603
- IRR
- 9.3%
- Equity multiple
- 2.79×
- Total profit
- $197,858
- Equity at exit
- $393,390
Cash invested: $110,600 (down + closing). Projections, not guarantees.
Landlord ↔ Tenant lean methodology
- Overall (STATE)
- 87 Strongly Landlord-Friendly
- State Florida
- 87 Strongly Landlord-Friendly · R+3
- County
- — inherits STATE
- City
- — inherits STATE
ZIP-level market 33480
- Home prices YoY
- 1.1%
- Rents YoY
- 3.9%
- Active inventory
- 447
- Price-to-rent
- 6.3×
Monthly cashflow live
- Estimated rent
- $5,190 high interval (Pro) →
- Mortgage (P&I)
- −$2,071
- Tax from tax record
- −$550 /mo · $6,604/yr
- Insurance
- −$165
- Flood insurance flood zone
- −$427 /mo · $5,118/yr
- HOA
- −$1,729
- Vacancy / Maint / Mgmt
- −$1,090
- Net cashflow
- $-841
Break-even live
UW: 25.0% down · 7.5% · 30yr · 1.5% tax · 5.0% vac · 8.0% maint · 8.0% mgmt
Financing live
Cash to close
- Down payment
- $98,750
- Closing costs
- $11,850
- Reserves months
- —
- Total cash needed
- —
Loan-product check · same deal, 3 products live
Conventional
25% down · 7.5% · 30yr
- Down + closing
- —
- Monthly P&I
- —
- Monthly cashflow
- —
- DSCR
- —
- Eligible?
- —
Personal DTI + credit; lowest rate.
DSCR
20% down · 8.5% · 30yr
- Down + closing
- —
- Monthly P&I
- —
- Monthly cashflow
- —
- DSCR
- —
- Eligible?
- —
No personal income docs; deal must DSCR.
Hard money
10% down · 12.0% · 12mo
- Down + closing
- —
- Monthly P&I
- —
- Monthly cashflow
- —
- DSCR
- —
- Eligible?
- —
Short-term bridge; refi at stabilization.
Rent comps 40 comps
| Address | Beds | Baths | Sqft | Rent | $/sqft | DOM | Units | Dist |
|---|---|---|---|---|---|---|---|---|
| 3610 S Ocean Blvd Palm Beach, FL | 1.0–3.0 | 1.5–2.0 | 1490 | $8,348 | $5.60 | 24d | 4 | 0.05mi |
| 3580 S Ocean Blvd Unit 6B Palm Beach, FL | 1.0 | 1.5 | 1013 | $2,500 | $2.47 | 14d | 1 | 0.07mi |
| 3605 S Ocean Blvd Palm Beach, FL | 2.0 | 2.0 | 1162 | $3,350 | $2.88 | 24d | 2 | 0.09mi |
| 3589 S Ocean Blvd #614 Palm Beach, FL | 2.0 | 2.0 | 1541 | $4,200 | $2.73 | 20d | 1 | 0.11mi |
| 3589 S Ocean Blvd #801 Palm Beach, FL | 2.0 | 2.0 | 1541 | $6,000 | $3.89 | 11d | 1 | 0.11mi |
| 3589 S Ocean Blvd #314 Palm Beach, FL | 2.0 | 2.5 | 1541 | $3,000 | $1.95 | 24d | 1 | 0.11mi |
| 3589 S Ocean Blvd #614 Palm Beach, FL | 2.0 | 2.0 | 1541 | $4,200 | $2.73 | 24d | 1 | 0.11mi |
| 4200 S Ocean Blvd #503 Palm Beach, FL | 2.0 | 2.5 | 1645 | $4,800 | $2.92 | 20d | 1 | 0.11mi |
| 3601 S Ocean Blvd #308 Palm Beach, FL | 2.0 | 2.5 | 1408 | $3,250 | $2.31 | 18d | 1 | 0.11mi |
| 3601 S Ocean Blvd Palm Beach, FL | 2.0 | 2.5 | 1408 | $2,900 | $2.06 | 19d | 2 | 0.11mi |
| 3605 S Ocean Blvd #319 Palm Beach, FL | 2.0 | 2.0 | 1121 | $4,000 | $3.57 | 4d | 1 | 0.12mi |
| 3581 S Ocean Blvd Unit 2B Palm Beach, FL | 1.0 | 1.5 | 940 | $2,900 | $3.09 | 16d | 1 | 0.12mi |
| 3581 S Ocean Blvd Unit 9A Palm Beach, FL | 2.0 | 2.0 | 1192 | $2,600 | $2.18 | 16d | 1 | 0.12mi |
| 3560 S Ocean Blvd #907 Palm Beach, FL | 2.0 | 2.0 | 1340 | $7,800 | $5.82 | 11d | 1 | 0.15mi |
| 3560 S Ocean Blvd #4 Palm Beach, FL | 2.0 | 2.0 | 1340 | $7,950 | $5.93 | 24d | 1 | 0.15mi |
| 3560 S Ocean Blvd #907 Palm Beach, FL | 2.0 | 2.0 | 1340 | $7,500 | $5.60 | 11d | 1 | 0.15mi |
| 3560 S Ocean Blvd #706 Palm Beach, FL | 2.0 | 2.0 | 1340 | $12,000 | $8.96 | 20d | 1 | 0.15mi |
| 3560 S Ocean Blvd #306 Palm Beach, FL | 2.0 | 2.0 | 1380 | $7,000 | $5.07 | 18d | 1 | 0.15mi |
| 3560 S Ocean Blvd #502 Palm Beach, FL | 2.0 | 2.0 | 1340 | $9,500 | $7.09 | 24d | 1 | 0.15mi |
| 3540 S Ocean Blvd #216 Palm Beach, FL | 2.0 | 2.0 | 983 | $2,550 | $2.59 | 21d | 1 | 0.27mi |
| 3540 S Ocean Blvd #208 Palm Beach, FL | 2.0 | 2.0 | 983 | $2,750 | $2.80 | 3d | 1 | 0.27mi |
| 3540 S Ocean Blvd Palm Beach, FL | 1.0 | 2.0 | 983 | $4,000 | $4.07 | 24d | 1 | 0.27mi |
| 3540 S Ocean Blvd #612 Palm Beach, FL | 2.0 | 2.0 | 983 | $4,700 | $4.78 | 7d | 1 | 0.27mi |
| 3540 S Ocean Blvd #608 Palm Beach, FL | 2.0 | 2.0 | 983 | $2,950 | $3.00 | 24d | 1 | 0.27mi |
| 3520 S Ocean Blvd Unit H404 Palm Beach, FL | 2.0 | 2.0 | 1176 | $5,900 | $5.02 | 24d | 1 | 0.31mi |
| 3475 S Ocean Blvd #3020 Palm Beach, FL | 2.0 | 2.0 | 1395 | $5,000 | $3.58 | 24d | 1 | 0.40mi |
| 3475 S Ocean Blvd #3110 Palm Beach, FL | 1.0 | 1.5 | 891 | $2,600 | $2.92 | 24d | 1 | 0.40mi |
| 3475 S Ocean Blvd #6150 Palm Beach, FL | 2.0 | 2.0 | 1395 | $8,750 | $6.27 | 24d | 1 | 0.40mi |
| 3475 S Ocean Blvd #6110 Palm Beach, FL | 1.0 | 1.5 | 891 | $3,500 | $3.93 | 24d | 1 | 0.40mi |
| 3475 S Ocean Blvd #1030 Palm Beach, FL | 1.0 | 2.0 | 1395 | $5,500 | $3.94 | 2d | 1 | 0.40mi |
| 3475 S Ocean Blvd Palm Beach, FL | 2.0 | 2.0 | 1395 | $5,850 | $4.19 | 24d | 3 | 0.41mi |
| 400 S Ocean Blvd Unit 103a Manalapan, FL | 3.0 | 3.5 | 1399 | $21,000 | $15.01 | 24d | 1 | 0.42mi |
| 3456 S Ocean Blvd Apt 705 Palm Beach, FL | 2.0 | 2.0 | 1457 | $3,500 | $2.40 | 24d | 1 | 0.47mi |
| 3460 S Ocean Blvd #4150 Palm Beach, FL | 2.0 | 2.0 | 1436 | $10,500 | $7.31 | 24d | 1 | 0.47mi |
| 3456 S Ocean Blvd #105 Palm Beach, FL | 2.0 | 2.0 | 1482 | $12,000 | $8.10 | 24d | 1 | 0.47mi |
| 3456 S Ocean Blvd #6050 Palm Beach, FL | 2.0 | 2.0 | 1482 | $4,650 | $3.14 | 24d | 1 | 0.47mi |
| 3450 S Ocean Blvd Palm Beach, FL | 1.0–2.0 | 1.0–2.0 | 1236 | $9,500 | $7.69 | 2d | 10 | 0.52mi |
| 3450 S Ocean Blvd Palm Beach, FL | 1.0–2.0 | 1.0–2.0 | 1236 | $9,500 | $7.69 | 7d | 9 | 0.52mi |
| 3450 S Ocean Blvd #3280 Palm Beach, FL | 1.0 | 1.0 | 952 | $2,500 | $2.63 | 24d | 1 | 0.52mi |
| 3450 S Ocean Blvd #4270 Palm Beach, FL | 1.0 | 1.0 | 924 | $3,250 | $3.52 | 24d | 1 | 0.52mi |
HOA detail condo
- Monthly dues
- $1,729 · $20,748/yr
- Assessments
- None detected in remarks — confirm with the listing agent.
Listing history 10 events
-
2026-06-07status $395,000 Pending 136 DOM
-
2026-06-04days on market $395,000 Active Under Contract 136 DOM
-
2026-06-03days on market $395,000 Active Under Contract 135 DOM
-
2026-06-01days on market $395,000 Active Under Contract 133 DOM
-
2026-05-31days on market $395,000 Active Under Contract 132 DOM
-
2026-05-15price $395,000
-
2026-02-25price $425,000
-
2026-01-19$450,000 Active
-
1994-05-24soldstatus $165,000
-
1992-05-20soldstatus $190,000
ⓘ Source: listings_history table (triggers on properties + properties_extension) + one-shot
backfill from property_details.listing_events for pre-trigger history.
Tax reassessment forecast FL · Resets to sale price
- Current annual tax
- $6,604 · $550/mo
- Projected year-2 tax
- $6,603 · $550/mo
- Expected delta
- $0/yr ($0/mo · -0.0%)
ⓘ Screening estimate from a state-policy table — verify with the county assessor before closing.
Climate risk First Street
- Flood 10/10 Extreme FEMA zone AE · 99% chance over 30 yrs
- Wildfire 1/10 Low
- Heat 10/10 Extreme 7 d/yr ≥104°F today · 27 d/yr by 30 yrs out
- Wind 10/10 Extreme 99% chance of damaging wind over 30 yrs
- Air quality 2/10 Low 2 unhealthy d/yr today · 2 by 30 yrs out
Nearby sold comps map
Loading sold comps map…
Walkable amenities ~0.75 mi
Loading nearby amenities…
Taxation est. · year 1
- Rental income
- $62,285
- − Mortgage interest
- −$22,126
- − Property taxes
- −$6,604
- − Insurance
- −$7,094
- − Repairs & maintenance
- −$4,983
- − Management
- −$4,983
- − HOA
- −$20,748
- − Depreciation
- −$11,491
- Taxable loss
- −$15,743
- Est. tax savings @ 24.0%
- +$3,778
- After-tax cash flow
- $-6,319/yr
For passive investors: Depreciation is non-cash, so a rental often shows a tax loss while cash-flowing — sheltering income. Rental losses are passive: they offset passive income freely, and up to $25,000/yr can offset ordinary (W-2) income if you actively participate and your MAGI is under $100k (phasing out to $0 by $150k); unused losses carry forward. On sale, claimed depreciation is recaptured at up to 25%, and gains may owe capital-gains tax (a 1031 exchange can defer both). Figures are a year-1 estimate at your 24.0% rate — not tax advice; consult a CPA.
Schools (NCES district)
- District
- Palm Beach
- NCES district ID
- 1201500
- Math proficiency
- 46% ▼ -16.00%
- Reading proficiency
- 53% ▼ -4.00%
- Median HH income
- $53,943
- Composite
- 42.72/100
- National rank
- #3160
- State rank
- #34 of 73 in FL
Livability — South Palm Beach
- Score
- 72/100
- State rank
- #340
- US rank
- #5907
Category grades
Schools grade is shown separately in the Schools card above.
Census & demographics
- Census place
- South Palm Beach, FL
- County
- Palm Beach County · 1,438,312 people
- Metro
- Miami-Fort Lauderdale-Pompano Beach, FL
- Population (ZIP)
- 10,924
- Household income
- $150,633
- Rent vs Own
- Severe rent burden
- 213.0
Population outlook (Palm Beach County) Hauer SSP2
- Today (2025)
- 1,637,487 people
- By 2030
- 1,743,255 · +6.5%
- By 2040
- 1,948,712 · +19.0%
- By 2050
- 2,132,979 · +30.3%
- By 2075
- 2,530,027 · +54.5%
- By 2100
- 2,706,979 · +65.3%
Race, ethnicity, and origin ACS 2023
- Neighborhood character
- Predominantly White (89%)
- Race & ethnicity
- White 89% Hispanic / Latino 7% Two or more races 6% Asian 1%
- Hispanic origin (detail)
- Mexican 1% Puerto Rican 1% Cuban 1%
- Common ancestry
- Scotch-Irish 7% Romanian 5% Italian 3%
- Foreign-born
- 20% · Canada, Dominican Republic, China
- Languages at home
- 84% English-only · Spanish 7% Other Indo-European 3% Russian/Polish/Slavic 2%
Political lean MEDSL · Palm Beach
- 2024 margin
- Toss-up / Even · D 50.0% · R 49.2%
- 2008→2024 swing
- -22.1pp toward R · 2008: 22.9pp · 2024: 0.8pp
- All cycles
- 2024: D+0.8 2020: D+12.8 2016: D+15.3 2012: D+17.0 2008: D+22.9
Not yet ingested
- Civics
- —
Market trends
- HPI YoY
- ▲ 5.12%
- Current HPI
- 464.2769
- Rent YoY
- ▲ 3.92%
- Metro
- Miami-Fort Lauderdale-Pompano Beach, FL
- State GDP YoY
- ▲ 3.28%
- F500 in state
- 36
Industry mix (Fortune 500 HQ in FL)
| Industry | F500 HQs | Revenue |
|---|---|---|
| Industrial Technology | 2 | $29B |
|
||
| Insurance | 2 | $17B |
|
||
| Retail | 1 | $60B |
|
||
| Technology Distribution | 1 | $58B |
|
||
| Homebuilding | 1 | $35B |
|
||
| Technology Manufacturing | 1 | $35B |
|
||
Price history
+107.9% since first listed5 events — show timeline
- 2026-05-15 Price Changed $395,000 MARMLS
- 2026-02-25 Price Changed $425,000 MARMLS
- 2026-01-19 Listed $450,000 MARMLS
- 1994-05-24 Sold (Public Records) $165,000 Public Records
- 1992-05-20 Sold (Public Records) $190,000 Public Records
Property tax history
+1.1%/yrLatest (2025): $6,604 · -7.9% YoY. Source: county tax records.
Cash-flow waterfall
monthlySold comps — $/sqft
last 12 mo · ≤1 miLoading sold comps…