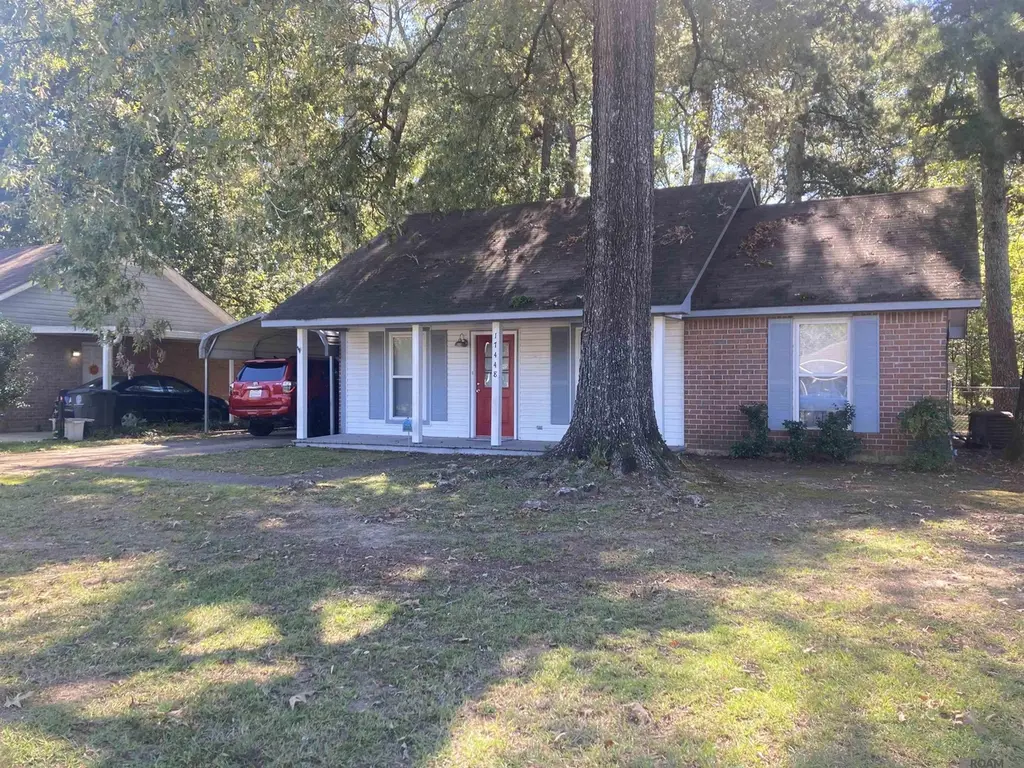
17448 Ashton Ave · Central, LA
Flood risk 1/10 · Minimal
- FEMA flood zone
- X (unshaded)
- Chance of flooding over 30 yrs
- 0.0%
- Est. flood insurance / yr
- $507 – $1,088
Fire risk 1/10 · Minimal
- Est. fire insurance / yr
- $1,269 – $2,357
Heat risk 8/10 · Major
- Hot days now (above 108°F)
- 7 days/yr
- Hot days in 30 yrs
- 20 days/yr
Wind risk 9/10 · Severe
- Chance of severe wind over 30 yrs
- 99.0%
Air-quality risk 3/10 · Minor
- Unhealthy air days now
- 2 days/yr
- Unhealthy air days in 30 yrs
- 3 days/yr
Risk factors via First Street. Map © Google.
Why this score? — see what drove the C grade
The composite is a weighted blend of 9 inputs, each scored 0–100. Each bar is that input's sub-score; the figure is the points it added to the 100-point composite (weight × sub-score).
- Cash flow +20.6/30.0
- ARV discount +11.9/15.0
- DSCR +6.5/10.0
- 1% rule +4.8/10.0
- Schools +4.6/10.0
- Livability +3.7/5.0
- Rent growth +2.5/5.0
- Condition / age +2.5/5.0
- Appreciation +0.0/10.0
$180,000
🖨 Deal sheet 📄 Offer letter ✓ Due diligence
Listing remarks MLS
Come make this precious cottage your home. Home updated in 2014, with new paint, appliances, bathroom fixtures. Current owner added the carport and fenced the back yard. Great home for first time home owner or single owner. Lovely, large back patio that is covered for your home backyard gatherings. Put this home on your list to see.
Key facts
- Fenced back yard
- Large back patio
- Added carport
Tags
Neighborhood map
What this means for you Summary
Snapshot
- This is a 3-bed/1.0-bath single-family listed at $180k.
Deal economics
- At list price, monthly cash flow is $240 ($3k/yr) — positive.
- The deal already cash-flows at list — no discount required.
- To meet the 1% rule (rent ≥ 1% of price), the offer needs to be $176k (2.4% below list).
- Recommended offer: $158k (12.0% below list) — sets the bar for market timing.
- Cap rate 7.9% vs local median 3.3% in Central — top-decile yield for the area; either an underpriced asset or a hidden risk that comps aren't pricing in. Stress-test before assuming the spread holds.
Location & tenants
- Location reads 74/100 on livability (#25 in LA, #4,761 nationally) — a middle-class / working-renter tenant base. Strengths: schools A+, employment A+, housing A+; Watch: amenities F, commute F.
- Central Community School District (suburban): math 50% / reading 54% proficiency, ranked #9 of 98 in LA (top 9%) — acceptable for families but not a draw, mixed tenant base, ~2y average lease.
- Market conditions: 110 active listings in the ZIP; 2,252 units permitted in East Baton Rouge Parish in 2024 (440 in 5+ unit buildings).
Forward outlook
- Local home prices are declining (-3.0%/yr); year-one equity from $1k of loan paydown is wiped out by about $5k of value loss. Plan a longer hold.
- East Baton Rouge County population projected at +4% by 2050 — modest demand growth; plan on rents tracking national, not racing it.
Negotiation context
- It's been on market 229 days — a 12% lower offer ($158k) is reasonable based on typical stale-listing flexibility.
- 12 sale attempts since 22y ago; this cycle's ask has dropped $15k (8%) from the opening price — seller is motivated, your offer sets the floor, not the list.
- Current owner paid $126k; 43% above their basis — modest negotiation headroom, anchor on the comps not their cost.
Risks & watch-outs
- Climate carrying-cost: severe wind risk, 99% chance of damaging wind over 30y; extreme-heat days projected 7→20/yr by 2055 (HVAC capex compounding) — expect insurance premiums to compound above CPI over the hold.
Questions for the listing agent
- It's been on market 229 days. Have you received any prior offers? Is the seller open to a 12% concession, seller financing, or rate buy-down credit?
- Why hasn't it sold? Are there any deal-killer items the seller is aware of (foundation, flood, title, zoning, code violations)?
- Is there a deadline driving the sale (1031 exchange, divorce, estate, relocation)? That informs how much negotiation room exists.
- Schools are A-rated — typically a magnet for longer-tenancy family renters. What's the average tenant stay here, and is there a school-zone premium baked into asking?
- What's the average days-on-market for RENTAL listings here right now (not sales)? A rising rental-DOM trend means longer vacancies and softer asking-rent achievability than the comps imply.
- What's the recent tenant-quality profile in this submarket — average credit score on applications, eviction rate, late-payment / NSF rate, and stable-employment percentage? A property-management company in the area should have these aggregated.
- How much new for-sale + rental construction is in the pipeline within 1–3 miles? Heavy new supply typically softens prices + rents 12–24 months out; constrained supply supports both.
Investment metrics
- 1% rule
- 0.98% ✗
- Cap rate
- 7.89%
- Cash-on-cash
- 5.71%
- DSCR
- 1.25
- GRM
- 8.5
CMA / ARV
- ARV (median comp)
- $199,487
- List price
- $180,000
- Delta
- -9.77%
- Verdict
- FAIR
- Comps
- 20 within 1.0 mi
Show comp detail 9 sales within ~0.75 mi
| Address | Dist | Beds/Ba | Sqft | Sold | Price | $/sf | Match |
|---|---|---|---|---|---|---|---|
| 17524 Sally Ave | 0.06mi | 3/1.0 | 1,002 (+1%) | 2mo | $185,000 | $185 | 93 |
| 17546 Hedges Dr | 0.13mi | 3/1.0 | 1,042 (+6%) | 11mo | $175,000 | $168 | 76 |
| 11026 Ronson Dr | 0.12mi | 3/1.0 | 1,060 (+7%) | 9mo | $199,000 | $188 | 75 |
| 17536 Hedges Dr | 0.12mi | 3/1.0 | 1,070 (+8%) | 16mo | $165,000 | $154 | 68 |
| 11237 Logan Dr | 0.28mi | 3/1.0 | 1,057 (+7%) | 16mo | $180,000 | $170 | 62 |
| 11146 Shandon Dr | 0.18mi | 3/1.0 | 1,080 (+9%) | 20mo | $99,900 | $93 | 59 |
| 11173 Village Green Dr | 0.19mi | 3/1.5 | 1,098 (+11%) | 14mo | $189,000 | $172 | 59 |
| 17311 Lawnside Ave | 0.28mi | 3/1.0 | 1,116 (+13%) | 15mo | $170,000 | $152 | 53 |
| 11329 Norway Pine Dr | 0.50mi | 3/1.0 | 1,052 (+6%) | 17mo | $165,000 | $157 | 52 |
Match score weights: distance 35% · size 25% · config 20% · recency 20%. Top-matched comps best support the ARV.
Projected returns pro-forma
-3.0% appreciation · 3.0% rent growth · sell at horizon
- IRR
- -7.5%
- Equity multiple
- 0.72×
- Total profit
- $-13,916
- Equity at exit
- $26,839
- IRR
- 2.1%
- Equity multiple
- 1.15×
- Total profit
- $7,431
- Equity at exit
- $15,563
Cash invested: $50,400 (down + closing). Projections, not guarantees.
Landlord ↔ Tenant lean methodology
- Overall (STATE)
- 90 Strongly Landlord-Friendly
- State Louisiana
- 90 Strongly Landlord-Friendly · R+12
- County
- — inherits STATE
- City
- — inherits STATE
ZIP-level market 70739
- Active inventory
- 110
- Price-to-rent
- 8.5×
Monthly cashflow live
- Estimated rent
- $1,756 medium interval (Pro) →
- Mortgage (P&I)
- −$944
- Tax from tax record
- −$129 /mo · $1,543/yr
- Insurance
- −$75
- HOA
- −$0
- Vacancy / Maint / Mgmt
- −$369
- Net cashflow
- $240
Break-even live
UW: 25.0% down · 7.5% · 30yr · 1.5% tax · 5.0% vac · 8.0% maint · 8.0% mgmt
Financing live
Cash to close
- Down payment
- $45,000
- Closing costs
- $5,400
- Reserves months
- —
- Total cash needed
- —
Loan-product check · same deal, 3 products live
Conventional
25% down · 7.5% · 30yr
- Down + closing
- —
- Monthly P&I
- —
- Monthly cashflow
- —
- DSCR
- —
- Eligible?
- —
Personal DTI + credit; lowest rate.
DSCR
20% down · 8.5% · 30yr
- Down + closing
- —
- Monthly P&I
- —
- Monthly cashflow
- —
- DSCR
- —
- Eligible?
- —
No personal income docs; deal must DSCR.
Hard money
10% down · 12.0% · 12mo
- Down + closing
- —
- Monthly P&I
- —
- Monthly cashflow
- —
- DSCR
- —
- Eligible?
- —
Short-term bridge; refi at stabilization.
Listing history 33 events
-
2026-06-07days on market $180,000 Active 229 DOM
-
2026-06-05days on market $180,000 Active 226 DOM
-
2026-06-03days on market $180,000 Active 225 DOM
-
2026-06-02days on market $180,000 Active 224 DOM
-
2026-06-01days on market $180,000 Active 223 DOM
-
2026-05-31days on market $180,000 Active 222 DOM
-
2026-05-31days on market $180,000 Active 221 DOM
-
2026-04-29price $180,000 334-char remark
Show marketing remark (334 chars)
Come make this precious cottage your home. Home updated in 2014, with new paint, appliances, bathroom fixtures. Current owner added the carport and fenced the back yard. Great home for first time home owner or single owner. Lovely, large back patio that is covered for your home backyard gatherings. Put this home on your list to see.
-
2026-04-28price $180,000 334-char remark
Show marketing remark (334 chars)
Come make this precious cottage your home. Home updated in 2014, with new paint, appliances, bathroom fixtures. Current owner added the carport and fenced the back yard. Great home for first time home owner or single owner. Lovely, large back patio that is covered for your home backyard gatherings. Put this home on your list to see.
-
2026-03-18price $185,000 334-char remark
Show marketing remark (334 chars)
Come make this precious cottage your home. Home updated in 2014, with new paint, appliances, bathroom fixtures. Current owner added the carport and fenced the back yard. Great home for first time home owner or single owner. Lovely, large back patio that is covered for your home backyard gatherings. Put this home on your list to see.
-
2025-10-21$195,000 Active 334-char remark
Show marketing remark (334 chars)
Come make this precious cottage your home. Home updated in 2014, with new paint, appliances, bathroom fixtures. Current owner added the carport and fenced the back yard. Great home for first time home owner or single owner. Lovely, large back patio that is covered for your home backyard gatherings. Put this home on your list to see.
-
2019-04-11soldstatus $126,000
-
2019-04-10soldstatus Sold
-
2019-03-04status Pending
-
2019-02-27price $126,000
-
2018-12-27$130,000 Active
-
2018-12-27$126,000
-
2015-03-03soldstatus
-
2015-01-16$115,000
-
2015-01-16$115,000
-
2014-10-17$145,000
-
2014-10-17$145,000
-
2014-05-05soldstatus $67,595
-
2014-05-01soldstatus
-
2014-01-30$74,900
-
2014-01-30$74,900
-
2014-01-09soldstatus $95,830
-
2007-05-11soldstatus $107,000
-
2004-04-30soldstatus
-
2004-01-28$85,000
-
2004-01-28$85,000
ⓘ Source: listings_history table (triggers on properties + properties_extension) + one-shot
backfill from property_details.listing_events for pre-trigger history.
Tax reassessment forecast LA · Resets to sale price
- Current annual tax
- $1,543 · $129/mo
- Projected year-2 tax
- $1,543 · $129/mo
- Expected delta
- $0/yr ($0/mo · 0.0%)
ⓘ Screening estimate from a state-policy table — verify with the county assessor before closing.
Climate risk First Street
- Flood 1/10 Low FEMA zone X (unshaded) · 0% chance over 30 yrs
- Wildfire 1/10 Low
- Heat 8/10 Severe 7 d/yr ≥108°F today · 20 d/yr by 30 yrs out
- Wind 9/10 Extreme 99% chance of damaging wind over 30 yrs
- Air quality 3/10 Moderate 2 unhealthy d/yr today · 3 by 30 yrs out
Nearby sold comps map
Loading sold comps map…
Walkable amenities ~0.75 mi
Loading nearby amenities…
Taxation est. · year 1
- Rental income
- $21,075
- − Mortgage interest
- −$10,083
- − Property taxes
- −$1,543
- − Insurance
- −$900
- − Repairs & maintenance
- −$1,686
- − Management
- −$1,686
- − Depreciation
- −$5,236
- Taxable loss
- −$58
- Est. tax savings @ 24.0%
- +$14
- After-tax cash flow
- $2,894/yr
For passive investors: Depreciation is non-cash, so a rental often shows a tax loss while cash-flowing — sheltering income. Rental losses are passive: they offset passive income freely, and up to $25,000/yr can offset ordinary (W-2) income if you actively participate and your MAGI is under $100k (phasing out to $0 by $150k); unused losses carry forward. On sale, claimed depreciation is recaptured at up to 25%, and gains may owe capital-gains tax (a 1031 exchange can defer both). Figures are a year-1 estimate at your 24.0% rate — not tax advice; consult a CPA.
Schools (NCES district)
- District
- Central Community School District
- NCES district ID
- 2200125
- Math proficiency
- 50% ▼ -32.00%
- Reading proficiency
- 54% ▼ -31.00%
- Median HH income
- $66,584
- Composite
- 46.02/100
- National rank
- #2528
- State rank
- #9 of 98 in LA
Livability — Central
- Score
- 74/100
- State rank
- #25
- US rank
- #4761
Category grades
Schools grade is shown separately in the Schools card above.
Census & demographics
- Census place
- Central, LA
- City population
- 10,403
- Population (ZIP)
- 13,714
Population outlook (East Baton Rouge County) Hauer SSP2
- Today (2025)
- 464,810 people
- By 2030
- 472,137 · +1.6%
- By 2040
- 480,243 · +3.3%
- By 2050
- 484,422 · +4.2%
- By 2075
- 492,069 · +5.9%
- By 2100
- 476,347 · +2.5%
Race, ethnicity, and origin ACS 2023
- Neighborhood character
- Predominantly White (79%)
- Race & ethnicity
- White 79% Two or more races 10% Black 9% Hispanic / Latino 6%
- Hispanic origin (detail)
- Mexican 1%
- Common ancestry
- Lithuanian 12% Italian 4% Serbian 1%
- Foreign-born
- 2% · Canada, Guatemala, Vietnam
- Languages at home
- 97% English-only · Spanish 2%
Political lean MEDSL · East Baton Rouge
- 2024 margin
- D (+11.1) · D 54.5% · R 43.4% · Other 2.1%
- 2008→2024 swing
- +8.9pp toward D · 2008: 2.2pp · 2024: 11.1pp
- All cycles
- 2024: D+11.1 2020: D+13.1 2016: D+9.2 2012: D+5.2 2008: D+2.2
Not yet ingested
- Civics
- —
Market trends
- HPI YoY
- ▼ -100.93%
- Current HPI
- 183.5126
- Rent YoY
- —
- Metro
- —
- State GDP YoY
- ▲ 3.29%
- F500 in state
- 10
Industry mix (Fortune 500 HQ in LA)
| Industry | F500 HQs | Revenue |
|---|---|---|
| Telecommunications | 2 | $23B |
|
||
| Utilities | 1 | $12B |
|
||
| Wholesale / Distribution | 1 | $5B |
|
||
| Advertising | 1 | $2B |
|
||
Price history
+111.8% since first listed26 events — show timeline
- 2026-04-29 Price Changed $180,000 AcadianaMLS
- 2026-04-28 Price Changed $180,000 GBRMLS
- 2026-03-18 Price Changed $185,000 AcadianaMLS
- 2026-03-18 Price Changed $185,000 GBRMLS
- 2025-10-21 Listed $195,000 GBRMLS
- 2025-10-21 Listed $195,000 AcadianaMLS
- 2019-04-11 Sold (Public Records) $126,000 Public Records
- 2019-04-10 Sold (MLS) — GBRMLS
- 2019-03-04 Pending — GBRMLS
- 2019-02-27 Price Changed $126,000 GBRMLS
- 2018-12-27 Listed $126,000 AcadianaMLS
- 2018-12-27 Listed $130,000 GBRMLS
- 2015-03-03 Sold (MLS) — GBRMLS
- 2015-01-16 Listed $115,000 AcadianaMLS
- 2015-01-16 Listed $115,000 GBRMLS
- 2014-10-17 Listed $145,000 AcadianaMLS
- 2014-10-17 Listed $145,000 GBRMLS
- 2014-05-05 Sold (Public Records) $67,595 Public Records
- 2014-05-01 Sold (MLS) — GBRMLS
- 2014-01-30 Listed $74,900 GBRMLS
- 2014-01-30 Listed $74,900 AcadianaMLS
- 2014-01-09 Sold (Public Records) $95,830 Public Records
- 2007-05-11 Sold (Public Records) $107,000 Public Records
- 2004-04-30 Sold (MLS) — GBRMLS
- 2004-01-28 Listed $85,000 GBRMLS
- 2004-01-28 Listed $85,000 AcadianaMLS
Property tax history
+12.1%/yrLatest (2025): $1,543 · -0.4% YoY. Source: county tax records.
Cash-flow waterfall
monthlySold comps — $/sqft
last 12 mo · ≤1 miLoading sold comps…