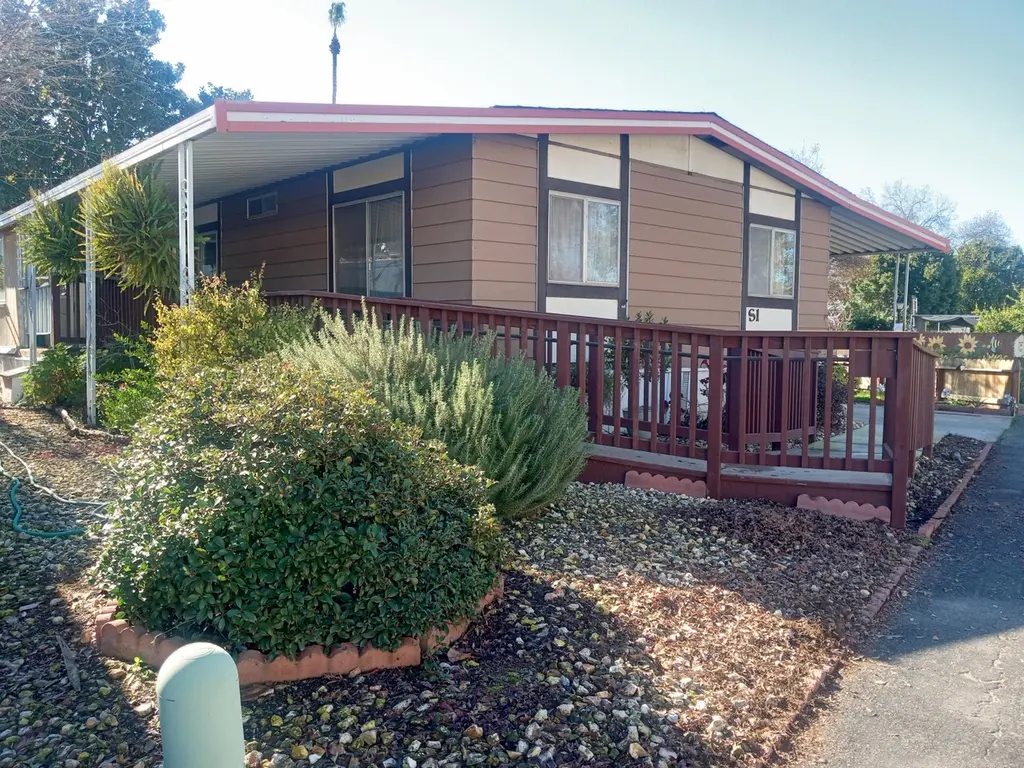
2400 W Midvalley Ave Unit S1 · Visalia, CA
Flood risk 4/10 · Minor
- FEMA flood zone
- X (shaded)
- Chance of flooding over 30 yrs
- 0.21%
- Est. flood insurance / yr
- $507 – $1,088
Fire risk 6/10 · Moderate
- Est. fire insurance / yr
- $659 – $1,223
Heat risk 8/10 · Major
- Hot days now (above 105°F)
- 7 days/yr
- Hot days in 30 yrs
- 17 days/yr
Wind risk 1/10 · Minimal
- Chance of severe wind over 30 yrs
- —
Air-quality risk 10/10 · Severe
- Unhealthy air days now
- 40 days/yr
- Unhealthy air days in 30 yrs
- 43 days/yr
Risk factors via First Street. Map © Google.
Why this score? — see what drove the B- grade
The composite is a weighted blend of 9 inputs, each scored 0–100. Each bar is that input's sub-score; the figure is the points it added to the 100-point composite (weight × sub-score).
- Cash flow +30.0/30.0
- 1% rule +10.0/10.0
- DSCR +10.0/10.0
- ARV discount +7.5/15.0
- Livability +3.6/5.0
- Rent growth +3.3/5.0
- Schools +3.0/10.0
- Condition / age +2.5/5.0
- Appreciation +0.0/10.0
$79,900
🖨 Deal sheet 📄 Offer letter ✓ Due diligence
Listing remarks
Spacious 2 bedroom and 2 bathroom mobile home located in Visalia's Westlake Village ( a 55+ community) . This home is fitted with a ramp and is on a corner lot adjucent one of the several ponds in the park. Inside is a spacious kitchen with an island and a pantry that adds extra storage to the many cabinets . The living area is in the center of the home with the Master bedroom to the rear and the guest room in the front. A large laundry room ( with sink) is just inside the carport entry and has a desk area as well. Solar has been added to ease the costs of our rising utilities. .. .. Please call to set up a private viewing.
Key facts
- Pantry
- Spacious kitchen
- Adjacent ponds
Tags
Property features AI
Exterior
- Parking: Carport
- Utilities: Public water; Public sewer; Natural gas available and connected; Electricity connected; Cable connected; Water connected; Sewer connected
- Home design: Manufactured in park (Double wide manufactured home)
- Construction: Metal skirting; Rolled/hot mop roof; Model: FUQUA; Manufactured home dimensions approximately 24' x 60'
- Exterior features: Front porch (screened); Fenced yard; Private pool
Interior
- Bathrooms: 2 full bathrooms
- Heating & cooling: Central air conditioning; Forced air heating
- Interior features: Kitchen island
- Laundry & utility: Indoor laundry in a dedicated laundry room
Neighborhood map
What this means for you Summary
Snapshot
- This is a 2-bed/2.0-bath land listed at $80k.
Deal economics
- At list price, monthly cash flow is $1k ($12k/yr) — positive.
- The deal already cash-flows at list — no discount required.
- Meets the 1% rule at list price ($2k rent vs $80k).
- Recommended offer: $73k (9.0% below list) — sets the bar for market timing.
- Cap rate 21.4% vs local median 3.3% in Visalia — top-decile yield for the area; either an underpriced asset or a hidden risk that comps aren't pricing in. Stress-test before assuming the spread holds.
Location & tenants
- Location reads 72/100 on livability (#196 in CA) — a middle-class / working-renter tenant base. Strengths: commute A+, housing A+, employment B; Watch: amenities D, crime D-, cost of living F.
- Tulare Joint Union High (suburban): math 18% / reading 52% proficiency, ranked #280 of 517 in CA (top 54%) — families likely to look elsewhere, expect single-tenant / working-renter base with shorter leases.
- Market conditions: Rents rising (+3.3%/yr); 233 active listings in the ZIP; 13 comparable units currently listed for rent nearby; rentals lingering (median 44d on market — plan ~5-8 weeks vacancy on turnover, expect pricing pressure); 62% of comp listings sitting > 30 days — soft ceiling on asking rent; solid renter incomes; 1,447 units permitted in Tulare County in 2024 (307 in 5+ unit buildings).
Forward outlook
- Local home prices are declining (-3.0%/yr); year-one equity from $552 of loan paydown is wiped out by about $2k of value loss. Plan a longer hold.
- Tulare County population projected at +10% by 2050 — modest demand growth; plan on rents tracking national, not racing it.
- At projected returns (-3.0% appreciation + 3.3% rent growth), your $22k cash investment doubles in ~3 years — after that, you're playing with house money.
Negotiation context
- It's been on market 93 days — a 9% lower offer ($73k) is reasonable based on typical stale-listing flexibility.
- 3 sale attempts since 2y ago with the ask held roughly flat each time — persistent listings suggest the price (not the market) is what's stuck; bring a comps-based counter.
- Current owner paid $35k; list at $80k implies a 128% gain — meaningful room to come down on a strong offer.
Risks & watch-outs
- Climate carrying-cost: major wildfire risk; extreme-heat days projected 7→17/yr by 2055 (HVAC capex compounding) — expect insurance premiums to compound above CPI over the hold.
Questions for the listing agent
- It's been on market 93 days. Have you received any prior offers? Is the seller open to a 9% concession, seller financing, or rate buy-down credit?
- Why hasn't it sold? Are there any deal-killer items the seller is aware of (foundation, flood, title, zoning, code violations)?
- Is there a deadline driving the sale (1031 exchange, divorce, estate, relocation)? That informs how much negotiation room exists.
- Crime grade is D in this area — have there been break-ins, vandalism, or insurance claims at this property in the last 3 years? What carrier currently insures it and at what premium?
- What's the average days-on-market for RENTAL listings here right now (not sales)? A rising rental-DOM trend means longer vacancies and softer asking-rent achievability than the comps imply.
- What's the recent tenant-quality profile in this submarket — average credit score on applications, eviction rate, late-payment / NSF rate, and stable-employment percentage? A property-management company in the area should have these aggregated.
- How much new for-sale + rental construction is in the pipeline within 1–3 miles? Heavy new supply typically softens prices + rents 12–24 months out; constrained supply supports both.
Investment metrics
- 1% rule
- 2.47% ✓
- Cap rate
- 21.39%
- Cash-on-cash
- 53.91%
- DSCR
- 3.40
- GRM
- 3.4
CMA / ARV
No comps found within radius.
Projected returns pro-forma
-3.0% appreciation · 3.32% rent growth · sell at horizon
- IRR
- 52.4%
- Equity multiple
- 3.31×
- Total profit
- $51,728
- Equity at exit
- $11,913
- IRR
- 57.8%
- Equity multiple
- 6.82×
- Total profit
- $130,216
- Equity at exit
- $6,908
Cash invested: $22,372 (down + closing). Projections, not guarantees.
Landlord ↔ Tenant lean methodology
- Overall (STATE)
- 18 Strongly Tenant-Friendly
- State California
- 18 Strongly Tenant-Friendly · D+13
- County
- — inherits STATE
- City
- — inherits STATE
ZIP-level market 93277
- Rents YoY
- 3.3%
- Active inventory
- 233
- Price-to-rent
- 3.4×
Monthly cashflow live
- Estimated rent
- $1,971 high interval (Pro) →
- Mortgage (P&I)
- −$419
- Tax est. 1.5%
- −$100 /mo · $1,198/yr
- Insurance
- −$33
- HOA
- −$0
- Vacancy / Maint / Mgmt
- −$414
- Net cashflow
- $1,005
Break-even live
UW: 25.0% down · 7.5% · 30yr · 1.5% tax · 5.0% vac · 8.0% maint · 8.0% mgmt
Financing live
Cash to close
- Down payment
- $19,975
- Closing costs
- $2,397
- Reserves months
- —
- Total cash needed
- —
Loan-product check · same deal, 3 products live
Conventional
25% down · 7.5% · 30yr
- Down + closing
- —
- Monthly P&I
- —
- Monthly cashflow
- —
- DSCR
- —
- Eligible?
- —
Personal DTI + credit; lowest rate.
DSCR
20% down · 8.5% · 30yr
- Down + closing
- —
- Monthly P&I
- —
- Monthly cashflow
- —
- DSCR
- —
- Eligible?
- —
No personal income docs; deal must DSCR.
Hard money
10% down · 12.0% · 12mo
- Down + closing
- —
- Monthly P&I
- —
- Monthly cashflow
- —
- DSCR
- —
- Eligible?
- —
Short-term bridge; refi at stabilization.
Rent comps 13 comps
| Address | Beds | Baths | Sqft | Rent | $/sqft | DOM | Units | Dist |
|---|---|---|---|---|---|---|---|---|
| 3940 S Shady Ct Unit 123 Visalia, CA | 2.0 | 1.0 | 910 | $1,695 | $1.86 | 43d | 1 | 0.38mi |
| 3940 S Shady Ct Apt 107 Visalia, CA | 2.0 | 2.0 | 950 | $1,695 | $1.78 | 43d | 1 | 0.38mi |
| 3919 S Sallee Ct Visalia, CA | 3.0 | 2.0 | 1642 | $2,400 | $1.46 | 21d | 1 | 0.38mi |
| 3940 S Shady Ct Apt 223 Visalia, CA | 2.0 | 2.0 | 910 | $1,950 | $2.14 | 43d | 1 | 0.39mi |
| 2546 W Victor Ct Unit 102 Visalia, CA | 3.0 | 2.0 | 1200 | $1,995 | $1.66 | 43d | 1 | 0.81mi |
| 3837 W Rialto Ave Visalia, CA | 3.0 | 2.0 | 1475 | $2,100 | $1.42 | 43d | 1 | 0.85mi |
| 3909 W Nellis Ave Visalia, CA | 3.0 | 2.0 | 1475 | $2,100 | $1.42 | 21d | 1 | 0.88mi |
| 3922 W Nellis Ave Visalia, CA | 3.0 | 2.0 | 1475 | $2,500 | $1.69 | 43d | 1 | 0.88mi |
| 2704 W Whitendale Ave Visalia, CA | 3.0 | 2.0 | 1583 | $1,895 | $1.20 | 21d | 1 | 1.10mi |
| 1917 W Whitendale Ave Unit 1917 Visalia, CA | 2.0 | 2.0 | 1048 | $1,295 | $1.24 | 43d | 1 | 1.11mi |
| 1107 W Victor Ave Visalia, CA | 3.0 | 2.0 | 1710 | $2,500 | $1.46 | 13d | 1 | 1.18mi |
| 3618 W Country Ave Visalia, CA | 3.0 | 2.0 | 1618 | $2,095 | $1.29 | 43d | 1 | 1.32mi |
| 324 W Kimball Ave Visalia, CA | 3.0 | 2.0 | 1297 | $2,500 | $1.93 | 13d | 1 | 1.46mi |
Listing history 27 events
-
2026-06-18days on market $79,900 Active 93 DOM
-
2026-06-17days on market $79,900 Active 92 DOM
-
2026-06-16days on market $79,900 Active 91 DOM
-
2026-06-15days on market $79,900 Active 90 DOM
-
2026-06-14days on market $79,900 Active 88 DOM
-
2026-06-13days on market $79,900 Active 87 DOM
-
2026-06-10days on market $79,900 Active 85 DOM
-
2026-06-09days on market $79,900 Active 84 DOM
-
2026-06-08days on market $79,900 Active 83 DOM
-
2026-06-07days on market $79,900 Active 82 DOM
-
2026-06-03days on market $79,900 Active 78 DOM
-
2026-06-02days on market $79,900 Active 77 DOM
-
2026-06-01days on market $79,900 Active 76 DOM
-
2026-05-31days on market $79,900 Active 75 DOM
-
2026-05-30days on market $79,900 Active 74 DOM
-
2026-03-18$79,900 Active
-
2025-04-21price $79,000
-
2025-04-11price $89,000
-
2024-08-05price $89,350
-
2024-08-05price $89,350
-
2024-08-05price $89,350
-
2024-05-13price $92,500
-
2024-05-13price $92,500
-
2024-05-13price $92,500
-
2024-03-05$95,000 Active
-
2024-03-05$95,000 Active
-
2019-09-18soldstatus $35,000
ⓘ Source: listings_history table (triggers on properties + properties_extension) + one-shot
backfill from property_details.listing_events for pre-trigger history.
Climate risk First Street
- Flood 4/10 Moderate FEMA zone X (shaded) · 21% chance over 30 yrs
- Wildfire 6/10 Major
- Heat 8/10 Severe 7 d/yr ≥105°F today · 17 d/yr by 30 yrs out
- Wind 1/10 Low
- Air quality 10/10 Extreme 40 unhealthy d/yr today · 43 by 30 yrs out
Nearby sold comps map
Loading sold comps map…
Walkable amenities ~0.75 mi
Loading nearby amenities…
Taxation est. · year 1
- Rental income
- $23,653
- − Mortgage interest
- −$4,476
- − Property taxes
- −$1,198
- − Insurance
- −$400
- − Repairs & maintenance
- −$1,892
- − Management
- −$1,892
- − Depreciation
- −$2,324
- Taxable income
- $11,471
- Est. tax owed @ 24.0%
- −$2,753
- After-tax cash flow
- $9,307/yr
For passive investors: Depreciation is non-cash, so a rental often shows a tax loss while cash-flowing — sheltering income. Rental losses are passive: they offset passive income freely, and up to $25,000/yr can offset ordinary (W-2) income if you actively participate and your MAGI is under $100k (phasing out to $0 by $150k); unused losses carry forward. On sale, claimed depreciation is recaptured at up to 25%, and gains may owe capital-gains tax (a 1031 exchange can defer both). Figures are a year-1 estimate at your 24.0% rate — not tax advice; consult a CPA.
Schools (NCES district)
- District
- Tulare Joint Union High
- NCES district ID
- 0639930
- Math proficiency
- 18% ▼ -6.00%
- Reading proficiency
- 52% ▼ -1.00%
- Median HH income
- $46,858
- Composite
- 29.91/100
- National rank
- #6384
- State rank
- #280 of 517 in CA
Livability — Visalia
- Score
- 72/100
- State rank
- #196
- US rank
- #6351
Category grades
Schools grade is shown separately in the Schools card above.
Census & demographics
- Census place
- Visalia, CA
- County
- Tulare County · 323,826 people
- City population
- 163,333
- Metro
- Visalia, CA
- Population (ZIP)
- 53,985
- Household income
- $80,548
- Rent vs Own
- Severe rent burden
- 1896.0
Population outlook (Tulare County) Hauer SSP2
- Today (2025)
- 484,681 people
- By 2030
- 496,241 · +2.4%
- By 2040
- 518,507 · +7.0%
- By 2050
- 534,920 · +10.4%
- By 2075
- 548,417 · +13.2%
- By 2100
- 513,085 · +5.9%
Race, ethnicity, and origin ACS 2023
- Neighborhood character
- Diverse neighborhood (Simpson 0.60)
- Race & ethnicity
- Hispanic / Latino 48% White 40% Two or more races 21% Asian 4% Black 2% Native American 2%
- Hispanic origin (detail)
- Mexican 44%
- Common ancestry
- Russian 3% Iranian 2% Italian 2%
- Foreign-born
- 12% · Canada, China
- Languages at home
- 73% English-only · Spanish 22% Chinese 2% Other Asian/Pacific 1%
Political lean MEDSL · Tulare
- 2024 margin
- Strong R (+20.7) · D 38.5% · R 59.2% · Other 2.3%
- 2008→2024 swing
- -5.4pp toward R · 2008: -15.3pp · 2024: -20.7pp
- All cycles
- 2024: R+20.7 2020: R+7.8 2016: R+12.1 2012: R+17.8 2008: R+15.3
Not yet ingested
- Civics
- —
Market trends
- HPI YoY
- ▼ -371.43%
- Current HPI
- 310.349
- Rent YoY
- ▲ 3.32%
- Metro
- Visalia, CA
- State GDP YoY
- ▲ 3.21%
- F500 in state
- 116
Industry mix (Fortune 500 HQ in CA)
| Industry | F500 HQs | Revenue |
|---|---|---|
| Technology | 27 | $1,492B |
|
||
| Financial Services | 3 | $174B |
|
||
| Retail | 3 | $44B |
|
||
| Insurance | 3 | $26B |
|
||
| Media / Entertainment | 2 | $115B |
|
||
| Pharmaceuticals / Biotech | 2 | $62B |
|
||
Price history
+128.3% since first listed12 events — show timeline
- 2026-03-18 Listed $79,900 TCMLS
- 2025-04-21 Price Changed $79,000 TCMLS
- 2025-04-11 Price Changed $89,000 TCMLS
- 2024-08-05 Price Changed $89,350 TCMLS
- 2024-08-05 Price Changed $89,350 KCBOR
- 2024-08-05 Price Changed $89,350 FRESNOMLS
- 2024-05-13 Price Changed $92,500 TCMLS
- 2024-05-13 Price Changed $92,500 KCBOR
- 2024-05-13 Price Changed $92,500 FRESNOMLS
- 2024-03-05 Listed $95,000 KCBOR
- 2024-03-05 Listed $95,000 TCMLS
- 2019-09-18 Sold (MLS) $35,000 TCMLS
Property tax history
-3.1%/yrLatest (2021): $66 · -2.9% YoY. Source: county tax records.
Cash-flow waterfall
monthlySold comps — $/sqft
last 12 mo · ≤1 miLoading sold comps…