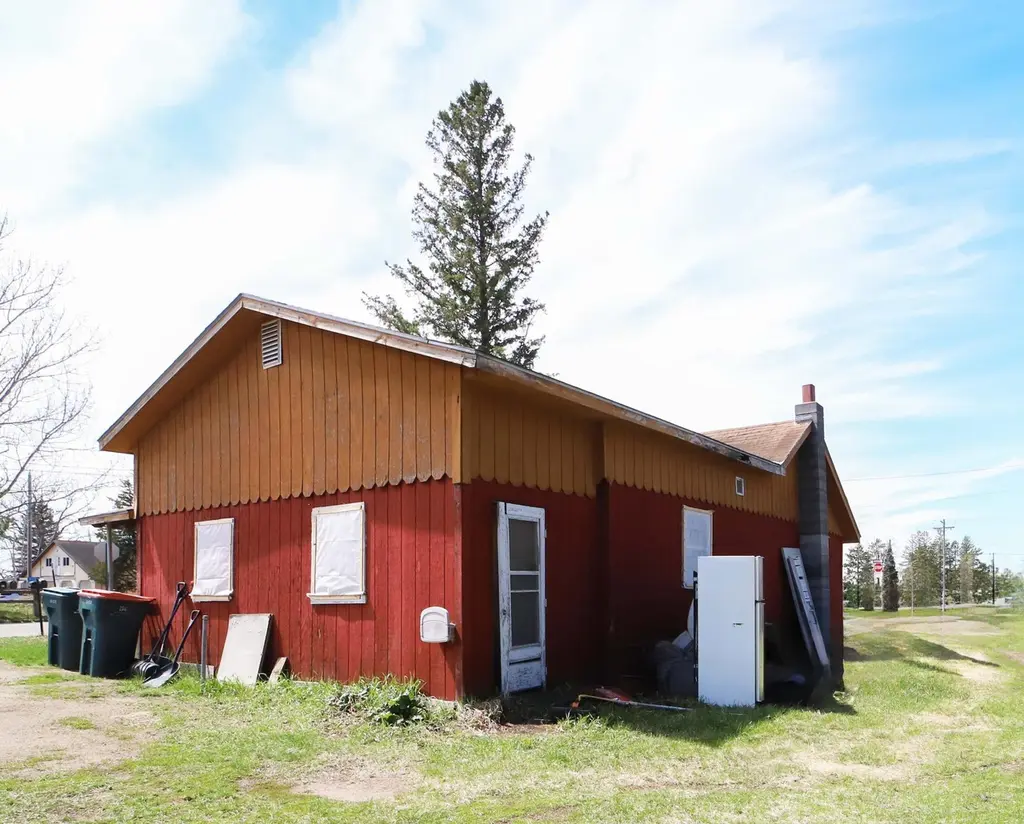
65 Eldredge St E · Motley, MN
Flood risk 1/10 · Minimal
- FEMA flood zone
- X
- Chance of flooding over 30 yrs
- 0.0%
- Est. flood insurance / yr
- $507 – $1,088
Fire risk 6/10 · Moderate
- Est. fire insurance / yr
- $888 – $1,650
Heat risk 2/10 · Minimal
- Hot days now (above 97°F)
- 7 days/yr
- Hot days in 30 yrs
- 13 days/yr
Wind risk 2/10 · Minimal
- Chance of severe wind over 30 yrs
- —
Air-quality risk 2/10 · Minimal
- Unhealthy air days now
- 1 days/yr
- Unhealthy air days in 30 yrs
- 1 days/yr
Risk factors via First Street. Map © Google.
Why this score? — see what drove the B- grade
The composite is a weighted blend of 9 inputs, each scored 0–100. Each bar is that input's sub-score; the figure is the points it added to the 100-point composite (weight × sub-score).
- Cash flow +30.0/30.0
- 1% rule +10.0/10.0
- DSCR +10.0/10.0
- ARV discount +7.5/15.0
- Livability +3.4/5.0
- Schools +3.2/10.0
- Rent growth +2.5/5.0
- Condition / age +2.5/5.0
- Appreciation +0.6/10.0
$34,900
🖨 Deal sheet 📄 Offer letter ✓ Due diligence
Listing remarks
This two bedroom, one bath home in Motley is perfect for a starter home or your next rental! The property features a porch, gravel driveway for parking, and close to all the amenities Motley has to offer! Don't miss out on this great opportunity, Schedule Your Showing Today!
Key facts
- 6,795 sq ft lot
- Built 1940
- Listed 25 days
Property features AI
Finance
- Other: Porch listed as an amenity
Exterior
- Parking: Gravel parking
- Utilities: City water (connected); City sewer (connected); Electric fuel
- Home design: Residential property; One-story; Main entry on main level
- Construction: Block and frame construction; Asphalt roof; Block foundation; Built on a foundation approximately 20x36
- Exterior features: Side porch; Wood exterior; Light tree coverage on the lot; City street frontage; Public maintained road
Interior
- Kitchen: Range; Refrigerator
- Bedrooms: 2 bedrooms on the main level; Bedroom sizes approximately 9x8 and 8x11
- Bathrooms: One full bathroom on the main level (approx. 8x6)
- Heating & cooling: Baseboard heating; No cooling
- Interior features: Main floor full bathroom; Kitchen/Dining room layout; Foyer
- Laundry & utility: No laundry room (none listed)
Neighborhood map
What this means for you Summary
Snapshot
- This is a 2-bed/1.5-bath single-family listed at $35k.
Deal economics
- At list price, monthly cash flow is $375 ($5k/yr) — positive.
- The deal already cash-flows at list — no discount required.
- Meets the 1% rule at list price ($801 rent vs $35k).
- Recommended offer: $34k (1.5% below list) — sets the bar for market timing.
Location & tenants
- Location reads 68/100 on livability (#393 in MN) — a middle-class / working-renter tenant base. Strengths: cost of living A+, health & safety A+, crime A; Watch: schools D, amenities F, commute F.
- Staples-Motley School District (rural): math 37% / reading 39% proficiency, ranked #238 of 301 in MN (top 79%) — families likely to look elsewhere, expect single-tenant / working-renter base with shorter leases.
- Market conditions: 47 active listings in the ZIP; 179 units permitted in Morrison County in 2024 (45 in 5+ unit buildings).
Forward outlook
- Local home prices are declining (-3.0%/yr); year-one equity from $241 of loan paydown is wiped out by about $1k of value loss. Plan a longer hold.
- Morrison County population projected at -20% by 2050 — secular population decline; favor cash flow + early exit over multi-decade hold.
- At projected returns (-3.0% appreciation + 3.0% rent growth), your $10k cash investment doubles in ~3 years — after that, you're playing with house money.
Negotiation context
- It's been on market 25 days — a 2% lower offer ($34k) is reasonable based on typical stale-listing flexibility.
Risks & watch-outs
- Watch-outs: built in 1940 — expect roof / HVAC / electrical / plumbing capex.
- Climate carrying-cost: major wildfire risk — expect insurance premiums to compound above CPI over the hold.
Questions for the listing agent
- Built in 1940 — when were the roof, HVAC, electrical panel, plumbing, and water heater last replaced?
- Is there a deadline driving the sale (1031 exchange, divorce, estate, relocation)? That informs how much negotiation room exists.
- Schools are D-rated, which usually means shorter tenancies and higher turnover. Who's the typical renter profile here, and what's been the actual vacancy rate?
- What's the average days-on-market for RENTAL listings here right now (not sales)? A rising rental-DOM trend means longer vacancies and softer asking-rent achievability than the comps imply.
- What's the recent tenant-quality profile in this submarket — average credit score on applications, eviction rate, late-payment / NSF rate, and stable-employment percentage? A property-management company in the area should have these aggregated.
- How much new for-sale + rental construction is in the pipeline within 1–3 miles? Heavy new supply typically softens prices + rents 12–24 months out; constrained supply supports both.
Investment metrics
- 1% rule
- 2.30% ✓
- Cap rate
- 19.19%
- Cash-on-cash
- 46.06%
- DSCR
- 3.05
- GRM
- 3.6
CMA / ARV
No comps found within radius.
Projected returns pro-forma
-3.0% appreciation · 3.0% rent growth · sell at horizon
- IRR
- 43.3%
- Equity multiple
- 2.87×
- Total profit
- $18,256
- Equity at exit
- $5,204
- IRR
- 49.4%
- Equity multiple
- 5.78×
- Total profit
- $46,749
- Equity at exit
- $3,018
Cash invested: $9,772 (down + closing). Projections, not guarantees.
Landlord ↔ Tenant lean methodology
- Overall (STATE)
- 46 Balanced
- State Minnesota
- 46 Balanced · D+2
- County
- — inherits STATE
- City
- — inherits STATE
ZIP-level market 56466
- Home prices YoY
- -3.8%
- Active inventory
- 47
- Price-to-rent
- 3.6×
Monthly cashflow live
- Estimated rent
- $801 medium interval (Pro) →
- Mortgage (P&I)
- −$183
- Tax from tax record
- −$60 /mo · $722/yr
- Insurance
- −$15
- HOA
- −$0
- Vacancy / Maint / Mgmt
- −$168
- Net cashflow
- $375
Break-even live
UW: 25.0% down · 7.5% · 30yr · 1.5% tax · 5.0% vac · 8.0% maint · 8.0% mgmt
Financing live
Cash to close
- Down payment
- $8,725
- Closing costs
- $1,047
- Reserves months
- —
- Total cash needed
- —
Loan-product check · same deal, 3 products live
Conventional
25% down · 7.5% · 30yr
- Down + closing
- —
- Monthly P&I
- —
- Monthly cashflow
- —
- DSCR
- —
- Eligible?
- —
Personal DTI + credit; lowest rate.
DSCR
20% down · 8.5% · 30yr
- Down + closing
- —
- Monthly P&I
- —
- Monthly cashflow
- —
- DSCR
- —
- Eligible?
- —
No personal income docs; deal must DSCR.
Hard money
10% down · 12.0% · 12mo
- Down + closing
- —
- Monthly P&I
- —
- Monthly cashflow
- —
- DSCR
- —
- Eligible?
- —
Short-term bridge; refi at stabilization.
Listing history 13 events
-
2026-06-09status $34,900 Pending 25 DOM
-
2026-06-08days on market $34,900 Active 25 DOM
-
2026-06-07days on market $34,900 Active 24 DOM
-
2026-06-07days on market $34,900 Active 23 DOM
-
2026-06-04days on market $34,900 Active 20 DOM
-
2026-06-02days on market $34,900 Active 19 DOM
-
2026-06-01price $34,900 Active 18 DOM
-
2026-06-01days on market $49,900 Active 18 DOM
-
2026-05-31days on market $49,900 Active 17 DOM
-
2026-05-31days on market $49,900 Active 16 DOM
-
2026-05-14status Active 275-char remark
-
2026-05-01status Pending 275-char remark
-
2026-04-29historical $49,900 275-char remark
ⓘ Source: listings_history table (triggers on properties + properties_extension) + one-shot
backfill from property_details.listing_events for pre-trigger history.
Tax reassessment forecast MN · Partial reset (capped growth)
- Current annual tax
- $722 · $60/mo
- Projected year-2 tax
- $722 · $60/mo
- Expected delta
- $0/yr ($0/mo · 0.0%)
ⓘ Screening estimate from a state-policy table — verify with the county assessor before closing.
Climate risk First Street
- Flood 1/10 Low FEMA zone X · 0% chance over 30 yrs
- Wildfire 6/10 Major
- Heat 2/10 Low 7 d/yr ≥97°F today · 13 d/yr by 30 yrs out
- Wind 2/10 Low
- Air quality 2/10 Low 1 unhealthy d/yr today · 1 by 30 yrs out
Nearby sold comps map
Loading sold comps map…
Walkable amenities ~0.75 mi
Loading nearby amenities…
Taxation est. · year 1
- Rental income
- $9,612
- − Mortgage interest
- −$1,955
- − Property taxes
- −$722
- − Insurance
- −$174
- − Repairs & maintenance
- −$769
- − Management
- −$769
- − Depreciation
- −$1,015
- Taxable income
- $4,208
- Est. tax owed @ 24.0%
- −$1,010
- After-tax cash flow
- $3,491/yr
For passive investors: Depreciation is non-cash, so a rental often shows a tax loss while cash-flowing — sheltering income. Rental losses are passive: they offset passive income freely, and up to $25,000/yr can offset ordinary (W-2) income if you actively participate and your MAGI is under $100k (phasing out to $0 by $150k); unused losses carry forward. On sale, claimed depreciation is recaptured at up to 25%, and gains may owe capital-gains tax (a 1031 exchange can defer both). Figures are a year-1 estimate at your 24.0% rate — not tax advice; consult a CPA.
Schools (NCES district)
- District
- Staples-Motley School District
- NCES district ID
- 2733900
- Math proficiency
- 37% ▼ -6.00%
- Reading proficiency
- 39% ▼ -10.00%
- Median HH income
- $41,979
- Composite
- 32.07/100
- National rank
- #5816
- State rank
- #238 of 301 in MN
Livability — Motley
- Score
- 68/100
- State rank
- #393
- US rank
- #9317
Category grades
Schools grade is shown separately in the Schools card above.
Census & demographics
- Census place
- Motley, MN
- Population (ZIP)
- 3,126
Population outlook (Morrison County) Hauer SSP2
- Today (2025)
- 31,479 people
- By 2030
- 30,414 · -3.4%
- By 2040
- 27,935 · -11.3%
- By 2050
- 25,229 · -19.9%
- By 2075
- 20,093 · -36.2%
- By 2100
- 16,173 · -48.6%
Race, ethnicity, and origin ACS 2023
- Neighborhood character
- Predominantly White (89%)
- Race & ethnicity
- White 89% Two or more races 9% Hispanic / Latino 2%
- Common ancestry
- Portuguese 14% Romanian 4% Scottish 3%
- Foreign-born
- 1% · Canada
- Languages at home
- 97% English-only · German/W. Germanic 1% Spanish 1%
Political lean MEDSL · Morrison
- 2024 margin
- Solid R (+56.0) · D 21.2% · R 77.3% · Other 1.5%
- 2008→2024 swing
- -37.0pp toward R · 2008: -19.0pp · 2024: -56.0pp
- All cycles
- 2024: R+56.0 2020: R+53.5 2016: R+53.0 2012: R+24.0 2008: R+19.0
Not yet ingested
- Civics
- —
Market trends
- HPI YoY
- ▼ -8.77%
- Current HPI
- 223.5756
- Rent YoY
- —
- Metro
- —
- State GDP YoY
- ▲ 2.41%
- F500 in state
- 34
Industry mix (Fortune 500 HQ in MN)
| Industry | F500 HQs | Revenue |
|---|---|---|
| Healthcare | 2 | $407B |
|
||
| Retail | 2 | $150B |
|
||
| Consumer Goods | 2 | $32B |
|
||
| Industrial Machinery | 2 | $6B |
|
||
| Agriculture | 1 | $40B |
|
||
| Healthcare / Medical Devices | 1 | $32B |
|
||
Price history
-30.1% since first listed5 events — show timeline
- 2026-06-08 Pending — NORTHSTARMLS as Distributed by MLS Grid
- 2026-06-01 Price Changed $34,900 NORTHSTARMLS as Distributed by MLS Grid
- 2026-05-14 Relisted — NORTHSTARMLS as Distributed by MLS Grid
- 2026-05-01 Pending — NORTHSTARMLS as Distributed by MLS Grid
- 2026-04-29 Coming Soon $49,900 NORTHSTARMLS as Distributed by MLS Grid
Property tax history
+4.7%/yrLatest (2025): $722 · -5.2% YoY. Source: county tax records.
Cash-flow waterfall
monthlySold comps — $/sqft
last 12 mo · ≤1 miLoading sold comps…