 Duplex
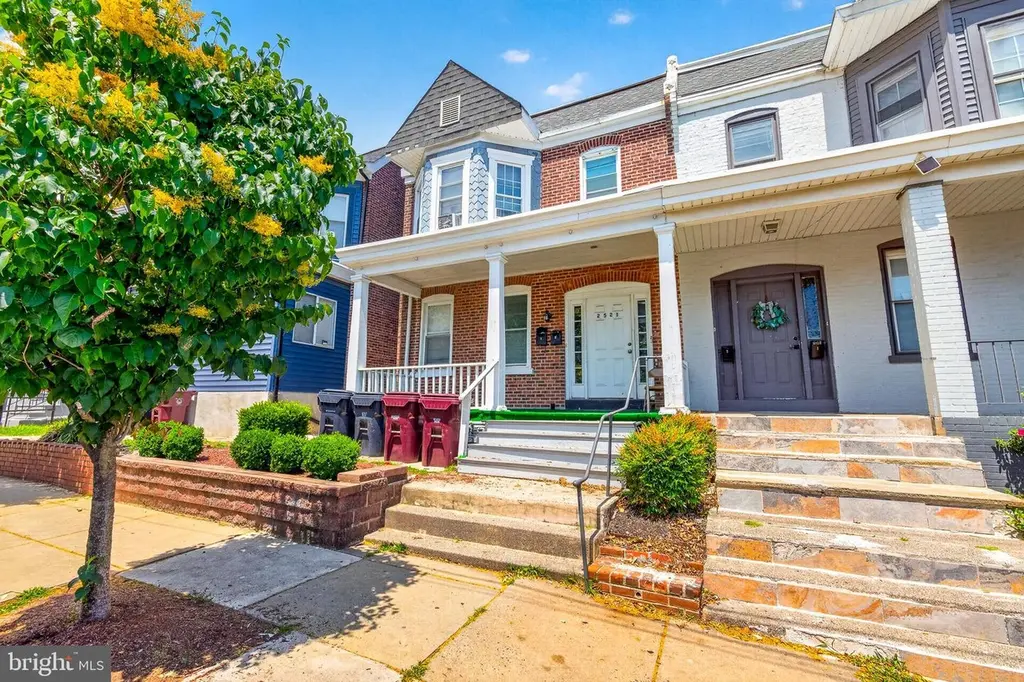
2521 N Tatnall St · Wilmington, DE
Flood risk 1/10 · Minimal
- FEMA flood zone
- X (unshaded)
- Chance of flooding over 30 yrs
- 0.0%
- Est. flood insurance / yr
- $473 – $860
Fire risk 1/10 · Minimal
- Est. fire insurance / yr
- $476 – $884
Heat risk 7/10 · Major
- Hot days now (above 103°F)
- 7 days/yr
- Hot days in 30 yrs
- 16 days/yr
Wind risk 6/10 · Moderate
- Chance of severe wind over 30 yrs
- 27.0%
Air-quality risk 3/10 · Minor
- Unhealthy air days now
- 2 days/yr
- Unhealthy air days in 30 yrs
- 3 days/yr
Risk factors via First Street. Map © Google.
Why this score? — see what drove the B- grade
The composite is a weighted blend of 9 inputs, each scored 0–100. Each bar is that input's sub-score; the figure is the points it added to the 100-point composite (weight × sub-score).
- Cash flow +30.0/30.0
- DSCR +10.0/10.0
- 1% rule +8.0/10.0
- ARV discount +7.0/15.0
- Rent growth +3.9/5.0
- Livability +3.2/5.0
- Schools +3.1/10.0
- Condition / age +2.5/5.0
- Appreciation +0.0/10.0
$250,000
🖨 Deal sheet (PDF) 📄 Offer letter ✓ Due diligence
Multi-family units
County records classify this as Multi-Family (2-4 Unit). Listing-text estimate: 2 units. confirmed
Listing remarks MLS
INVESTOR ALERT - Multi-unit building City Approved variance for 2 units. Each unit has separate heat and water. Seller has never lived in the property and has no knowledge of expenses. Rents $700 upstairs unit 2 bedrooms and $600 Down stairs unit 1 bedroom and 1st floor has access to semi-finished basement. Both tenants are month to month
Key facts
- Near restaurants
- Near parks
- 1,742 sq ft lot
Tags
Property features AI
Finance
- Other: Above-grade finished area reported as 1,525 (source: Assessor); Year built source: Assessor
- Financial info: Two total units (multi-family); Unit identifiers: Unit 1, Unit 2
Exterior
- Parking: On-street parking
- Utilities: Public water; Public sewer; Natural gas heating fuel; Electric cooling fuel
- Home design: Semi-detached structure; Fee simple ownership
- Construction: Brick construction; Foundation: Other; Above-grade and below-grade structures
- Exterior features: Lot dimensions approximately 23.00 x 71.00; No tidal water
Interior
- Kitchen: Refrigerator; Stove
- Bedrooms: One 1-bedroom unit; One 2-bedroom unit
- Heating & cooling: Baseboard hot water heating; Electric hot water; Cooling: Other (electric-powered)
- Interior features: Full basement; 32"+ wide doors (accessibility features)
Neighborhood map
What this means for you Summary
Snapshot
- This is a 2 × 2-bed/1.0-bath units multifamily listed at $250k.
Deal economics
- At list price, monthly cash flow is $1k ($13k/yr) — positive. Per door: $531/mo.
- The deal already cash-flows at list — no discount required.
- Meets the 1% rule at list price ($3k rent vs $250k).
- Cap rate 11.4% vs local median 5.6% in Wilmington — top-decile yield for the area; either an underpriced asset or a hidden risk that comps aren't pricing in. Stress-test before assuming the spread holds.
Location & tenants
- Location reads 64/100 on livability (#52 in DE) — a middle-class / working-renter tenant base. Strengths: cost of living A+, housing A; Watch: employment D+, schools D, commute D.
- Red Clay Consolidated School District (suburban): math 27% / reading 42% proficiency, ranked #12 of 26 in DE (top 46%) — families likely to look elsewhere, expect single-tenant / working-renter base with shorter leases.
- Market conditions: Rents rising fast (+5.7%/yr); 119 active listings in the ZIP; 1,367 units permitted in New Castle County in 2024 (201 in 5+ unit buildings).
- At $3,243/mo this rent would consume 72% of the median local household income ($54k/yr) (locally 1816% of renters already pay >50% of income on rent) — very limited rent-growth headroom before tenants either downsize or default.
Forward outlook
- Local home prices are declining (-3.0%/yr); year-one equity from $2k of loan paydown is wiped out by about $8k of value loss. Plan a longer hold.
- New Castle County population projected at +9% by 2050 — modest demand growth; plan on rents tracking national, not racing it.
- At projected returns (-3.0% appreciation + 5.7% rent growth), your $70k cash investment doubles in ~6 years — after that, you're playing with house money.
Negotiation context
- Only 1 days on market — expect competitive offers; lowballing is unlikely to land.
- 9 sale attempts since 31y ago with the ask held roughly flat each time — persistent listings suggest the price (not the market) is what's stuck; bring a comps-based counter.
- Current owner paid $66k; list at $250k implies a 276% gain — meaningful room to come down on a strong offer.
Risks & watch-outs
- Watch-outs: built in 1920 — expect roof / HVAC / electrical / plumbing capex.
- Climate carrying-cost: major wind risk, 27% chance of damaging wind over 30y; extreme-heat days projected 7→16/yr by 2055 (HVAC capex compounding) — expect insurance premiums to compound above CPI over the hold.
Questions for the listing agent
- Can we see the unit-by-unit rent roll, current vacancy, and any below-market leases? What's the average tenancy length?
- What capital expenditures (roof, boiler, parking lot, exteriors) have been made in the last 5 years, and what's planned in the next 2?
- Built in 1920 — when were the roof, HVAC, electrical panel, plumbing, and water heater last replaced?
- Is there a deadline driving the sale (1031 exchange, divorce, estate, relocation)? That informs how much negotiation room exists.
- Schools are D-rated, which usually means shorter tenancies and higher turnover. Who's the typical renter profile here, and what's been the actual vacancy rate?
- Crime grade is F in this area — have there been break-ins, vandalism, or insurance claims at this property in the last 3 years? What carrier currently insures it and at what premium?
- What's the average days-on-market for RENTAL listings here right now (not sales)? A rising rental-DOM trend means longer vacancies and softer asking-rent achievability than the comps imply.
- What's the recent tenant-quality profile in this submarket — average credit score on applications, eviction rate, late-payment / NSF rate, and stable-employment percentage? A property-management company in the area should have these aggregated.
- How much new apartment / multifamily construction is in the pipeline within 1–3 miles? Heavy new supply (>2% of stock underway) typically softens rents 12–24 months out; light construction supports rent growth.
Investment metrics
- 1% rule
- 1.30% ✓
- Cap rate
- 11.39%
- Cash-on-cash
- 18.22%
- DSCR
- 1.81
- GRM
- 6.4
CMA / ARV
- ARV (on-the-fly)
- $247,050
- Comps found
- 1
Show comp detail 1 sale within ~0.75 mi
| Address | Dist | Beds/Ba | Sqft | Sold | Price | $/sf | Match |
|---|---|---|---|---|---|---|---|
| 2220 N Market St | 0.20mi | 6/3.0 (-1) | 1,725 (+13%) | 13mo | $280,000 | $162 | 49 |
Match score weights: distance 35% · size 25% · config 20% · recency 20%. Top-matched comps best support the ARV.
Projected returns pro-forma
-3.0% appreciation · 5.72% rent growth · sell at horizon
- IRR
- 12.6%
- Equity multiple
- 1.52×
- Total profit
- $36,204
- Equity at exit
- $37,276
- IRR
- 23.4%
- Equity multiple
- 3.26×
- Total profit
- $157,872
- Equity at exit
- $21,615
Cash invested: $70,000 (down + closing). Projections, not guarantees.
Landlord ↔ Tenant lean methodology
- Overall (STATE)
- 70 Landlord-Friendly
- State Delaware
- 70 Landlord-Friendly · D+7
- County
- — inherits STATE
- City
- — inherits STATE
ZIP-level market 19802
- Rents YoY
- 5.7%
- Active inventory
- 119
- Price-to-rent
- 12.8×
Monthly cashflow live
- Estimated rent
- $3,243 high interval (Pro) →
- Mortgage (P&I)
- −$1,311
- Tax from tax record
- −$84 /mo · $1,008/yr
- Insurance
- −$104
- HOA
- −$0
- Vacancy / Maint / Mgmt
- −$681
- Net cashflow
- $1,063
Break-even live
Sensitivity live
| Price | -10% $1,204 | -5% $1,134 | +0% $1,063 | +5% $992 | +10% $921 |
|---|---|---|---|---|---|
| Rent | -10% $807 | -5% $935 | +0% $1,063 | +5% $1,191 | +10% $1,319 |
| Rate | -1.0pp $1,189 | -0.5pp $1,126 | base $1,063 | +0.5pp $998 | +1.0pp $932 |
2-unit breakdown (identical units grouped — click to expand)
| Units | Beds | Baths | Est. rent |
|---|---|---|---|
| 2× units | 2 | 1 | $3,244 |
| #1 | 2 | 1 | $1,622 |
| #2 | 2 | 1 | $1,622 |
| Total (2 units) | $3,243 | ||
UW: 25.0% down · 7.5% · 30yr · 1.5% tax · 5.0% vac · 8.0% maint · 8.0% mgmt
Financing live
Cash to close
- Down payment
- $62,500
- Closing costs
- $7,500
- Reserves months
- —
- Total cash needed
- —
Loan-product check · same deal, 3 products live
Conventional
25% down · 7.5% · 30yr
- Down + closing
- —
- Monthly P&I
- —
- Monthly cashflow
- —
- DSCR
- —
- Eligible?
- —
Personal DTI + credit; lowest rate.
DSCR
20% down · 8.5% · 30yr
- Down + closing
- —
- Monthly P&I
- —
- Monthly cashflow
- —
- DSCR
- —
- Eligible?
- —
No personal income docs; deal must DSCR.
Hard money
10% down · 12.0% · 12mo
- Down + closing
- —
- Monthly P&I
- —
- Monthly cashflow
- —
- DSCR
- —
- Eligible?
- —
Short-term bridge; refi at stabilization.
Listing history 2 events
-
2026-06-18remarks 670-char remark
-
2026-06-18$250,000 Active 1 DOM
ⓘ Source: listings_history table (triggers on properties + properties_extension) + one-shot
backfill from property_details.listing_events for pre-trigger history.
Tax reassessment forecast DE · Partial reset (capped growth)
- Current annual tax
- $1,008 · $84/mo
- Projected year-2 tax
- $1,229 · $102/mo
- Expected delta
- +$221/yr (+$18/mo · 21.9%)
ⓘ Screening estimate from a state-policy table — verify with the county assessor before closing.
Climate risk First Street
- Flood 1/10 Low FEMA zone X (unshaded) · 0% chance over 30 yrs
- Wildfire 1/10 Low
- Heat 7/10 Severe 7 d/yr ≥103°F today · 16 d/yr by 30 yrs out
- Wind 6/10 Major 27% chance of damaging wind over 30 yrs
- Air quality 3/10 Moderate 2 unhealthy d/yr today · 3 by 30 yrs out
Nearby sold comps map
Loading sold comps map…
Walkable amenities ~0.75 mi
Loading nearby amenities…
Taxation est. · year 1
- Rental income
- $38,916
- − Mortgage interest
- −$14,004
- − Property taxes
- −$1,008
- − Insurance
- −$1,250
- − Repairs & maintenance
- −$3,113
- − Management
- −$3,113
- − Depreciation
- −$7,273
- Taxable income
- $9,155
- Est. tax owed @ 24.0%
- −$2,197
- After-tax cash flow
- $10,556/yr
For passive investors: Depreciation is non-cash, so a rental often shows a tax loss while cash-flowing — sheltering income. Rental losses are passive: they offset passive income freely, and up to $25,000/yr can offset ordinary (W-2) income if you actively participate and your MAGI is under $100k (phasing out to $0 by $150k); unused losses carry forward. On sale, claimed depreciation is recaptured at up to 25%, and gains may owe capital-gains tax (a 1031 exchange can defer both). Figures are a year-1 estimate at your 24.0% rate — not tax advice; consult a CPA.
Schools (NCES district)
- District
- Red Clay Consolidated School District
- NCES district ID
- 1001300
- Math proficiency
- 27% ▼ -11.00%
- Reading proficiency
- 42% ▼ -7.00%
- Median HH income
- $64,298
- Composite
- 31.25/100
- National rank
- #6027
- State rank
- #12 of 26 in DE
Livability — Wilmington
- Score
- 64/100
- State rank
- #52
- US rank
- #14251
Category grades
Schools grade is shown separately in the Schools card above.
Census & demographics
- Census place
- Wilmington, DE
- County
- New Castle County · 483,412 people
- City population
- 173,480
- Metro
- Philadelphia-Camden-Wilmington, PA-NJ-DE-MD
- Population (ZIP)
- 26,051
- Household income
- $53,812
- Rent vs Own
- Severe rent burden
- 1816.0
Population outlook (New Castle County) Hauer SSP2
- Today (2025)
- 594,686 people
- By 2030
- 609,164 · +2.4%
- By 2040
- 632,154 · +6.3%
- By 2050
- 649,068 · +9.1%
- By 2075
- 687,771 · +15.7%
- By 2100
- 694,961 · +16.9%
Race, ethnicity, and origin ACS 2023
- Neighborhood character
- Predominantly Black (68%)
- Race & ethnicity
- Black 68% White 20% Hispanic / Latino 7% Two or more races 5%
- Hispanic origin (detail)
- Puerto Rican 4%
- Common ancestry
- Slovak 1% Romanian 1% Italian 1%
- Foreign-born
- 11% · Canada, Jamaica, China
- Languages at home
- 92% English-only · Spanish 4% Arabic 0%
Political lean MEDSL · New Castle
- 2024 margin
- Solid D (+32.6) · D 65.5% · R 32.9% · Other 1.6%
- 2008→2024 swing
- -8.1pp toward R · 2008: 40.6pp · 2024: 32.6pp
- All cycles
- 2024: D+32.6 2020: D+37.1 2016: D+29.6 2012: D+34.1 2008: D+40.6
Not yet ingested
- Civics
- —
Market trends
- HPI YoY
- ▼ -296.47%
- Current HPI
- 225.6613
- Rent YoY
- ▲ 5.72%
- Metro
- Philadelphia-Camden-Wilmington, PA-NJ-DE-MD
- State GDP YoY
- —
- F500 in state
- 0
Price history
+347.2% since first listed26 events — show timeline
- 2026-06-18 Listed $250,000 BRIGHT MLS
- 2026-06-16 Coming Soon — BRIGHT MLS
- 2026-06-16 Listing Removed — BRIGHT MLS
- 2025-12-05 Rental Removed $1,395 RENTALBEAST
- 2025-12-02 Listed for Rent $1,395 RENTALBEAST
- 2025-11-17 Rental Removed $1,395 PROPERTYWARE
- 2025-11-13 Listed for Rent $1,395 PROPERTYWARE
- 2019-03-25 Sold (Public Records) $66,500 Public Records
- 2019-03-21 Sold (MLS) $66,500 BRIGHT MLS
- 2019-03-01 Contingent — BRIGHT MLS
- 2019-02-17 Listed $69,900 BRIGHT MLS
- 2016-12-23 Listing Removed — BRIGHT MLS
- 2016-10-03 Listed $61,900 BRIGHT MLS
- 2015-12-30 Sold (MLS) $40,000 BRIGHT MLS
- 2015-12-30 Sold (MLS) $40,000 TREND
- 2015-10-28 Pending — TREND
- 2015-10-21 Listing Removed — BRIGHT MLS
- 2015-10-10 Price Changed $47,500 TREND
- 2015-09-09 Price Changed $50,000 TREND
- 2015-08-13 Listed $54,950 TREND
- 2015-08-11 Listed $47,500 BRIGHT MLS
- 2001-08-29 Sold (Public Records) $45,652 Public Records
- 2001-08-27 Listing Removed — BRIGHT MLS
- 2000-05-09 Listed $59,900 BRIGHT MLS
- 1996-09-24 Listing Removed — BRIGHT MLS
- 1995-03-22 Listed $55,900 BRIGHT MLS
Property tax history
+3.7%/yrLatest (2024): $1,008 · +15.1% YoY. Source: county tax records.
Cash-flow waterfall
monthlySold comps — $/sqft
last 12 mo · ≤1 miLoading sold comps…