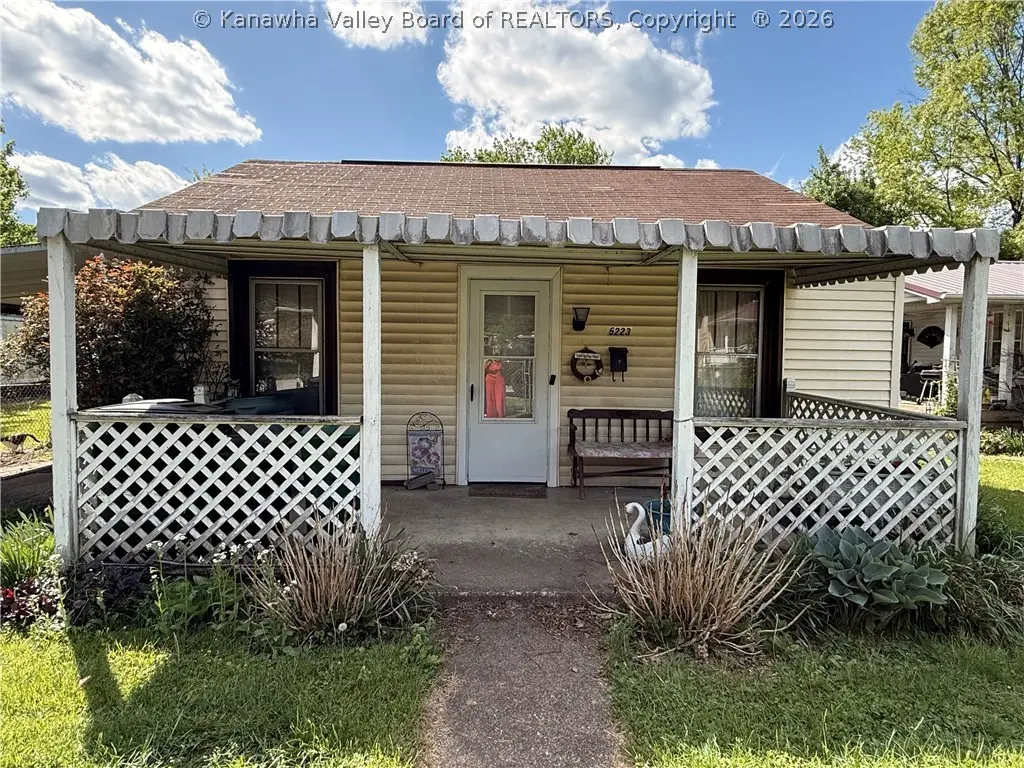
5223 Raven Dr · Rand, WV
Flood risk 10/10 · Severe
- FEMA flood zone
- X (shaded)
- Chance of flooding over 30 yrs
- 0.99%
- Est. flood insurance / yr
- $507 – $1,088
Fire risk 5/10 · Moderate
- Est. fire insurance / yr
- $787 – $1,461
Heat risk 5/10 · Moderate
- Hot days now (above 100°F)
- 8 days/yr
- Hot days in 30 yrs
- 21 days/yr
Wind risk 2/10 · Minimal
- Chance of severe wind over 30 yrs
- 1.0%
Air-quality risk 1/10 · Minimal
- Unhealthy air days now
- 0 days/yr
- Unhealthy air days in 30 yrs
- 0 days/yr
Risk factors via First Street. Map © Google.
Why this score? — see what drove the C- grade
The composite is a weighted blend of 9 inputs, each scored 0–100. Each bar is that input's sub-score; the figure is the points it added to the 100-point composite (weight × sub-score).
- Cash flow +15.0/30.0
- ARV discount +7.5/15.0
- Appreciation +7.0/10.0
- 1% rule +5.0/10.0
- DSCR +5.0/10.0
- Rent growth +4.4/5.0
- Livability +3.2/5.0
- Schools +2.9/10.0
- Condition / age +2.5/5.0
$35,000
🖨 Deal sheet 📄 Offer letter ✓ Due diligence
Listing remarks MLS
Contingent Contract Accepted W/ 72 Hr Kickout, Please Continue To Show. Nice Clean 1 Level Home With Flat Lot, Kitchen Appliances Remain, Den Could Be Used As 3rd Bedroom, Washer Dryer Remain, Storage Building, Carport & Off Street Parking.
Key facts
- 7,492 sq ft lot
- Listed 55 days
Property features AI
Exterior
- Parking: Carport; Parking pad
- Utilities: Public water; Public sewer
- Home design: Single-family residence; Single-story
- Construction: Block, plaster, and vinyl siding construction
- Exterior features: Composition/shingle roof; Lot approximately 0.172 acres
Interior
- Flooring: Carpet; Vinyl
- Bathrooms: 1 full bathroom; 1 half bathroom
- Heating & cooling: Heat pump and electric heating with forced air; Central air conditioning (heat pump)
- Interior features: Carpet and vinyl flooring; No basement; 6 total rooms
Neighborhood map
What this means for you Summary
Snapshot
- This is a 2-bed/1.5-bath single-family listed at $35k.
Deal economics
- At list price, monthly cash flow is $908 ($11k/yr) — positive.
- The deal already cash-flows at list — no discount required.
- Meets the 1% rule at list price ($2k rent vs $35k).
- Recommended offer: $34k (3.0% below list) — sets the bar for market timing.
Location & tenants
- Location reads 64/100 on livability (#138 in WV) — a middle-class / working-renter tenant base. Strengths: cost of living A+; Watch: commute D+, amenities F, health & safety F.
- Kanawha County Schools (suburban): math 29% / reading 40% proficiency, ranked #17 of 55 in WV (top 31%) — families likely to look elsewhere, expect single-tenant / working-renter base with shorter leases.
- Zoned schools: Malden Elementary School (math 22% / reading 17%, grade F, #350 of 377 statewide, top 95%, 152 students, 0% FRL); Riverside High School (math 17% / reading 47%, grade F, #55 of 110 statewide, top 59%, 1,220 students, 0% FRL) — zoned schools average 0% FRL vs 46% district-wide (46 pts lower); this property's tenant base skews higher-income than the district average.
- Market conditions: Rents rising fast (+7.6%/yr); 24 active listings in the ZIP; 103 units permitted in Kanawha County in 2024 (0 in 5+ unit buildings).
Forward outlook
- In year one you build about $2k of equity ($242 loan paydown + $1k appreciation (4.0% local appreciation)).
- Kanawha County population projected at -17% by 2050 — secular population decline; favor cash flow + early exit over multi-decade hold.
- At projected returns (4.0% appreciation + 7.6% rent growth), your $10k cash investment doubles in ~1 year — after that, you're playing with house money.
Negotiation context
- It's been on market 56 days — a 3% lower offer ($34k) is reasonable based on typical stale-listing flexibility.
- 3 sale attempts since 11y ago; this cycle's ask has dropped $30k (46%) from the opening price — seller is motivated, your offer sets the floor, not the list.
Risks & watch-outs
- Watch-outs: flood insurance adds $66/mo; built in 1940 — expect roof / HVAC / electrical / plumbing capex.
- Climate carrying-cost: severe flood risk; moderate wildfire risk; extreme-heat days projected 8→21/yr by 2055 (HVAC capex compounding) — expect insurance premiums to compound above CPI over the hold.
Questions for the listing agent
- It's been on market 56 days. Have you received any prior offers? Is the seller open to a 3% concession, seller financing, or rate buy-down credit?
- Built in 1940 — when were the roof, HVAC, electrical panel, plumbing, and water heater last replaced?
- What's the actual annual flood-insurance premium (NFIP or private), and is the property in a SFHA with mandatory coverage?
- Is there a deadline driving the sale (1031 exchange, divorce, estate, relocation)? That informs how much negotiation room exists.
- Schools are F-rated, which usually means shorter tenancies and higher turnover. Who's the typical renter profile here, and what's been the actual vacancy rate?
- What's the average days-on-market for RENTAL listings here right now (not sales)? A rising rental-DOM trend means longer vacancies and softer asking-rent achievability than the comps imply.
- What's the recent tenant-quality profile in this submarket — average credit score on applications, eviction rate, late-payment / NSF rate, and stable-employment percentage? A property-management company in the area should have these aggregated.
- How much new for-sale + rental construction is in the pipeline within 1–3 miles? Heavy new supply typically softens prices + rents 12–24 months out; constrained supply supports both.
Investment metrics
- 1% rule
- 4.29% ✓
- Cap rate
- 39.70%
- Cash-on-cash
- 119.32%
- DSCR
- 6.31
- GRM
- 1.9
CMA / ARV
- ARV (on-the-fly)
- $116,184
- Comps found
- 2
Show comp detail 2 sales within ~0.75 mi
| Address | Dist | Beds/Ba | Sqft | Sold | Price | $/sf | Match |
|---|---|---|---|---|---|---|---|
| 5611 Church Dr | 0.43mi | 3/1.5 (+1) | 972 (-14%) | 9mo | $68,000 | $70 | 44 |
| 5904 Starling Dr | 0.66mi | 2/1.0 | 964 (-14%) | 6mo | $99,000 | $103 | 38 |
Match score weights: distance 35% · size 25% · config 20% · recency 20%. Top-matched comps best support the ARV.
Projected returns pro-forma
3.99% appreciation · 7.59% rent growth · sell at horizon
- IRR
- —
- Equity multiple
- 8.27×
- Total profit
- $71,218
- Equity at exit
- $17,725
- IRR
- —
- Equity multiple
- 19.73×
- Total profit
- $183,563
- Equity at exit
- $28,974
Cash invested: $9,800 (down + closing). Projections, not guarantees.
Landlord ↔ Tenant lean methodology
- Overall (STATE)
- 83 Strongly Landlord-Friendly
- State West Virginia
- 83 Strongly Landlord-Friendly · R+22
- County
- — inherits STATE
- City
- — inherits STATE
ZIP-level market 25306
- Home prices YoY
- 2.1%
- Rents YoY
- 7.6%
- Active inventory
- 24
- Price-to-rent
- 1.9×
Monthly cashflow live
- Estimated rent
- $1,502 medium interval (Pro) →
- Mortgage (P&I)
- −$184
- Tax from tax record
- −$14 /mo · $166/yr
- Insurance
- −$15
- Flood insurance flood zone
- −$66 /mo · $798/yr
- HOA
- −$0
- Vacancy / Maint / Mgmt
- −$315
- Net cashflow
- $908
Break-even live
UW: 25.0% down · 7.5% · 30yr · 1.5% tax · 5.0% vac · 8.0% maint · 8.0% mgmt
Financing live
Cash to close
- Down payment
- $8,750
- Closing costs
- $1,050
- Reserves months
- —
- Total cash needed
- —
Loan-product check · same deal, 3 products live
Conventional
25% down · 7.5% · 30yr
- Down + closing
- —
- Monthly P&I
- —
- Monthly cashflow
- —
- DSCR
- —
- Eligible?
- —
Personal DTI + credit; lowest rate.
DSCR
20% down · 8.5% · 30yr
- Down + closing
- —
- Monthly P&I
- —
- Monthly cashflow
- —
- DSCR
- —
- Eligible?
- —
No personal income docs; deal must DSCR.
Hard money
10% down · 12.0% · 12mo
- Down + closing
- —
- Monthly P&I
- —
- Monthly cashflow
- —
- DSCR
- —
- Eligible?
- —
Short-term bridge; refi at stabilization.
Listing history 23 events
-
2026-06-19days on market $35,000 Active 56 DOM
-
2026-06-18days on market $35,000 Active 55 DOM
-
2026-06-17days on market $35,000 Active 54 DOM
-
2026-06-17price $35,000 Active 53 DOM
-
2026-06-16days on market $39,000 Active 53 DOM
-
2026-06-15days on market $39,000 Active 52 DOM
-
2026-06-14days on market $39,000 Active 50 DOM
-
2026-06-12days on market $39,000 Active 49 DOM
-
2026-06-09days on market $39,000 Active 46 DOM
-
2026-06-08days on market $39,000 Active 45 DOM
-
2026-06-07days on market $39,000 Active 44 DOM
-
2026-06-05pricedays on market $39,000 Active 41 DOM
-
2026-06-03days on market $49,000 Active 40 DOM
-
2026-06-02days on market $49,000 Active 39 DOM
-
2026-06-01days on market $49,000 Active 38 DOM
-
2026-05-31days on market $49,000 Active 37 DOM
-
2026-05-30days on market $49,000 Active 36 DOM
-
2026-05-05price $59,000
-
2026-04-24$65,000 Active
-
2025-09-26$86,000 Active
-
2015-08-28soldstatus $35,000 246-char remark
Show marketing remark (246 chars)
Contingent Contract Accepted W/ 72 Hr Kickout, Please Continue To Show. Nice Clean 1 Level Home With Flat Lot, Kitchen Appliances Remain, Den Could Be Used As 3rd Bedroom, Washer Dryer Remain, Storage Building, Carport & Off Street Parking.
-
2015-04-04$39,900 246-char remark
Show marketing remark (246 chars)
Contingent Contract Accepted W/ 72 Hr Kickout, Please Continue To Show. Nice Clean 1 Level Home With Flat Lot, Kitchen Appliances Remain, Den Could Be Used As 3rd Bedroom, Washer Dryer Remain, Storage Building, Carport & Off Street Parking.
-
1992-08-26soldstatus $32,000
ⓘ Source: listings_history table (triggers on properties + properties_extension) + one-shot
backfill from property_details.listing_events for pre-trigger history.
Tax reassessment forecast WV · Resets to sale price
- Current annual tax
- $166 · $14/mo
- Projected year-2 tax
- $206 · $17/mo
- Expected delta
- +$40/yr (+$3/mo · 24.4%)
ⓘ Screening estimate from a state-policy table — verify with the county assessor before closing.
Climate risk First Street
- Flood 10/10 Extreme FEMA zone X (shaded) · 99% chance over 30 yrs
- Wildfire 5/10 Major
- Heat 5/10 Major 8 d/yr ≥100°F today · 21 d/yr by 30 yrs out
- Wind 2/10 Low 100% chance of damaging wind over 30 yrs
- Air quality 1/10 Low 0 unhealthy d/yr today · 0 by 30 yrs out
Nearby sold comps map
Loading sold comps map…
Walkable amenities ~0.75 mi
Loading nearby amenities…
Taxation est. · year 1
- Rental income
- $18,022
- − Mortgage interest
- −$1,961
- − Property taxes
- −$166
- − Insurance
- −$972
- − Repairs & maintenance
- −$1,442
- − Management
- −$1,442
- − Depreciation
- −$1,018
- Taxable income
- $11,021
- Est. tax owed @ 24.0%
- −$2,645
- After-tax cash flow
- $8,251/yr
For passive investors: Depreciation is non-cash, so a rental often shows a tax loss while cash-flowing — sheltering income. Rental losses are passive: they offset passive income freely, and up to $25,000/yr can offset ordinary (W-2) income if you actively participate and your MAGI is under $100k (phasing out to $0 by $150k); unused losses carry forward. On sale, claimed depreciation is recaptured at up to 25%, and gains may owe capital-gains tax (a 1031 exchange can defer both). Figures are a year-1 estimate at your 24.0% rate — not tax advice; consult a CPA.
Schools (NCES district)
- District
- Kanawha County Schools
- NCES district ID
- 5400600
- Math proficiency
- 29% ▼ -13.00%
- Reading proficiency
- 40% ▼ -7.00%
- Median HH income
- $44,329
- Composite
- 29.35/100
- National rank
- #6540
- State rank
- #17 of 55 in WV
Livability — Rand
- Score
- 64/100
- State rank
- #138
- US rank
- #13922
Category grades
Schools grade is shown separately in the Schools card above.
Census & demographics
- Census place
- Rand, WV
- County
- Kanawha County · 33,502 people
- Metro
- Charleston, WV
- Population (ZIP)
- 6,040
- Household income
- $71,654
- Rent vs Own
- Severe rent burden
- 124.0
Population outlook (Kanawha County) Hauer SSP2
- Today (2025)
- 178,946 people
- By 2030
- 172,906 · -3.4%
- By 2040
- 159,874 · -10.7%
- By 2050
- 148,148 · -17.2%
- By 2075
- 123,257 · -31.1%
- By 2100
- 96,454 · -46.1%
Race, ethnicity, and origin ACS 2023
- Neighborhood character
- Predominantly White (86%)
- Race & ethnicity
- White 86% Black 6% Hispanic / Latino 3% Two or more races 3% Asian 3%
- Common ancestry
- Italian 4% Slovak 3% Iranian 1%
- Foreign-born
- 3% · Canada
- Languages at home
- 97% English-only · Other Asian/Pacific 1% Other Indo-European 1%
Political lean MEDSL · Kanawha
- 2024 margin
- R (+17.4) · D 40.2% · R 57.6% · Other 2.2%
- 2008→2024 swing
- -17.0pp toward R · 2008: -0.4pp · 2024: -17.4pp
- All cycles
- 2024: R+17.4 2020: R+14.7 2016: R+20.6 2012: R+11.9 2008: R+0.4
Not yet ingested
- Civics
- —
Market trends
- HPI YoY
- ▲ 3.99%
- Current HPI
- 195.9623
- Rent YoY
- ▲ 7.59%
- Metro
- Charleston, WV
- State GDP YoY
- —
- F500 in state
- 0
Price history
+84.4% since first listed6 events — show timeline
- 2026-05-05 Price Changed $59,000 KVBOR
- 2026-04-24 Listed $65,000 KVBOR
- 2025-09-26 Listed $86,000 KVBOR
- 2015-08-28 Sold (MLS) $35,000 KVBOR
- 2015-04-04 Listed $39,900 KVBOR
- 1992-08-26 Sold (Public Records) $32,000 Public Records
Property tax history
+4.3%/yrLatest (2025): $166 · +0.0% YoY. Source: county tax records.
Cash-flow waterfall
monthlySold comps — $/sqft
last 12 mo · ≤1 miLoading sold comps…