1639 Verdin Rd · Fort Worth, TX
Flood risk No data
- FEMA flood zone
- —
- Chance of flooding over 30 yrs
- —
- Est. flood insurance / yr
- —
Fire risk No data
- Est. fire insurance / yr
- —
Heat risk No data
- Hot days now (above threshold)
- —
- Hot days in 30 yrs
- —
Wind risk No data
- Chance of severe wind over 30 yrs
- —
Air-quality risk No data
- Unhealthy air days now
- —
- Unhealthy air days in 30 yrs
- —
Risk factors via First Street. Map © Google.
Why this score? — see what drove the D- grade
The composite is a weighted blend of 9 inputs, each scored 0–100. Each bar is that input's sub-score; the figure is the points it added to the 100-point composite (weight × sub-score).
- Cash flow +12.4/30.0
- ARV discount +7.7/15.0
- Livability +4.0/5.0
- 1% rule +3.9/10.0
- DSCR +3.7/10.0
- Rent growth +2.5/5.0
- Schools +2.3/10.0
- Condition / age +2.2/5.0
- Appreciation +0.0/10.0
$159,999
🖨 Deal sheet 📄 Offer letter ✓ Due diligence
Listing remarks
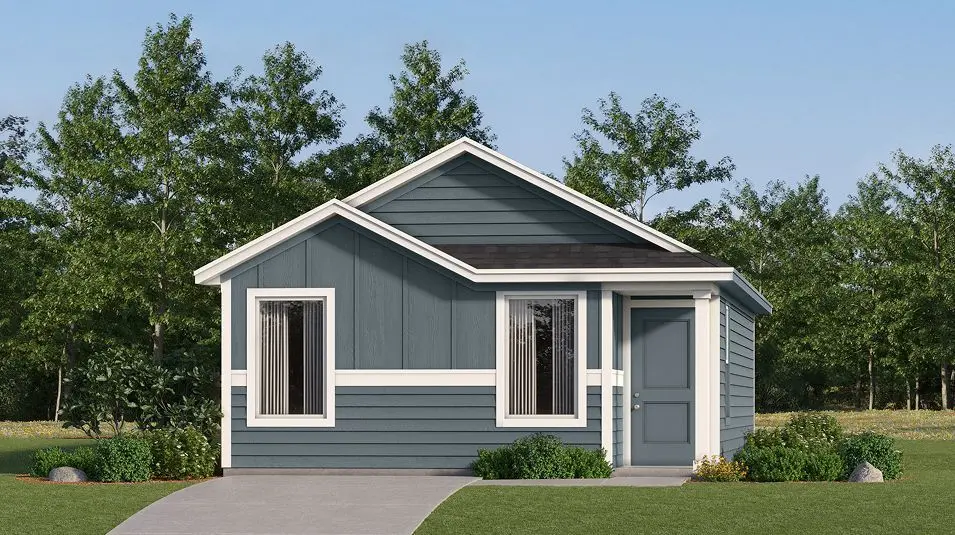
This single-level home showcases a spacious open floorplan shared between the kitchen, dining area and family room for easy entertaining during gatherings. An owner’s suite enjoys a private location in the back of the home, complemented by an en-suite bathroom and walk-in closet. The versatile secondary bedroom is ideal for household members and overnight guests or can easily transform into an office, depending on the homeowner’s needs.
Key facts
- Walk-in closet
- Open floorplan
- En-suite bathroom
Tags
Property features AI
Finance
- Other: Subdivision: Eagles Crossing; Builder listing / special listing condition
- Financial info: Accepts Cash, Conventional, FHA, USDA, and VA financing; No second mortgage indicated
- HOA & community: Mandatory association managed by Legacy Southwest; Annual association fee of $500 covering full use of facilities, grounds maintenance, and management fees
Exterior
- Parking: Attached garage that faces front (20 ft wide x 18 ft deep)
- Security: Smoke detector(s), carbon monoxide detector(s), and fire alarm
- Utilities: City water and city sewer; Concrete curbs and sidewalks; Municipal utility district; Energy-efficient features including upgraded attic insulation, efficient doors and windows, insulated components, low-flow commode, rain/freeze sensors, and programmable thermostat
- Home design: Single family residence (attached); One-story; New construction (2025, incomplete)
- Construction: Brick and fiber cement exterior; Composition roof; Slab foundation
- Exterior features: Covered porch(es); Wood fencing; Interior lot that is landscaped with sprinkler system
Interior
- Kitchen: Eat-in kitchen with natural stone/granite countertops; Walk-in pantry; Water line to refrigerator; Gas oven and gas range; Microwave; Dishwasher; Disposal; Vented exhaust fan
- Bedrooms: Primary bedroom (first level) with separate shower and walk-in closet; Additional bedroom (first level)
- Flooring: Carpet; Luxury vinyl plank
- Bathrooms: 2 full bathrooms
- Heating & cooling: Central heating (electric) with ENERGY STAR qualified equipment; Central air (electric) with ENERGY STAR qualified equipment
- Interior features: Open floorplan with decorative lighting and built-in features; Cable TV and high-speed internet available; Pantry; Walk-in closet(s)
- Laundry & utility: Tankless water heater
Neighborhood map
What this means for you Summary
Snapshot
- This is a 2-bed/2.0-bath single-family listed at $160k. Condition is rated fair.
Deal economics
- At list price, monthly cash flow is $-26 ($-315/yr) — negative.
- To cash-flow at today's rent, offer at most $156k (2.4% below list).
- To meet the 1% rule (rent ≥ 1% of price), the offer needs to be $142k (11.3% below list).
- Recommended offer: $142k (11.3% below list) — sets the bar for 1% rule.
- Cap rate 6.1% vs local median 3.9% in Fort Worth — top-decile yield for the area; either an underpriced asset or a hidden risk that comps aren't pricing in. Stress-test before assuming the spread holds.
Location & tenants
- Location reads 80/100 on livability (#49 in TX, #1,954 nationally) — a professional / high-income tenant draw. Strengths: amenities A+, cost of living A+, housing A+; Watch: crime F.
- Everman ISD (suburban): math 21% / reading 32% proficiency, ranked #691 of 826 in TX (top 84%) — low school quality limits family demand, transient renter base, plan for 1-2y turnover; 77% free/reduced lunch — lower-income household profile, screen leases tightly.
- Zoned schools: John And Polly Townley El (math 15% / reading 21%, grade F, #3,785 of 4,322 statewide, top 88%, 365 students, 95% FRL) — zoned schools average 95% FRL vs 77% district-wide (18 pts higher); higher-poverty schools than district average — tighter screening recommended.
- Market conditions: Rents flat; 374 active listings in the ZIP; 16 comparable units currently listed for rent nearby; rentals at typical pace (median 20d on market — plan ~3-4 weeks tenant-placement turnaround); solid renter incomes; 18,938 units permitted in Tarrant County in 2024 (8,336 in 5+ unit buildings).
Forward outlook
- Local home prices are declining (-3.0%/yr); year-one equity from $1k of loan paydown is wiped out by about $5k of value loss. Plan a longer hold.
- Tarrant County population projected at +41% by 2050 — long-run rental-demand tailwind backs the buy-and-hold thesis.
Negotiation context
- Only 2 days on market — expect competitive offers; lowballing is unlikely to land.
Questions for the listing agent
- What do current leases actually rent for vs. the listed asking? Can we see a recent rent roll and the last 12 months of T-12 income?
- Have any recent inspections been done? Can we get a copy of the seller's disclosures and any deferred-maintenance estimates?
- What does the HOA fee cover, when was the last increase, and are there any pending special assessments or reserve-fund shortfalls?
- Is there a deadline driving the sale (1031 exchange, divorce, estate, relocation)? That informs how much negotiation room exists.
- Schools are D-rated, which usually means shorter tenancies and higher turnover. Who's the typical renter profile here, and what's been the actual vacancy rate?
- Crime grade is F in this area — have there been break-ins, vandalism, or insurance claims at this property in the last 3 years? What carrier currently insures it and at what premium?
- The area grade is low — what's the realistic commute time and amenity access for the typical tenant pool here? Any planned neighborhood developments (good or bad) we should know about?
- What's the average days-on-market for RENTAL listings here right now (not sales)? A rising rental-DOM trend means longer vacancies and softer asking-rent achievability than the comps imply.
- What's the recent tenant-quality profile in this submarket — average credit score on applications, eviction rate, late-payment / NSF rate, and stable-employment percentage? A property-management company in the area should have these aggregated.
- How much new for-sale + rental construction is in the pipeline within 1–3 miles? Heavy new supply typically softens prices + rents 12–24 months out; constrained supply supports both.
Investment metrics
- 1% rule
- 0.89% ✗
- Cap rate
- 6.10%
- Cash-on-cash
- -0.70%
- DSCR
- 0.97
- GRM
- 9.4
CMA / ARV
- ARV (median comp)
- $160,583
- List price
- $159,999
- Delta
- -0.36%
- Verdict
- FAIR
- Comps
- 4 within 1.0 mi
Projected returns pro-forma
-3.0% appreciation · 0.11% rent growth · sell at horizon
- IRR
- -20.8%
- Equity multiple
- 0.30×
- Total profit
- $-31,561
- Equity at exit
- $23,856
- IRR
- -23.0%
- Equity multiple
- -0.00×
- Total profit
- $-44,979
- Equity at exit
- $13,834
Cash invested: $44,800 (down + closing). Projections, not guarantees.
Landlord ↔ Tenant lean methodology
- Overall (STATE)
- 87 Strongly Landlord-Friendly
- State Texas
- 87 Strongly Landlord-Friendly · R+5
- County
- — inherits STATE
- City
- — inherits STATE
ZIP-level market 76140
- Home prices YoY
- -21.8%
- Rents YoY
- 0.1%
- Active inventory
- 374
- Price-to-rent
- 9.4×
Monthly cashflow live
- Estimated rent
- $1,420 high interval (Pro) →
- Mortgage (P&I)
- −$839
- Tax est. 1.5%
- −$200 /mo · $2,400/yr
- Insurance
- −$67
- HOA
- −$42
- Vacancy / Maint / Mgmt
- −$298
- Net cashflow
- $-26
Break-even live
UW: 25.0% down · 7.5% · 30yr · 1.5% tax · 5.0% vac · 8.0% maint · 8.0% mgmt
Financing live
Cash to close
- Down payment
- $40,000
- Closing costs
- $4,800
- Reserves months
- —
- Total cash needed
- —
Loan-product check · same deal, 3 products live
Conventional
25% down · 7.5% · 30yr
- Down + closing
- —
- Monthly P&I
- —
- Monthly cashflow
- —
- DSCR
- —
- Eligible?
- —
Personal DTI + credit; lowest rate.
DSCR
20% down · 8.5% · 30yr
- Down + closing
- —
- Monthly P&I
- —
- Monthly cashflow
- —
- DSCR
- —
- Eligible?
- —
No personal income docs; deal must DSCR.
Hard money
10% down · 12.0% · 12mo
- Down + closing
- —
- Monthly P&I
- —
- Monthly cashflow
- —
- DSCR
- —
- Eligible?
- —
Short-term bridge; refi at stabilization.
Rent comps 16 comps
| Address | Beds | Baths | Sqft | Rent | $/sqft | DOM | Units | Dist |
|---|---|---|---|---|---|---|---|---|
| 1508 Pine Ln Fort Worth, TX | 3.0 | 1.0 | 1098 | $1,599 | $1.46 | 44d | 1 | 0.27mi |
| 1452 Pine Ln Fort Worth, TX | 3.0 | 1.5 | 1098 | $1,595 | $1.45 | 20d | 1 | 0.30mi |
| 10716 Wild Oak Dr Fort Worth, TX | 2.0 | 2.0 | 1072 | $1,595 | $1.49 | 20d | 1 | 0.36mi |
| 10745 Many Oaks Dr Fort Worth, TX | 2.0 | 1.0 | 997 | $1,595 | $1.60 | 24d | 1 | 0.38mi |
| 1500 Four Seasons Ln Fort Worth, TX | 1.0–3.0 | 1.0–2.0 | 876 | $1,054 | $1.20 | 22d | 1 | 0.67mi |
| 9053 S Race St Fort Worth, TX | 1.0 | 1.0 | 850 | $990 | $1.16 | 13d | 1 | 1.22mi |
| 9053 S Race St Unit 9074 Fort Worth, TX | 1.0 | 1.0 | 850 | $1,036 | $1.22 | 13d | 1 | 1.29mi |
| 9053 S Race St Unit 9110 Fort Worth, TX | 2.0 | 2.0 | 1072 | $1,194 | $1.11 | 3d | 1 | 1.29mi |
| 9053 S Race St Unit 9074 Fort Worth, TX | 1.0 | 1.0 | 850 | $998 | $1.17 | 3d | 1 | 1.29mi |
| 9053 S Race St Unit 9080 Fort Worth, TX | 2.0 | 2.0 | 1072 | $1,272 | $1.19 | 44d | 1 | 1.29mi |
| 9053 S Race St Unit 9104 Fort Worth, TX | 1.0 | 1.0 | 850 | $1,031 | $1.21 | 44d | 1 | 1.29mi |
| 9000 Balch St Unit 9021 Everman, TX | 1.0 | 1.0 | 872 | $957 | $1.10 | 3d | 1 | 1.31mi |
| 9000 Balch St Unit 9021 Everman, TX | 1.0 | 1.0 | 872 | $995 | $1.14 | 13d | 1 | 1.31mi |
| 9000 Balch St Unit 512 Everman, TX | 2.0 | 2.0 | 1100 | $974 | $0.89 | 3d | 1 | 1.32mi |
| 9000 Balch St Unit 9051 Everman, TX | 1.0 | 1.0 | 872 | $990 | $1.14 | 44d | 1 | 1.32mi |
| 9000 Balch St Fort Worth, TX | 1.0 | 1.0 | 872 | $949 | $1.09 | 13d | 1 | 1.32mi |
HOA detail
- Monthly dues
- $42 · $504/yr
Listing history 8 events
-
2026-06-17status $159,999 Pending 2 DOM
-
2026-06-17days on market $159,999 Active 2 DOM
-
2026-06-15days on market $159,999 Active 1 DOM
-
2026-06-15days on market $159,999 Active 27 DOM
-
2026-06-13days on market $159,999 Active 25 DOM
-
2026-06-10price $159,999 Active 21 DOM
-
2026-06-09days on market $184,999 Active 21 DOM
-
2026-06-08pricestatusdays on market $184,999 Active 20 DOM
ⓘ Source: listings_history table (triggers on properties + properties_extension) + one-shot
backfill from property_details.listing_events for pre-trigger history.
Nearby sold comps map
Loading sold comps map…
Walkable amenities ~0.75 mi
Loading nearby amenities…
Taxation est. · year 1
- Rental income
- $17,036
- − Mortgage interest
- −$8,962
- − Property taxes
- −$2,400
- − Insurance
- −$800
- − Repairs & maintenance
- −$1,363
- − Management
- −$1,363
- − HOA
- −$504
- − Depreciation
- −$4,655
- Taxable loss
- −$3,011
- Est. tax savings @ 24.0%
- +$723
- After-tax cash flow
- $408/yr
For passive investors: Depreciation is non-cash, so a rental often shows a tax loss while cash-flowing — sheltering income. Rental losses are passive: they offset passive income freely, and up to $25,000/yr can offset ordinary (W-2) income if you actively participate and your MAGI is under $100k (phasing out to $0 by $150k); unused losses carry forward. On sale, claimed depreciation is recaptured at up to 25%, and gains may owe capital-gains tax (a 1031 exchange can defer both). Figures are a year-1 estimate at your 24.0% rate — not tax advice; consult a CPA.
Condition & rehab AI · 2 photos
The home requires moderate exterior repairs and painting to improve its curb appeal and overall value.
Repairs flagged
- Major exterior siding — Significant wear and tear
- Major exterior paint — Weathered and peeling
Value-add opportunities
- Both paint exterior — Enhances curb appeal and value
- Both repair and paint exterior siding — Improves home's appearance and value
Renovation cost estimate screening
| Repair item | Severity | Est. cost |
|---|---|---|
| exterior siding · Significant wear and tear | Major | $15,000–50,000 |
| exterior paint · Weathered and peeling | Major | $15,000–50,000 |
| Total estimated repair cost · 2 items | $30,000–100,000 |
Value-add ROI direction
- Both paint exterior — Enhances curb appeal and value ↑
- Both repair and paint exterior siding — Improves home's appearance and value ↑
ⓘ Cost ranges are severity-bucket heuristics (US national rule-of-thumb). Get contractor quotes + a written scope before underwriting a rehab budget.
Schools (NCES district)
- District
- Everman ISD
- NCES district ID
- 4818810
- Math proficiency
- 21% ▼ -18.00%
- Reading proficiency
- 32% ▼ -4.00%
- Median HH income
- $44,803
- Composite
- 22.77/100
- National rank
- #8027
- State rank
- #691 of 826 in TX
Livability — Fort Worth
- Score
- 80/100
- State rank
- #49
- US rank
- #1954
Category grades
Schools grade is shown separately in the Schools card above.
Census & demographics
- Census place
- Fort Worth, TX
- County
- Tarrant County · 2,033,669 people
- City population
- 911,619
- Metro
- Dallas-Fort Worth-Arlington, TX
- Population (ZIP)
- 33,321
- Household income
- $75,955
- Rent vs Own
- Severe rent burden
- 1264.0
Population outlook (Tarrant County) Hauer SSP2
- Today (2025)
- 2,380,417 people
- By 2030
- 2,578,900 · +8.3%
- By 2040
- 2,974,995 · +25.0%
- By 2050
- 3,350,489 · +40.8%
- By 2075
- 4,216,909 · +77.2%
- By 2100
- 4,741,527 · +99.2%
Race, ethnicity, and origin ACS 2023
- Neighborhood character
- Diverse neighborhood (Simpson 0.68)
- Race & ethnicity
- Hispanic / Latino 39% Black 35% White 20% Two or more races 14% Asian 3%
- Hispanic origin (detail)
- Mexican 36%
- Common ancestry
- Scotch-Irish 2% Lithuanian 1% Slovak 1%
- Foreign-born
- 18% · Canada, Vietnam, China
- Languages at home
- 64% English-only · Spanish 32% Vietnamese 2% Chinese 1%
Political lean MEDSL · Tarrant
- 2024 margin
- Lean R (+5.1) · D 46.7% · R 51.9% · Other 1.4%
- 2008→2024 swing
- +6.6pp toward D · 2008: -11.7pp · 2024: -5.1pp
- All cycles
- 2024: R+5.1 2020: D+0.2 2016: R+8.7 2012: R+15.7 2008: R+11.7
Not yet ingested
- Civics
- —
Market trends
- HPI YoY
- ▼ -79.54%
- Current HPI
- 285.9894
- Rent YoY
- ▲ 0.11%
- Metro
- Dallas-Fort Worth-Arlington, TX
- State GDP YoY
- ▲ 3.95%
- F500 in state
- 110
Industry mix (Fortune 500 HQ in TX)
| Industry | F500 HQs | Revenue |
|---|---|---|
| Energy | 16 | $1,198B |
|
||
| Technology | 5 | $198B |
|
||
| Engineering / Construction | 4 | $72B |
|
||
| Energy Services | 3 | $60B |
|
||
| Utilities | 3 | $41B |
|
||
| Healthcare | 2 | $330B |
|
||
Price history
2 events — show timeline
- 2026-06-17 Pending — NTREIS
- 2026-06-15 Listed $159,999 NTREIS
Cash-flow waterfall
monthlySold comps — $/sqft
last 12 mo · ≤1 miLoading sold comps…