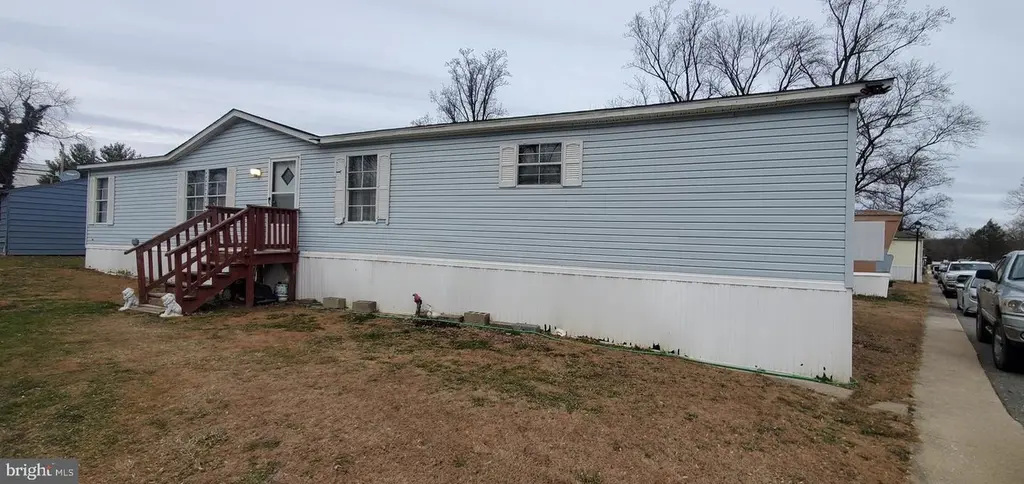
126 West Inca St · Aberdeen, MD
Flood risk No data
- FEMA flood zone
- —
- Chance of flooding over 30 yrs
- —
- Est. flood insurance / yr
- —
Fire risk No data
- Est. fire insurance / yr
- —
Heat risk No data
- Hot days now (above threshold)
- —
- Hot days in 30 yrs
- —
Wind risk No data
- Chance of severe wind over 30 yrs
- —
Air-quality risk No data
- Unhealthy air days now
- —
- Unhealthy air days in 30 yrs
- —
Risk factors via First Street. Map © Google.
Why this score? — see what drove the B- grade
The composite is a weighted blend of 9 inputs, each scored 0–100. Each bar is that input's sub-score; the figure is the points it added to the 100-point composite (weight × sub-score).
- Cash flow +30.0/30.0
- 1% rule +10.0/10.0
- DSCR +10.0/10.0
- ARV discount +7.5/15.0
- Livability +4.0/5.0
- Schools +2.9/10.0
- Condition / age +2.8/5.0
- Rent growth +2.6/5.0
- Appreciation +0.0/10.0
$75,000
🖨 Deal sheet (PDF) 📄 Offer letter ✓ Due diligence
Listing remarks MLS
Attention !! Here is your chance to own a double wide at the price of most singlewide homes. Updates include flooring, kitchen and roof. Three large bedrooms and two full bathrooms. Spacious kitchen and living room. Large utility room for washer and dryer. All buyers must be park approved to purchase . Schedule your personal tour today!
Key facts
- Spacious kitchen
- Updates include roof
- Large utility room
Tags
Neighborhood map
What this means for you Summary
Snapshot
- This is a 3-bed/2.0-bath single-family listed at $75k. Condition is rated average.
Deal economics
- At list price, monthly cash flow is $944 ($11k/yr) — positive.
- The deal already cash-flows at list — no discount required.
- Meets the 1% rule at list price ($2k rent vs $75k).
- Recommended offer: $66k (12.0% below list) — sets the bar for market timing.
- Cap rate 21.4% vs local median 4.8% in Aberdeen — top-decile yield for the area; either an underpriced asset or a hidden risk that comps aren't pricing in. Stress-test before assuming the spread holds.
Location & tenants
- Location reads 81/100 on livability (#42 in MD, #1,545 nationally) — a professional / high-income tenant draw. Strengths: commute A+, housing A+, health & safety A+; Watch: crime F.
- Harford County Public Schools (suburban): math 22% / reading 39% proficiency, ranked #9 of 24 in MD (top 38%) — families likely to look elsewhere, expect single-tenant / working-renter base with shorter leases.
- Zoned schools: Roye-Williams Elementary (math 12% / reading 22%, grade F, #408 of 860 statewide, top 50%, 442 students, 50% FRL); Aberdeen Middle (math 5% / reading 27%, grade F, #183 of 225 statewide, top 84%, 1,082 students, 63% FRL); Aberdeen High (math 47% / reading 56%, grade D+, #105 of 222 statewide, top 47%, 1,495 students, 53% FRL) — zoned schools average 55% FRL vs 24% district-wide (31 pts higher); higher-poverty schools than district average — tighter screening recommended.
- Market conditions: Rents flat; 189 active listings in the ZIP; 6 comparable units currently listed for rent nearby; rentals lingering (median 46d on market — plan ~5-8 weeks vacancy on turnover, expect pricing pressure); 50% of comp listings sitting > 30 days — soft ceiling on asking rent; solid renter incomes; 803 units permitted in Harford County in 2024 (26 in 5+ unit buildings).
Forward outlook
- Local home prices are declining (-3.0%/yr); year-one equity from $519 of loan paydown is wiped out by about $2k of value loss. Plan a longer hold.
- At projected returns (-3.0% appreciation + 0.3% rent growth), your $21k cash investment doubles in ~3 years — after that, you're playing with house money.
Negotiation context
- It's been on market 146 days — a 12% lower offer ($66k) is reasonable based on typical stale-listing flexibility.
Questions for the listing agent
- It's been on market 146 days. Have you received any prior offers? Is the seller open to a 12% concession, seller financing, or rate buy-down credit?
- Why hasn't it sold? Are there any deal-killer items the seller is aware of (foundation, flood, title, zoning, code violations)?
- Is there a deadline driving the sale (1031 exchange, divorce, estate, relocation)? That informs how much negotiation room exists.
- Crime grade is F in this area — have there been break-ins, vandalism, or insurance claims at this property in the last 3 years? What carrier currently insures it and at what premium?
- What's the average days-on-market for RENTAL listings here right now (not sales)? A rising rental-DOM trend means longer vacancies and softer asking-rent achievability than the comps imply.
- What's the recent tenant-quality profile in this submarket — average credit score on applications, eviction rate, late-payment / NSF rate, and stable-employment percentage? A property-management company in the area should have these aggregated.
- How much new for-sale + rental construction is in the pipeline within 1–3 miles? Heavy new supply typically softens prices + rents 12–24 months out; constrained supply supports both.
Investment metrics
- 1% rule
- 2.47% ✓
- Cap rate
- 21.40%
- Cash-on-cash
- 53.96%
- DSCR
- 3.40
- GRM
- 3.4
CMA / ARV
- ARV (median comp)
- $244,339
- List price
- $75,000
- Delta
- -69.30%
- Verdict
- UNDERPRICED
- Comps
- 20 within 1.0 mi
Show comp detail 8 sales within ~0.75 mi
| Address | Dist | Beds/Ba | Sqft | Sold | Price | $/sf | Match |
|---|---|---|---|---|---|---|---|
| 123 Wood Rd | 0.41mi | 3/2.0 | 1,100 (-8%) | 2mo | $47,000 | $43 | 65 |
| 143 Banister Ave | 0.40mi | 3/2.0 | 1,050 (-12%) | 11mo | $322,000 | $307 | 51 |
| 174 Banister Ave | 0.39mi | 3/2.0 | 1,050 (-12%) | 13mo | $329,990 | $314 | 50 |
| 162 Banister Ave | 0.40mi | 3/2.0 | 1,050 (-12%) | 15mo | $330,000 | $314 | 48 |
| 18 Pine St | 0.68mi | 3/2.0 | 1,248 (+4%) | 22mo | $70,000 | $56 | 43 |
| 413 Clover St | 0.61mi | 3/1.0 | 1,128 (-6%) | 19mo | $270,000 | $239 | 42 |
| 404 Clover St | 0.66mi | 3/1.0 | 1,044 (-13%) | 4mo | $299,900 | $287 | 40 |
| 148 Osborne Rd | 0.73mi | 4/2.5 (+1) | 1,344 (+12%) | 16mo | $290,000 | $216 | 26 |
Match score weights: distance 35% · size 25% · config 20% · recency 20%. Top-matched comps best support the ARV.
Projected returns pro-forma
-3.0% appreciation · 0.28% rent growth · sell at horizon
- IRR
- 49.0%
- Equity multiple
- 3.05×
- Total profit
- $43,081
- Equity at exit
- $11,183
- IRR
- 53.4%
- Equity multiple
- 5.57×
- Total profit
- $95,898
- Equity at exit
- $6,485
Cash invested: $21,000 (down + closing). Projections, not guarantees.
Landlord ↔ Tenant lean methodology
- Overall (STATE)
- 27 Tenant-Leaning
- State Maryland
- 27 Tenant-Leaning · D+14
- County
- — inherits STATE
- City
- — inherits STATE
ZIP-level market 21001
- Home prices YoY
- -30.5%
- Rents YoY
- 0.3%
- Active inventory
- 189
- Price-to-rent
- 3.4×
Monthly cashflow live
- Estimated rent
- $1,851 high interval (Pro) →
- Mortgage (P&I)
- −$393
- Tax est. 1.5%
- −$94 /mo · $1,125/yr
- Insurance
- −$31
- HOA
- −$0
- Vacancy / Maint / Mgmt
- −$389
- Net cashflow
- $944
Break-even live
Sensitivity live
| Price | -10% $996 | -5% $970 | +0% $944 | +5% $918 | +10% $892 |
|---|---|---|---|---|---|
| Rent | -10% $798 | -5% $871 | +0% $944 | +5% $1,017 | +10% $1,090 |
| Rate | -1.0pp $982 | -0.5pp $963 | base $944 | +0.5pp $925 | +1.0pp $905 |
UW: 25.0% down · 7.5% · 30yr · 1.5% tax · 5.0% vac · 8.0% maint · 8.0% mgmt
Financing live
Cash to close
- Down payment
- $18,750
- Closing costs
- $2,250
- Reserves months
- —
- Total cash needed
- —
Loan-product check · same deal, 3 products live
Conventional
25% down · 7.5% · 30yr
- Down + closing
- —
- Monthly P&I
- —
- Monthly cashflow
- —
- DSCR
- —
- Eligible?
- —
Personal DTI + credit; lowest rate.
DSCR
20% down · 8.5% · 30yr
- Down + closing
- —
- Monthly P&I
- —
- Monthly cashflow
- —
- DSCR
- —
- Eligible?
- —
No personal income docs; deal must DSCR.
Hard money
10% down · 12.0% · 12mo
- Down + closing
- —
- Monthly P&I
- —
- Monthly cashflow
- —
- DSCR
- —
- Eligible?
- —
Short-term bridge; refi at stabilization.
Rent comps 6 comps
| Address | Beds | Baths | Sqft | Rent | $/sqft | DOM | Units | Dist |
|---|---|---|---|---|---|---|---|---|
| 27 E Bel Air Ave Unit 1 Aberdeen, MD | 3.0 | 1.0 | 923 | $1,750 | $1.90 | 45d | 1 | 0.96mi |
| 27 E Bel Air Ave Apt 2 Aberdeen, MD | 3.0 | 1.0 | 944 | $1,550 | $1.64 | 45d | 1 | 0.96mi |
| 104 S Parke St Aberdeen, MD | 3.0 | 1.5 | 900 | $1,700 | $1.89 | 25d | 1 | 1.21mi |
| 114 S Parke St Apt A Aberdeen, MD | 2.0 | 1.5 | 825 | $1,400 | $1.70 | 45d | 1 | 1.22mi |
| 70 Swan St Aberdeen, MD | 3.0 | 2.0 | 924 | $1,715 | $1.86 | 6d | 1 | 1.33mi |
| 309 S Parke St Aberdeen, MD | 1.0–2.0 | 1.0 | 850 | $1,695 | $1.99 | 0d | 1 | 1.40mi |
Listing history 15 events
-
2026-06-21days on market $75,000 Active 146 DOM
-
2026-06-18days on market $75,000 Active 143 DOM
-
2026-06-17days on market $75,000 Active 142 DOM
-
2026-06-16days on market $75,000 Active 141 DOM
-
2026-06-15days on market $75,000 Active 140 DOM
-
2026-06-13days on market $75,000 Active 138 DOM
-
2026-06-09days on market $75,000 Active 134 DOM
-
2026-06-08days on market $75,000 Active 133 DOM
-
2026-06-07days on market $75,000 Active 132 DOM
-
2026-06-04days on market $75,000 Active 129 DOM
-
2026-06-03days on market $75,000 Active 128 DOM
-
2026-06-02days on market $75,000 Active 127 DOM
-
2026-06-01days on market $75,000 Active 126 DOM
-
2026-05-31days on market $75,000 Active 125 DOM
-
2026-01-26$75,000 Active 339-char remark
Show marketing remark (339 chars)
Attention !! Here is your chance to own a double wide at the price of most singlewide homes. Updates include flooring, kitchen and roof. Three large bedrooms and two full bathrooms. Spacious kitchen and living room. Large utility room for washer and dryer. All buyers must be park approved to purchase . Schedule your personal tour today!
ⓘ Source: listings_history table (triggers on properties + properties_extension) + one-shot
backfill from property_details.listing_events for pre-trigger history.
Nearby sold comps map
Loading sold comps map…
Walkable amenities ~0.75 mi
Loading nearby amenities…
Taxation est. · year 1
- Rental income
- $22,216
- − Mortgage interest
- −$4,201
- − Property taxes
- −$1,125
- − Insurance
- −$375
- − Repairs & maintenance
- −$1,777
- − Management
- −$1,777
- − Depreciation
- −$2,182
- Taxable income
- $10,778
- Est. tax owed @ 24.0%
- −$2,587
- After-tax cash flow
- $8,744/yr
For passive investors: Depreciation is non-cash, so a rental often shows a tax loss while cash-flowing — sheltering income. Rental losses are passive: they offset passive income freely, and up to $25,000/yr can offset ordinary (W-2) income if you actively participate and your MAGI is under $100k (phasing out to $0 by $150k); unused losses carry forward. On sale, claimed depreciation is recaptured at up to 25%, and gains may owe capital-gains tax (a 1031 exchange can defer both). Figures are a year-1 estimate at your 24.0% rate — not tax advice; consult a CPA.
Condition & rehab AI · 12 photos
This home requires moderate repairs and maintenance to improve its condition and resale value.
Repairs flagged
- Minor exterior siding — Some discoloration
- Minor interior walls — Some wear
- Minor landscaping — Some overgrown areas
Value-add opportunities
- Resale paint exterior siding — Enhances curb appeal
- Resale replace carpet in living areas — Fresh carpet improves aesthetics
- Resale replace carpet in kitchen — Fresh carpet improves aesthetics
- Resale paint interior walls — Fresh paint improves aesthetics
- Resale landscaping — Improved landscaping enhances curb appeal
Renovation cost estimate screening
| Repair item | Severity | Est. cost |
|---|---|---|
| exterior siding · Some discoloration | Minor | $500–3,000 |
| interior walls · Some wear | Minor | $500–3,000 |
| landscaping · Some overgrown areas | Minor | $500–3,000 |
| Total estimated repair cost · 3 items | $1,500–9,000 |
Value-add ROI direction
- Resale paint exterior siding — Enhances curb appeal ↑
- Resale replace carpet in living areas — Fresh carpet improves aesthetics ↑
- Resale replace carpet in kitchen — Fresh carpet improves aesthetics ↑
- Resale paint interior walls — Fresh paint improves aesthetics ↑
- Resale landscaping — Improved landscaping enhances curb appeal ↑
ⓘ Cost ranges are severity-bucket heuristics (US national rule-of-thumb). Get contractor quotes + a written scope before underwriting a rehab budget.
Schools (NCES district)
- District
- Harford County Public Schools
- NCES district ID
- 2400390
- Math proficiency
- 22% ▼ -23.00%
- Reading proficiency
- 39% ▼ -12.00%
- Median HH income
- $79,569
- Composite
- 29.38/100
- National rank
- #6527
- State rank
- #9 of 24 in MD
Livability — Aberdeen
- Score
- 81/100
- State rank
- #42
- US rank
- #1545
Category grades
Schools grade is shown separately in the Schools card above.
Census & demographics
- Census place
- Aberdeen, MD
- County
- Harford County · 198,512 people
- City population
- 27,168
- Metro
- Baltimore-Columbia-Towson, MD
- Population (ZIP)
- 27,168
- Household income
- $83,238
- Rent vs Own
- Severe rent burden
- 736.0
Population outlook (Harford County) Hauer SSP2
- Today (2025)
- 262,292 people
- By 2030
- 266,437 · +1.6%
- By 2040
- 269,954 · +2.9%
- By 2050
- 265,659 · +1.3%
- By 2075
- 252,886 · -3.6%
- By 2100
- 224,014 · -14.6%
Race, ethnicity, and origin ACS 2023
- Neighborhood character
- Diverse neighborhood (Simpson 0.62)
- Race & ethnicity
- White 54% Black 28% Hispanic / Latino 9% Two or more races 9% Asian 3%
- Hispanic origin (detail)
- Mexican 3% Puerto Rican 2% Dominican 1%
- Common ancestry
- Romanian 3% Slovak 1% Scotch-Irish 1%
- Foreign-born
- 8% · Canada, China, South Korea
- Languages at home
- 89% English-only · Spanish 4% Other Indo-European 1% German/W. Germanic 1%
Political lean MEDSL · Harford
- 2024 margin
- R (+13.8) · D 41.9% · R 55.7% · Other 2.4%
- 2008→2024 swing
- +5.0pp toward D · 2008: -18.8pp · 2024: -13.8pp
- All cycles
- 2024: R+13.8 2020: R+12.0 2016: R+24.5 2012: R+19.5 2008: R+18.8
Not yet ingested
- Civics
- —
Market trends
- HPI YoY
- ▼ -108.65%
- Current HPI
- 247.668
- Rent YoY
- ▲ 0.28%
- Metro
- Baltimore-Columbia-Towson, MD
- State GDP YoY
- ▲ 2.97%
- F500 in state
- 12
Industry mix (Fortune 500 HQ in MD)
| Industry | F500 HQs | Revenue |
|---|---|---|
| Aerospace / Defense | 1 | $71B |
|
||
| Utilities | 1 | $25B |
|
||
| Hotels | 1 | $24B |
|
||
| Consumer Goods | 1 | $7B |
|
||
| Real Estate | 1 | $6B |
|
||
| Chemicals | 1 | $2B |
|
||
Price history
1 event — show timeline
- 2026-01-26 Listed $75,000 BRIGHT MLS
Cash-flow waterfall
monthlySold comps — $/sqft
last 12 mo · ≤1 miLoading sold comps…