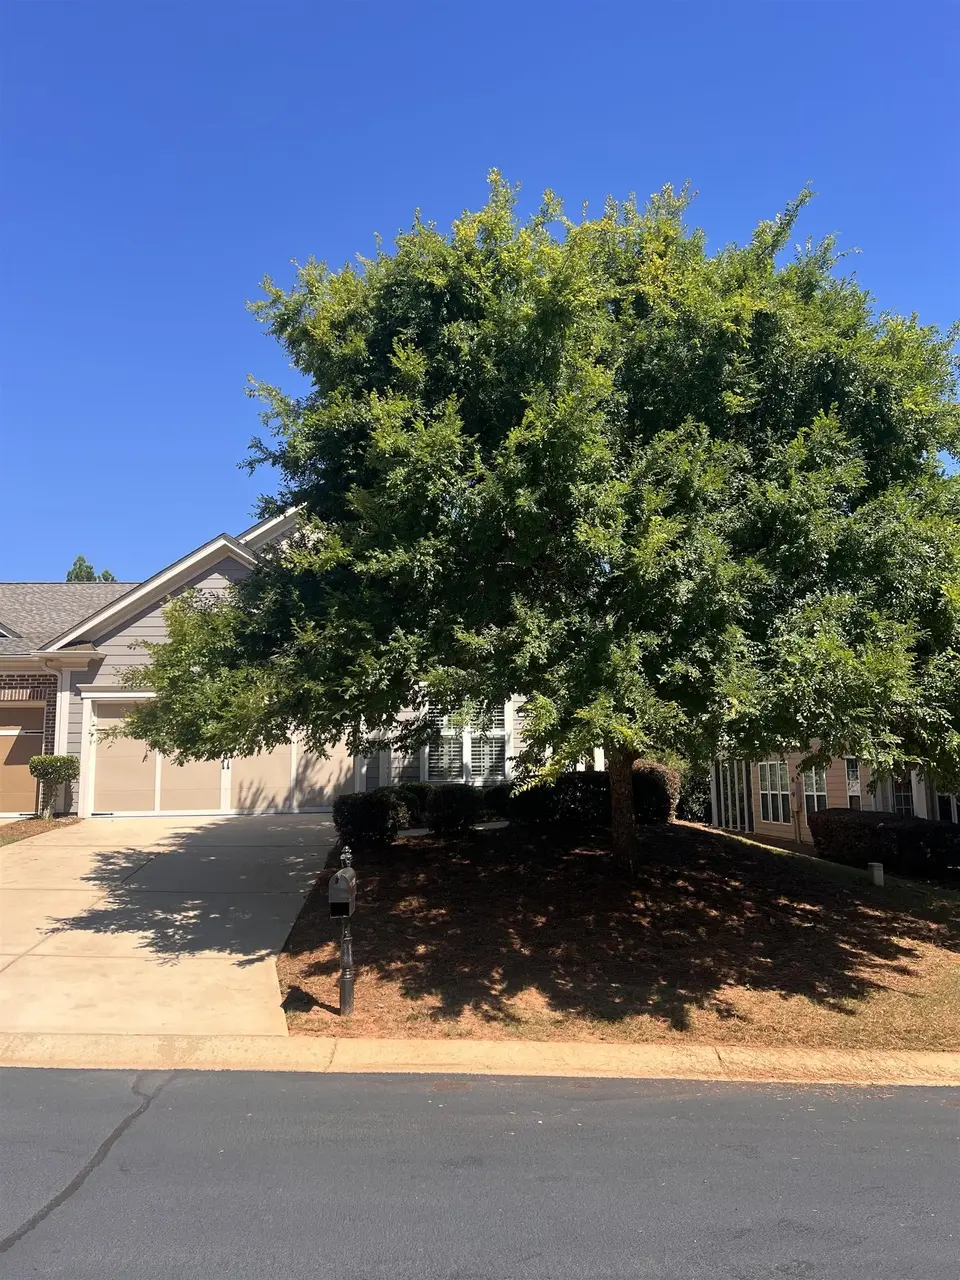
1100 Summer Station St · Greensboro, GA
Flood risk 1/10 · Minimal
- FEMA flood zone
- X (unshaded)
- Chance of flooding over 30 yrs
- 0.0%
- Est. flood insurance / yr
- $473 – $860
Fire risk 3/10 · Minor
- Est. fire insurance / yr
- $963 – $1,789
Heat risk 7/10 · Major
- Hot days now (above 107°F)
- 7 days/yr
- Hot days in 30 yrs
- 19 days/yr
Wind risk 6/10 · Moderate
- Chance of severe wind over 30 yrs
- 35.0%
Air-quality risk 3/10 · Minor
- Unhealthy air days now
- 3 days/yr
- Unhealthy air days in 30 yrs
- 3 days/yr
Risk factors via First Street. Map © Google.
Why this score? — see what drove the C+ grade
The composite is a weighted blend of 9 inputs, each scored 0–100. Each bar is that input's sub-score; the figure is the points it added to the 100-point composite (weight × sub-score).
- Cash flow +30.0/30.0
- DSCR +10.0/10.0
- 1% rule +7.3/10.0
- ARV discount +6.0/15.0
- Livability +3.2/5.0
- Schools +2.7/10.0
- Rent growth +2.5/5.0
- Condition / age +2.5/5.0
- Appreciation +0.0/10.0
$325,000
🖨 Deal sheet 📄 Offer letter ✓ Due diligence
Listing remarks MLS
Professionally decorated: Plantation Shutters throughout, Custom Built-in Book Shelves that surround an electric fireplace & spot for the TV, Custom Master Bedroom Closet with Custom Door to the closet, Ceiling Fans in most rooms, Glass Opening to the Office. Then the covered porch was turned into a screened porch with the new easy breezy windows so it can be used year round & then a larger stamped concrete patio was poured to create a charming oasis. Includes: Washer & Dryer, Range, Refrigerator! Plus the golf cart can be purchased separately for $1500. Truly charming & practical & in Del Webb where there are fun activities, great amenities, & no more lawn care!
Key facts
- 1,742 sq ft lot
- 2 garage spots
- Community pool
Property features AI
Finance
- HOA & community: Gated community; Clubhouse; Community pool; Tennis courts
Exterior
- Parking: Attached 2-car garage
- Home design: Single-family residence; One-story; Residential zoning
- Construction: Slab foundation
- Exterior features: Lake privileges; Level lot
Interior
- Kitchen: Microwave; Cooktop; Dishwasher; Refrigerator; Freezer
- Bathrooms: 2 full bathrooms
- Heating & cooling: Heat pump and central heating; Central air conditioning
- Interior features: Pantry
- Laundry & utility: Dryer
Neighborhood map
What this means for you Summary
Snapshot
- This is a 2-bed/2.5-bath single-family listed at $325k.
Deal economics
- At list price, monthly cash flow is $1k ($15k/yr) — positive.
- The deal already cash-flows at list — no discount required.
- Meets the 1% rule at list price ($4k rent vs $325k).
- Cap rate 10.8% vs local median 1.0% in Greensboro — top-decile yield for the area; either an underpriced asset or a hidden risk that comps aren't pricing in. Stress-test before assuming the spread holds.
Location & tenants
- Location reads 64/100 on livability (#272 in GA) — a middle-class / working-renter tenant base. Strengths: cost of living A+, housing A+, crime B+; Watch: schools F, amenities F, commute F.
- Greene County (rural): math 27% / reading 37% proficiency, ranked #82 of 174 in GA (top 47%) — families likely to look elsewhere, expect single-tenant / working-renter base with shorter leases; 64% free/reduced lunch — lower-income household profile, screen leases tightly.
- Market conditions: 505 active listings in the ZIP; 1 comparable units currently listed for rent nearby; 295 units permitted in Greene County in 2024 (0 in 5+ unit buildings).
Forward outlook
- Local home prices are declining (-3.0%/yr); year-one equity from $2k of loan paydown is wiped out by about $10k of value loss. Plan a longer hold.
- Greene County population projected at +5% by 2050 — modest demand growth; plan on rents tracking national, not racing it.
- At projected returns (-3.0% appreciation + 3.0% rent growth), your $91k cash investment doubles in ~8 years — after that, you're playing with house money.
Negotiation context
- Only 8 days on market — expect competitive offers; lowballing is unlikely to land.
- Current owner paid $215k; list at $325k implies a 51% gain — meaningful room to come down on a strong offer.
Risks & watch-outs
- Climate carrying-cost: major wind risk, 35% chance of damaging wind over 30y; extreme-heat days projected 7→19/yr by 2055 (HVAC capex compounding) — expect insurance premiums to compound above CPI over the hold.
Questions for the listing agent
- Is there a deadline driving the sale (1031 exchange, divorce, estate, relocation)? That informs how much negotiation room exists.
- Schools are F-rated, which usually means shorter tenancies and higher turnover. Who's the typical renter profile here, and what's been the actual vacancy rate?
- What's the average days-on-market for RENTAL listings here right now (not sales)? A rising rental-DOM trend means longer vacancies and softer asking-rent achievability than the comps imply.
- What's the recent tenant-quality profile in this submarket — average credit score on applications, eviction rate, late-payment / NSF rate, and stable-employment percentage? A property-management company in the area should have these aggregated.
- How much new for-sale + rental construction is in the pipeline within 1–3 miles? Heavy new supply typically softens prices + rents 12–24 months out; constrained supply supports both.
Investment metrics
- 1% rule
- 1.23% ✓
- Cap rate
- 10.84%
- Cash-on-cash
- 16.22%
- DSCR
- 1.72
- GRM
- 6.8
CMA / ARV
- ARV (on-the-fly)
- $314,496
- Comps found
- 12
Show comp detail 12 sales within ~0.75 mi
| Address | Dist | Beds/Ba | Sqft | Sold | Price | $/sf | Match |
|---|---|---|---|---|---|---|---|
| 1041 Flat Rock St | 0.05mi | 2/2.0 | 1,342 (-0%) | 2mo | $326,500 | $243 | 94 |
| 1031 Flat Rock St | 0.05mi | 2/2.0 | 1,325 (-1%) | 2mo | $335,000 | $253 | 92 |
| 1090 Summer Station St | 0.01mi | 2/2.0 | 1,344 (0%) | 9mo | $314,900 | $234 | 90 |
| 1041 Summer Station St | 0.06mi | 2/2.0 | 1,309 (-3%) | 8mo | $322,500 | $246 | 84 |
| 1211 Summer Hollow Rd | 0.08mi | 2/2.0 | 1,342 (-0%) | 14mo | $310,000 | $231 | 82 |
| 1270 Summer Hollow Rd | 0.08mi | 2/2.0 | 1,282 (-5%) | 7mo | $314,650 | $245 | 81 |
| 1001 Summer Station St | 0.09mi | 2/2.0 | 1,397 (+4%) | 12mo | $315,000 | $225 | 77 |
| 1200 Flat Rock St | 0.13mi | 2/2.0 | 1,382 (+3%) | 14mo | $310,000 | $224 | 75 |
| 1201 Summer Hollow Rd | 0.09mi | 2/2.0 | 1,438 (+7%) | 9mo | $296,000 | $206 | 75 |
| 1150 Summer Hollow Rd | 0.13mi | 2/2.0 | 1,473 (+10%) | 16mo | $317,500 | $216 | 62 |
| 1230 Flat Rock St | 0.16mi | 2/2.0 | 1,540 (+15%) | 14mo | $336,000 | $218 | 55 |
| 1031 Eight Knot Ct | 0.54mi | 2/2.0 | 1,422 (+6%) | 14mo | $390,000 | $274 | 52 |
Match score weights: distance 35% · size 25% · config 20% · recency 20%. Top-matched comps best support the ARV.
Projected returns pro-forma
-3.0% appreciation · 3.0% rent growth · sell at horizon
- IRR
- 7.2%
- Equity multiple
- 1.28×
- Total profit
- $25,558
- Equity at exit
- $48,459
- IRR
- 16.5%
- Equity multiple
- 2.35×
- Total profit
- $122,607
- Equity at exit
- $28,100
Cash invested: $91,000 (down + closing). Projections, not guarantees.
Landlord ↔ Tenant lean methodology
- Overall (STATE)
- 90 Strongly Landlord-Friendly
- State Georgia
- 90 Strongly Landlord-Friendly · R+3
- County
- — inherits STATE
- City
- — inherits STATE
ZIP-level market 30642
- Active inventory
- 505
- Price-to-rent
- 6.8×
Monthly cashflow live
- Estimated rent
- $4,000 medium interval (Pro) →
- Mortgage (P&I)
- −$1,704
- Tax from tax record
- −$90 /mo · $1,080/yr
- Insurance
- −$135
- HOA
- −$0
- Vacancy / Maint / Mgmt
- −$840
- Net cashflow
- $1,230
Break-even live
UW: 25.0% down · 7.5% · 30yr · 1.5% tax · 5.0% vac · 8.0% maint · 8.0% mgmt
Financing live
Cash to close
- Down payment
- $81,250
- Closing costs
- $9,750
- Reserves months
- —
- Total cash needed
- —
Loan-product check · same deal, 3 products live
Conventional
25% down · 7.5% · 30yr
- Down + closing
- —
- Monthly P&I
- —
- Monthly cashflow
- —
- DSCR
- —
- Eligible?
- —
Personal DTI + credit; lowest rate.
DSCR
20% down · 8.5% · 30yr
- Down + closing
- —
- Monthly P&I
- —
- Monthly cashflow
- —
- DSCR
- —
- Eligible?
- —
No personal income docs; deal must DSCR.
Hard money
10% down · 12.0% · 12mo
- Down + closing
- —
- Monthly P&I
- —
- Monthly cashflow
- —
- DSCR
- —
- Eligible?
- —
Short-term bridge; refi at stabilization.
Rent comps 1 comps
| Address | Beds | Baths | Sqft | Rent | $/sqft | DOM | Units | Dist |
|---|---|---|---|---|---|---|---|---|
| 1021 Leeward Run Trl Greensboro, GA | 2.0 | 2.0 | 1868 | $4,000 | $2.14 | 13d | 1 | 0.75mi |
Listing history 12 events
-
2026-06-19days on market $325,000 Active 8 DOM
-
2026-06-18days on market $325,000 Active 7 DOM
-
2026-06-17days on market $325,000 Active 6 DOM
-
2026-06-16days on market $325,000 Active 5 DOM
-
2026-06-15days on market $325,000 Active 4 DOM
-
2026-06-14days on market $325,000 Active 2 DOM
-
2026-06-13statusdays on market $325,000 Active 1 DOM
-
2026-06-10days on market $325,000 Coming Soon 6 DOM
-
2026-06-09days on market $325,000 Coming Soon 5 DOM
-
2026-06-08days on market $325,000 Coming Soon 4 DOM
-
2026-06-07remarks 699-char remark
-
2026-06-07$325,000 Coming Soon 3 DOM
ⓘ Source: listings_history table (triggers on properties + properties_extension) + one-shot
backfill from property_details.listing_events for pre-trigger history.
Tax reassessment forecast GA · Resets to sale price
- Current annual tax
- $1,080 · $90/mo
- Projected year-2 tax
- $2,990 · $249/mo
- Expected delta
- +$1,910/yr (+$159/mo · 176.9%)
ⓘ Screening estimate from a state-policy table — verify with the county assessor before closing.
Climate risk First Street
- Flood 1/10 Low FEMA zone X (unshaded) · 0% chance over 30 yrs
- Wildfire 3/10 Moderate
- Heat 7/10 Severe 7 d/yr ≥107°F today · 19 d/yr by 30 yrs out
- Wind 6/10 Major 35% chance of damaging wind over 30 yrs
- Air quality 3/10 Moderate 3 unhealthy d/yr today · 3 by 30 yrs out
Nearby sold comps map
Loading sold comps map…
Walkable amenities ~0.75 mi
Loading nearby amenities…
Taxation est. · year 1
- Rental income
- $48,000
- − Mortgage interest
- −$18,205
- − Property taxes
- −$1,080
- − Insurance
- −$1,625
- − Repairs & maintenance
- −$3,840
- − Management
- −$3,840
- − Depreciation
- −$9,455
- Taxable income
- $9,956
- Est. tax owed @ 24.0%
- −$2,389
- After-tax cash flow
- $12,374/yr
For passive investors: Depreciation is non-cash, so a rental often shows a tax loss while cash-flowing — sheltering income. Rental losses are passive: they offset passive income freely, and up to $25,000/yr can offset ordinary (W-2) income if you actively participate and your MAGI is under $100k (phasing out to $0 by $150k); unused losses carry forward. On sale, claimed depreciation is recaptured at up to 25%, and gains may owe capital-gains tax (a 1031 exchange can defer both). Figures are a year-1 estimate at your 24.0% rate — not tax advice; consult a CPA.
Schools (NCES district)
- District
- Greene County
- NCES district ID
- 1302490
- Math proficiency
- 27% ▼ -8.00%
- Reading proficiency
- 37% ▼ -5.00%
- Median HH income
- $42,172
- Composite
- 27.08/100
- National rank
- #7046
- State rank
- #82 of 174 in GA
Livability — Greensboro
- Score
- 64/100
- State rank
- #272
- US rank
- #14726
Category grades
Schools grade is shown separately in the Schools card above.
Census & demographics
- Population (ZIP)
- 14,884
Population outlook (Greene County) Hauer SSP2
- Today (2025)
- 17,835 people
- By 2030
- 18,182 · +1.9%
- By 2040
- 18,509 · +3.8%
- By 2050
- 18,794 · +5.4%
- By 2075
- 19,704 · +10.5%
- By 2100
- 20,584 · +15.4%
Race, ethnicity, and origin ACS 2023
- Neighborhood character
- Majority White (64%)
- Race & ethnicity
- White 64% Black 26% Hispanic / Latino 7% Two or more races 4%
- Hispanic origin (detail)
- Mexican 2% Puerto Rican 1%
- Common ancestry
- Italian 2% Serbian 2% Slovak 2%
- Foreign-born
- 3% · Canada
- Languages at home
- 95% English-only · Spanish 3% Other Indo-European 1%
Political lean MEDSL · Greene
- 2024 margin
- Strong R (+28.9) · D 35.3% · R 64.2%
- 2008→2024 swing
- -13.9pp toward R · 2008: -15.1pp · 2024: -28.9pp
- All cycles
- 2024: R+28.9 2020: R+26.5 2016: R+26.0 2012: R+22.5 2008: R+15.1
Not yet ingested
- Civics
- —
Market trends
- HPI YoY
- ▼ -114.13%
- Current HPI
- 186.3442
- Rent YoY
- —
- Metro
- —
- State GDP YoY
- ▲ 2.66%
- F500 in state
- 28
Industry mix (Fortune 500 HQ in GA)
| Industry | F500 HQs | Revenue |
|---|---|---|
| Paper / Packaging | 2 | $29B |
|
||
| Retail | 1 | $160B |
|
||
| Transportation / Logistics | 1 | $91B |
|
||
| Airlines | 1 | $62B |
|
||
| Consumer Goods | 1 | $47B |
|
||
| Utilities | 1 | $25B |
|
||
Price history
+46.4% since first listed4 events — show timeline
- 2026-06-04 Coming Soon $325,000 LCBR
- 2016-10-24 Sold (Public Records) $214,800 Public Records
- 2016-10-20 Sold (MLS) $214,800 LCBR
- 2016-09-15 Listed $222,000 LCBR
Property tax history
+21.0%/yrLatest (2025): $1,080 · -2.4% YoY. Source: county tax records.
Cash-flow waterfall
monthlySold comps — $/sqft
last 12 mo · ≤1 miLoading sold comps…