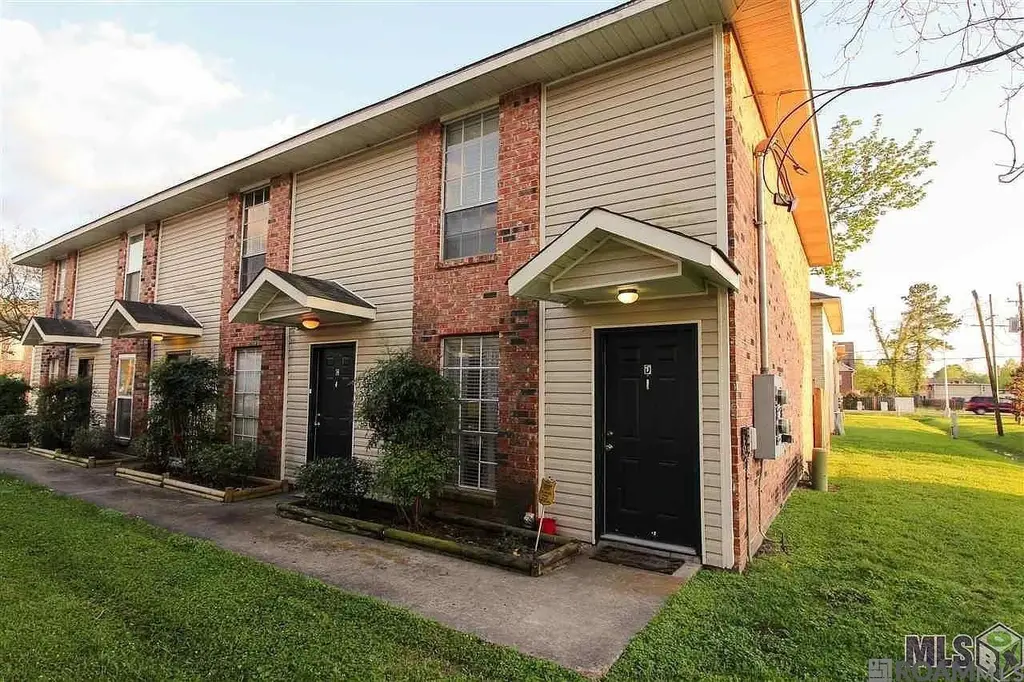
1734 Brightside Dr Unit 1734D · Baton Rouge, LA
Flood risk 1/10 · Minimal
- FEMA flood zone
- X
- Chance of flooding over 30 yrs
- 0.0%
- Est. flood insurance / yr
- $507 – $1,088
Fire risk 1/10 · Minimal
- Est. fire insurance / yr
- $1,269 – $2,357
Heat risk 8/10 · Major
- Hot days now (above 108°F)
- 7 days/yr
- Hot days in 30 yrs
- 22 days/yr
Wind risk 9/10 · Severe
- Chance of severe wind over 30 yrs
- 99.0%
Air-quality risk 2/10 · Minimal
- Unhealthy air days now
- 1 days/yr
- Unhealthy air days in 30 yrs
- 1 days/yr
Risk factors via First Street. Map © Google.
Why this score? — see what drove the C+ grade
The composite is a weighted blend of 9 inputs, each scored 0–100. Each bar is that input's sub-score; the figure is the points it added to the 100-point composite (weight × sub-score).
- Cash flow +22.8/30.0
- 1% rule +9.7/10.0
- ARV discount +7.5/15.0
- DSCR +7.3/10.0
- Condition / age +4.0/5.0
- Livability +3.7/5.0
- Rent growth +3.2/5.0
- Schools +2.4/10.0
- Appreciation +0.0/10.0
$93,500
🖨 Deal sheet 📄 Offer letter ✓ Due diligence
Listing remarks MLS
Tenants will be moving out at the end of June. AC unit was replaced 2023, Carpet and upstairs repainted 2025, New roof 2026, New dishwasher 2025. All appliances remain.
Key facts
- $275 HOA
- 2 parking spots
- Built 1988
Property features AI
Finance
- HOA & community: Homeowners association with professional management; Annual association fee of $3,300 (approximately $275/month); HOA covers grounds maintenance, insurance, sewer, trash, and water
Exterior
- Parking: Assigned parking (2 spaces)
- Security: Smoke detectors
- Utilities: Public water; Public sewer; Cable connected
- Home design: Residential condominium; Attached property; Suitable for multi-family use
- Construction: Frame and brick construction; Slab foundation
- Exterior features: Patio; Fenced yard (full); Exterior lighting; Shingle roof
Interior
- Kitchen: Range; Oven; Electric cooktop; Dishwasher; Microwave; Refrigerator
- Flooring: Tile; Carpet; Ceramic tile
- Bathrooms: 1 full bathroom; 1 half bathroom
- Heating & cooling: Central heating; Central air conditioning
- Interior features: Walk-in closets; Interior lighting
- Laundry & utility: Washer hookup inside; Electric dryer hookup
Neighborhood map
What this means for you Summary
Snapshot
- This is a 2-bed/1.5-bath condo listed at $94k. Condition is rated good.
Deal economics
- At list price, monthly cash flow is $163 ($2k/yr) — positive.
- The deal already cash-flows at list — no discount required.
- Meets the 1% rule at list price ($1k rent vs $94k).
- Cap rate 8.4% vs local median 4.3% in Baton Rouge — top-decile yield for the area; either an underpriced asset or a hidden risk that comps aren't pricing in. Stress-test before assuming the spread holds.
Location & tenants
- Location reads 74/100 on livability (#24 in LA, #4,535 nationally) — a middle-class / working-renter tenant base. Strengths: commute A+, cost of living A+, health & safety A+; Watch: amenities D, crime F, employment D-.
- East Baton Rouge Parish (urban): math 22% / reading 34% proficiency, ranked #47 of 98 in LA (top 48%) — low school quality limits family demand, transient renter base, plan for 1-2y turnover; 77% free/reduced lunch — lower-income household profile, screen leases tightly.
- Market conditions: Rents rising (+2.8%/yr); 315 active listings in the ZIP; 40 comparable units currently listed for rent nearby; rentals at typical pace (median 23d on market — plan ~3-4 weeks tenant-placement turnaround); 42% of comp listings sitting > 30 days — soft ceiling on asking rent; 2,252 units permitted in East Baton Rouge Parish in 2024 (440 in 5+ unit buildings).
- This rent runs 35% of the median local income ($47k/yr) — at the standard rent-burdened threshold; future hikes will face affordability resistance.
Forward outlook
- Local home prices are declining (-3.0%/yr); year-one equity from $646 of loan paydown is wiped out by about $3k of value loss. Plan a longer hold.
- East Baton Rouge County population projected at +4% by 2050 — modest demand growth; plan on rents tracking national, not racing it.
Negotiation context
- Only 13 days on market — expect competitive offers; lowballing is unlikely to land.
Risks & watch-outs
- Watch-outs: HOA is 20% of rent.
- Climate carrying-cost: severe wind risk, 99% chance of damaging wind over 30y; extreme-heat days projected 7→22/yr by 2055 (HVAC capex compounding) — expect insurance premiums to compound above CPI over the hold.
Questions for the listing agent
- What does the HOA fee cover, when was the last increase, and are there any pending special assessments or reserve-fund shortfalls?
- Any open or pending special assessments — roof, HVAC, plumbing, elevator, façade? What's the per-unit balance and payoff schedule, and is the seller paying it off at close or rolling it to the buyer?
- Is there a deadline driving the sale (1031 exchange, divorce, estate, relocation)? That informs how much negotiation room exists.
- Crime grade is F in this area — have there been break-ins, vandalism, or insurance claims at this property in the last 3 years? What carrier currently insures it and at what premium?
- What's the average days-on-market for RENTAL listings here right now (not sales)? A rising rental-DOM trend means longer vacancies and softer asking-rent achievability than the comps imply.
- What's the recent tenant-quality profile in this submarket — average credit score on applications, eviction rate, late-payment / NSF rate, and stable-employment percentage? A property-management company in the area should have these aggregated.
- How much new apartment / multifamily construction is in the pipeline within 1–3 miles? Heavy new supply (>2% of stock underway) typically softens rents 12–24 months out; light construction supports rent growth.
Investment metrics
- 1% rule
- 1.47% ✓
- Cap rate
- 8.38%
- Cash-on-cash
- 7.46%
- DSCR
- 1.33
- GRM
- 5.7
CMA / ARV
No comps found within radius.
Projected returns pro-forma
-3.0% appreciation · 2.79% rent growth · sell at horizon
- IRR
- -5.0%
- Equity multiple
- 0.81×
- Total profit
- $-4,880
- Equity at exit
- $13,941
- IRR
- 4.6%
- Equity multiple
- 1.33×
- Total profit
- $8,692
- Equity at exit
- $8,084
Cash invested: $26,180 (down + closing). Projections, not guarantees.
Landlord ↔ Tenant lean methodology
- Overall (STATE)
- 90 Strongly Landlord-Friendly
- State Louisiana
- 90 Strongly Landlord-Friendly · R+12
- County
- — inherits STATE
- City
- — inherits STATE
ZIP-level market 70820
- Home prices YoY
- -29.9%
- Rents YoY
- 2.8%
- Active inventory
- 315
- Price-to-rent
- 5.7×
Monthly cashflow live
- Estimated rent
- $1,372 high interval (Pro) →
- Mortgage (P&I)
- −$490
- Tax est. 1.5%
- −$117 /mo · $1,402/yr
- Insurance
- −$39
- HOA
- −$275
- Vacancy / Maint / Mgmt
- −$288
- Net cashflow
- $163
Break-even live
UW: 25.0% down · 7.5% · 30yr · 1.5% tax · 5.0% vac · 8.0% maint · 8.0% mgmt
Financing live
Cash to close
- Down payment
- $23,375
- Closing costs
- $2,805
- Reserves months
- —
- Total cash needed
- —
Loan-product check · same deal, 3 products live
Conventional
25% down · 7.5% · 30yr
- Down + closing
- —
- Monthly P&I
- —
- Monthly cashflow
- —
- DSCR
- —
- Eligible?
- —
Personal DTI + credit; lowest rate.
DSCR
20% down · 8.5% · 30yr
- Down + closing
- —
- Monthly P&I
- —
- Monthly cashflow
- —
- DSCR
- —
- Eligible?
- —
No personal income docs; deal must DSCR.
Hard money
10% down · 12.0% · 12mo
- Down + closing
- —
- Monthly P&I
- —
- Monthly cashflow
- —
- DSCR
- —
- Eligible?
- —
Short-term bridge; refi at stabilization.
Rent comps 40 comps
| Address | Beds | Baths | Sqft | Rent | $/sqft | DOM | Units | Dist |
|---|---|---|---|---|---|---|---|---|
| 1704 Brightside Dr Unit C Baton Rouge, LA | 2.0 | 2.0 | 1088 | $1,175 | $1.08 | 21d | 1 | 0.04mi |
| 1714 Brightside Dr Unit A Baton Rouge, LA | 2.0 | 1.5 | 1050 | $1,025 | $0.98 | 43d | 1 | 0.06mi |
| 1724 Brightside Dr Apt A Baton Rouge, LA | 2.0 | 1.5 | 1050 | $1,025 | $0.98 | 23d | 1 | 0.07mi |
| 1855 Brightside Dr Unit 3BR 15 BA Baton Rouge, LA | 3.0 | 1.5 | 820 | $1,095 | $1.34 | 43d | 1 | 0.08mi |
| 1741 Brightside Dr Baton Rouge, LA | 2.0–3.0 | 2.0 | 1436 | $1,500 | $1.04 | 14d | 3 | 0.10mi |
| 1855 Brightside Dr Baton Rouge, LA | 2.0 | 1.0 | 820 | $995 | $1.21 | 43d | 1 | 0.11mi |
| 2000 Brightside Dr Baton Rouge, LA | 1.0–3.0 | 1.0–2.0 | 792 | $1,252 | $1.58 | 14d | 1 | 0.18mi |
| 1835 S Brightside View Dr Unit C Baton Rouge, LA | 2.0 | 2.5 | 1250 | $1,375 | $1.10 | 23d | 1 | 0.21mi |
| 5124 Brightside View Dr #4 Baton Rouge, LA | 2.0 | 1.0 | 1000 | $875 | $0.88 | 43d | 1 | 0.22mi |
| 5124 Brightside View Dr #3 Baton Rouge, LA | 2.0 | 1.5 | 1000 | $875 | $0.88 | 43d | 1 | 0.22mi |
| 5124 Brightside View Dr #4 Baton Rouge, LA | 2.0 | 1.5 | 1000 | $999 | $1.00 | 23d | 1 | 0.22mi |
| 2073 Brightside Dr Baton Rouge, LA | 2.0 | 2.0 | 1100 | $1,200 | $1.09 | 23d | 1 | 0.23mi |
| 1953 S Brightside View Dr Unit B Baton Rouge, LA | 2.0 | 2.5 | 1218 | $1,300 | $1.07 | 14d | 1 | 0.24mi |
| 5268 S Brightside View Dr Apt 2 Baton Rouge, LA | 3.0 | 2.5 | 1348 | $1,250 | $0.93 | 43d | 1 | 0.25mi |
| 1983 S Brightside View Dr Unit C Baton Rouge, LA | 2.0 | 2.5 | 1124 | $1,195 | $1.06 | 43d | 1 | 0.25mi |
| 1983 S Brightside View Dr Baton Rouge, LA | 2.0 | 2.0 | 1270 | $1,100 | $0.87 | 21d | 1 | 0.25mi |
| 2021 S Brightside View Dr Unit C Baton Rouge, LA | 2.0 | 2.5 | 1250 | $1,250 | $1.00 | 43d | 1 | 0.28mi |
| 2173 Plantation Ln Baton Rouge, LA | 2.0 | 2.0 | 1374 | $1,200 | $0.87 | 21d | 1 | 0.36mi |
| 5107 Nicholson Dr Unit A30 Baton Rouge, LA | 2.0 | 2.0 | 1365 | $1,350 | $0.99 | 23d | 1 | 0.41mi |
| 5107 Nicholson Dr Unit A31 Baton Rouge, LA | 1.0 | 1.0 | 741 | $1,050 | $1.42 | 43d | 1 | 0.41mi |
| 2452 Brightside Dr Baton Rouge, LA | 2.0 | 2.0 | 1246 | $1,600 | $1.28 | 14d | 1 | 0.44mi |
| 900 Dean Lee Dr Baton Rouge, LA | 2.0–3.0 | 2.0–3.0 | 1585 | $1,300 | $0.82 | 43d | 3 | 0.44mi |
| 900 Dean Lee Dr Baton Rouge, LA | 2.0–3.0 | 2.0–3.0 | 1585 | $1,550 | $0.98 | 23d | 3 | 0.44mi |
| 4554 Y A Tittle Ave Unit B Baton Rouge, LA | 2.0 | 1.0 | 800 | $850 | $1.06 | 43d | 1 | 0.45mi |
| 4554 Y A Tittle Ave Baton Rouge, LA | 2.0 | 1.0 | 800 | $800 | $1.00 | 43d | 1 | 0.45mi |
| 4554 Y A Tittle Ave #2 Baton Rouge, LA | 2.0 | 1.0 | 900 | $825 | $0.92 | 14d | 1 | 0.45mi |
| 4521 Y a Tittle Ave Baton Rouge, LA | 3.0 | 2.0 | 1300 | $1,150 | $0.88 | 14d | 1 | 0.49mi |
| 4445 Alvin Dark Ave Baton Rouge, LA | 1.0–3.0 | 1.0–3.0 | 869 | $1,003 | $1.15 | 14d | 14 | 0.49mi |
| 4606 Y a Tittle Ave Baton Rouge, LA | 2.0 | 1.0 | 770 | $975 | $1.27 | 14d | 1 | 0.49mi |
| 1345 Harwich Dr Baton Rouge, LA | 3.0 | 2.0 | 1478 | $1,800 | $1.22 | 43d | 1 | 0.53mi |
| 5157 Etta St Unit 4G Baton Rouge, LA | 3.0 | 2.0 | 1473 | $1,650 | $1.12 | 43d | 1 | 0.56mi |
| 839 E Boyd Dr Unit C Baton Rouge, LA | 2.0 | 1.5 | 1080 | $1,400 | $1.30 | 18d | 1 | 0.69mi |
| 837 E Boyd Dr Unit A Baton Rouge, LA | 2.0 | 1.5 | 1080 | $1,300 | $1.20 | 18d | 1 | 0.69mi |
| 582 Jennifer Jean Dr Baton Rouge, LA | 3.0 | 2.0 | 1370 | $1,500 | $1.09 | 43d | 1 | 0.82mi |
| 4441 Burbank Dr #108 Baton Rouge, LA | 3.0 | 3.0 | 1500 | $1,725 | $1.15 | 23d | 1 | 0.87mi |
| 4441 Burbank Dr Baton Rouge, LA | 3.0 | 2.0–3.0 | 1544 | $1,750 | $1.13 | 43d | 2 | 0.90mi |
| 436 Jennifer Jean Dr Baton Rouge, LA | 3.0 | 2.0 | 1100 | $1,950 | $1.77 | 23d | 1 | 0.91mi |
| 436 Jennifer Jean Dr Baton Rouge, LA | 3.0 | 2.0 | 1100 | $1,950 | $1.77 | 14d | 1 | 0.91mi |
| 4464 Highland Rd Baton Rouge, LA | 2.0 | 2.0 | 1219 | $1,675 | $1.37 | 43d | 1 | 1.04mi |
| 5116 Highland Rd Baton Rouge, LA | 2.0 | 1.0–2.0 | 771 | $1,021 | $1.32 | 14d | 39 | 1.05mi |
HOA detail condo
- Monthly dues
- $275 · $3,300/yr
- Assessments
- None detected in remarks — confirm with the listing agent.
Listing history 10 events
-
2026-06-18days on market $93,500 Coming Soon 13 DOM
-
2026-06-17days on market $93,500 Coming Soon 12 DOM
-
2026-06-16days on market $93,500 Coming Soon 11 DOM
-
2026-06-15days on market $93,500 Coming Soon 10 DOM
-
2026-06-14days on market $93,500 Coming Soon 8 DOM
-
2026-06-10days on market $93,500 Coming Soon 5 DOM
-
2026-06-09days on market $93,500 Coming Soon 4 DOM
-
2026-06-08days on market $93,500 Coming Soon 3 DOM
-
2026-06-07remarks 168-char remark
-
2026-06-07$93,500 Coming Soon 2 DOM
ⓘ Source: listings_history table (triggers on properties + properties_extension) + one-shot
backfill from property_details.listing_events for pre-trigger history.
Climate risk First Street
- Flood 1/10 Low FEMA zone X · 0% chance over 30 yrs
- Wildfire 1/10 Low
- Heat 8/10 Severe 7 d/yr ≥108°F today · 22 d/yr by 30 yrs out
- Wind 9/10 Extreme 99% chance of damaging wind over 30 yrs
- Air quality 2/10 Low 1 unhealthy d/yr today · 1 by 30 yrs out
Nearby sold comps map
Loading sold comps map…
Walkable amenities ~0.75 mi
Loading nearby amenities…
Taxation est. · year 1
- Rental income
- $16,466
- − Mortgage interest
- −$5,237
- − Property taxes
- −$1,402
- − Insurance
- −$468
- − Repairs & maintenance
- −$1,317
- − Management
- −$1,317
- − HOA
- −$3,300
- − Depreciation
- −$2,720
- Taxable income
- $704
- Est. tax owed @ 24.0%
- −$169
- After-tax cash flow
- $1,785/yr
For passive investors: Depreciation is non-cash, so a rental often shows a tax loss while cash-flowing — sheltering income. Rental losses are passive: they offset passive income freely, and up to $25,000/yr can offset ordinary (W-2) income if you actively participate and your MAGI is under $100k (phasing out to $0 by $150k); unused losses carry forward. On sale, claimed depreciation is recaptured at up to 25%, and gains may owe capital-gains tax (a 1031 exchange can defer both). Figures are a year-1 estimate at your 24.0% rate — not tax advice; consult a CPA.
Condition & rehab AI · 2 photos
This condo is in good condition with recent updates, including a new roof and AC, making it a solid investment with minimal work needed.
Value-add opportunities
- Both Paint touch-ups — Fresh paint enhances curb appeal and interior aesthetics
- Both Landscaping — Well-maintained landscaping improves curb appeal and property value
- Both Interior cleaning — A clean interior enhances the home's appeal and can attract more tenants
Renovation cost estimate screening
Value-add ROI direction
- Both Paint touch-ups — Fresh paint enhances curb appeal and interior aesthetics ↑
- Both Landscaping — Well-maintained landscaping improves curb appeal and property value ↑
- Both Interior cleaning — A clean interior enhances the home's appeal and can attract more tenants ↑
ⓘ Cost ranges are severity-bucket heuristics (US national rule-of-thumb). Get contractor quotes + a written scope before underwriting a rehab budget.
Schools (NCES district)
- District
- East Baton Rouge Parish
- NCES district ID
- 2200540
- Math proficiency
- 22% ▼ -36.00%
- Reading proficiency
- 34% ▼ -31.00%
- Median HH income
- $46,263
- Composite
- 24.14/100
- National rank
- #7745
- State rank
- #47 of 98 in LA
Livability — Baton Rouge
- Score
- 74/100
- State rank
- #24
- US rank
- #4535
Category grades
Schools grade is shown separately in the Schools card above.
Census & demographics
- Census place
- Baton Rouge, LA
- County
- East Baton Rouge Parish · 399,686 people
- City population
- 351,868
- Metro
- Baton Rouge, LA
- Population (ZIP)
- 23,377
- Household income
- $47,429
- Rent vs Own
- Severe rent burden
- 1879.0
Population outlook (East Baton Rouge County) Hauer SSP2
- Today (2025)
- 464,810 people
- By 2030
- 472,137 · +1.6%
- By 2040
- 480,243 · +3.3%
- By 2050
- 484,422 · +4.2%
- By 2075
- 492,069 · +5.9%
- By 2100
- 476,347 · +2.5%
Race, ethnicity, and origin ACS 2023
- Neighborhood character
- Diverse neighborhood (Simpson 0.63)
- Race & ethnicity
- White 56% Black 21% Hispanic / Latino 13% Asian 7% Two or more races 5% Native American 2%
- Hispanic origin (detail)
- Mexican 3%
- Common ancestry
- Lithuanian 7% Italian 2% Scotch-Irish 1%
- Foreign-born
- 13% · Canada, China, South Korea
- Languages at home
- 84% English-only · Spanish 9% Other Indo-European 3% Chinese 1%
Political lean MEDSL · East Baton Rouge
- 2024 margin
- D (+11.1) · D 54.5% · R 43.4% · Other 2.1%
- 2008→2024 swing
- +8.9pp toward D · 2008: 2.2pp · 2024: 11.1pp
- All cycles
- 2024: D+11.1 2020: D+13.1 2016: D+9.2 2012: D+5.2 2008: D+2.2
Not yet ingested
- Civics
- —
Market trends
- HPI YoY
- ▼ -56.10%
- Current HPI
- 131.5382
- Rent YoY
- ▲ 2.79%
- Metro
- Baton Rouge, LA
- State GDP YoY
- ▲ 3.29%
- F500 in state
- 10
Industry mix (Fortune 500 HQ in LA)
| Industry | F500 HQs | Revenue |
|---|---|---|
| Telecommunications | 2 | $23B |
|
||
| Utilities | 1 | $12B |
|
||
| Wholesale / Distribution | 1 | $5B |
|
||
| Advertising | 1 | $2B |
|
||
Price history
+0.0% since first listed2 events — show timeline
- 2026-06-06 Coming Soon $93,500 AcadianaMLS
- 2026-06-05 Coming Soon $93,500 GBRMLS
Cash-flow waterfall
monthlySold comps — $/sqft
last 12 mo · ≤1 miLoading sold comps…