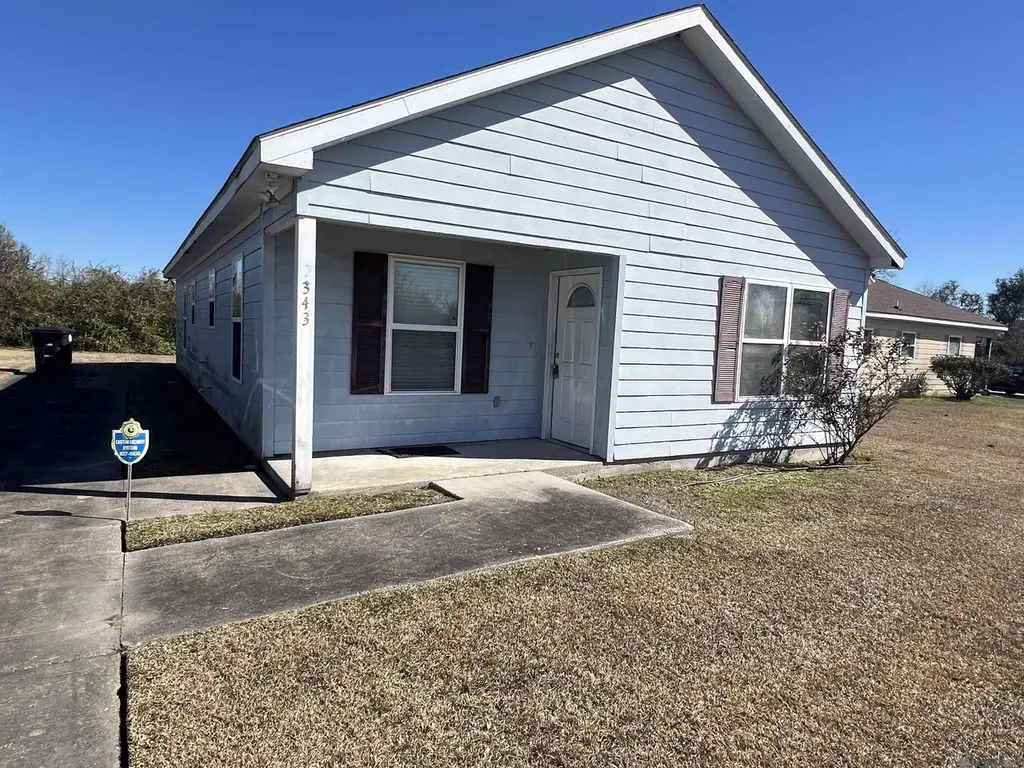
9343 Tearose Ln · Gardere, LA
Flood risk 1/10 · Minimal
- FEMA flood zone
- X
- Chance of flooding over 30 yrs
- 0.0%
- Est. flood insurance / yr
- $507 – $1,088
Fire risk 1/10 · Minimal
- Est. fire insurance / yr
- $1,269 – $2,357
Heat risk 8/10 · Major
- Hot days now (above 108°F)
- 7 days/yr
- Hot days in 30 yrs
- 21 days/yr
Wind risk 9/10 · Severe
- Chance of severe wind over 30 yrs
- 99.0%
Air-quality risk 2/10 · Minimal
- Unhealthy air days now
- 1 days/yr
- Unhealthy air days in 30 yrs
- 2 days/yr
Risk factors via First Street. Map © Google.
Why this score? — see what drove the C- grade
The composite is a weighted blend of 9 inputs, each scored 0–100. Each bar is that input's sub-score; the figure is the points it added to the 100-point composite (weight × sub-score).
- Cash flow +21.9/30.0
- ARV discount +9.0/15.0
- DSCR +7.0/10.0
- 1% rule +5.2/10.0
- Livability +3.2/5.0
- Rent growth +2.7/5.0
- Condition / age +2.5/5.0
- Schools +2.4/10.0
- Appreciation +0.0/10.0
$128,500
🖨 Deal sheet 📄 Offer letter ✓ Due diligence
Listing remarks MLS
Investor special or starter home opportunity in the Rosewood subdivision. Home offers a large living room and breakfast nook, an extended driveway providing ample parking and a spacious backyard; perfect for outdoor activities or future enhancements. With some repairs and TLC, this home has tremendous potential to increase in value. Whether you're an investor looking to renovate and sell, or a buyer eager to personalize your first home, this property is ideal for those ready to make improvements and add value.
Key facts
- Breakfast nook
- Spacious backyard
- Large living room
Tags
Neighborhood map
What this means for you Summary
Snapshot
- This is a 3-bed/2.0-bath single-family listed at $128k.
Deal economics
- At list price, monthly cash flow is $202 ($2k/yr) — positive.
- The deal already cash-flows at list — no discount required.
- Meets the 1% rule at list price ($1k rent vs $128k).
- Recommended offer: $117k (9.0% below list) — sets the bar for market timing.
- Cap rate 8.2% vs local median 4.1% in Gardere — top-decile yield for the area; either an underpriced asset or a hidden risk that comps aren't pricing in. Stress-test before assuming the spread holds.
Location & tenants
- Location reads 64/100 on livability (#167 in LA) — a middle-class / working-renter tenant base. Strengths: cost of living A, housing A; Watch: crime D, employment D, amenities F.
- East Baton Rouge Parish (urban): math 22% / reading 34% proficiency, ranked #47 of 98 in LA (top 48%) — low school quality limits family demand, transient renter base, plan for 1-2y turnover; 77% free/reduced lunch — lower-income household profile, screen leases tightly.
- Market conditions: Rents flat; 625 active listings in the ZIP; 40 comparable units currently listed for rent nearby; rentals lingering (median 44d on market — plan ~5-8 weeks vacancy on turnover, expect pricing pressure); 50% of comp listings sitting > 30 days — soft ceiling on asking rent; solid renter incomes; 2,252 units permitted in East Baton Rouge Parish in 2024 (440 in 5+ unit buildings).
- This rent is only 17% of the median local income ($92k/yr) — well below the 30% rent-burden line; pricing power to push rent on renewal without tenant pushback.
Forward outlook
- Local home prices are declining (-3.0%/yr); year-one equity from $888 of loan paydown is wiped out by about $4k of value loss. Plan a longer hold.
- East Baton Rouge County population projected at +4% by 2050 — modest demand growth; plan on rents tracking national, not racing it.
Negotiation context
- It's been on market 99 days — a 9% lower offer ($117k) is reasonable based on typical stale-listing flexibility.
- 2 sale attempts with the ask held roughly flat each time — persistent listings suggest the price (not the market) is what's stuck; bring a comps-based counter.
Risks & watch-outs
- Climate carrying-cost: severe wind risk, 99% chance of damaging wind over 30y; extreme-heat days projected 7→21/yr by 2055 (HVAC capex compounding) — expect insurance premiums to compound above CPI over the hold.
Questions for the listing agent
- It's been on market 99 days. Have you received any prior offers? Is the seller open to a 9% concession, seller financing, or rate buy-down credit?
- Why hasn't it sold? Are there any deal-killer items the seller is aware of (foundation, flood, title, zoning, code violations)?
- Is there a deadline driving the sale (1031 exchange, divorce, estate, relocation)? That informs how much negotiation room exists.
- Crime grade is D in this area — have there been break-ins, vandalism, or insurance claims at this property in the last 3 years? What carrier currently insures it and at what premium?
- What's the average days-on-market for RENTAL listings here right now (not sales)? A rising rental-DOM trend means longer vacancies and softer asking-rent achievability than the comps imply.
- What's the recent tenant-quality profile in this submarket — average credit score on applications, eviction rate, late-payment / NSF rate, and stable-employment percentage? A property-management company in the area should have these aggregated.
- How much new for-sale + rental construction is in the pipeline within 1–3 miles? Heavy new supply typically softens prices + rents 12–24 months out; constrained supply supports both.
Investment metrics
- 1% rule
- 1.02% ✓
- Cap rate
- 8.18%
- Cash-on-cash
- 6.73%
- DSCR
- 1.30
- GRM
- 8.2
CMA / ARV
- ARV (median comp)
- $132,877
- List price
- $128,500
- Delta
- -3.29%
- Verdict
- FAIR
- Comps
- 20 within 1.0 mi
Show comp detail 12 sales within ~0.75 mi
| Address | Dist | Beds/Ba | Sqft | Sold | Price | $/sf | Match |
|---|---|---|---|---|---|---|---|
| 2239 St Croix Ave | 0.16mi | 3/2.0 | 1,112 (-2%) | 5mo | $125,000 | $112 | 86 |
| 9390 Pascagoula Dr | 0.12mi | 3/2.0 | 1,112 (-2%) | 15mo | $125,000 | $112 | 80 |
| 2167 St Croix Ave | 0.19mi | 3/2.0 | 1,112 (-2%) | 12mo | $125,000 | $112 | 78 |
| 9351 Bimini Dr | 0.25mi | 3/2.0 | 1,112 (-2%) | 16mo | $125,000 | $112 | 72 |
| 9398 Pascagoula Dr | 0.13mi | 2/2.0 (-1) | 1,100 (-3%) | 20mo | $3,000 | $3 | 68 |
| 1832 Elvin Dr | 0.37mi | 3/2.0 | 1,112 (-2%) | 20mo | $1,400 | $1 | 64 |
| 1835 Fountain Ave | 0.68mi | 2/2.0 (-1) | 1,150 (+2%) | 1mo | $155,000 | $135 | 60 |
| 1835 General Cleburne Ave | 0.45mi | 2/1.0 (-1) | 1,105 (-2%) | 8mo | $92,000 | $83 | 60 |
| 2144 General Mouton Ave | 0.29mi | 3/2.0 | 1,210 (+7%) | 19mo | $180,000 | $149 | 59 |
| 9555 Old Hermitage Pkwy | 0.72mi | 3/2.0 | 1,200 (+6%) | 1mo | $235,000 | $196 | 55 |
| 2131 Fountain Ave | 0.69mi | 2/2.0 (-1) | 1,155 (+2%) | 19mo | $124,700 | $108 | 43 |
| 1733 General Cleburne Ave | 0.51mi | 3/2.0 | 1,294 (+15%) | 22mo | $1,600 | $1 | 34 |
Match score weights: distance 35% · size 25% · config 20% · recency 20%. Top-matched comps best support the ARV.
Projected returns pro-forma
-3.0% appreciation · 0.68% rent growth · sell at horizon
- IRR
- -8.5%
- Equity multiple
- 0.69×
- Total profit
- $-10,979
- Equity at exit
- $19,160
- IRR
- -2.2%
- Equity multiple
- 0.87×
- Total profit
- $-4,779
- Equity at exit
- $11,110
Cash invested: $35,980 (down + closing). Projections, not guarantees.
Landlord ↔ Tenant lean methodology
- Overall (STATE)
- 90 Strongly Landlord-Friendly
- State Louisiana
- 90 Strongly Landlord-Friendly · R+12
- County
- — inherits STATE
- City
- — inherits STATE
ZIP-level market 70810
- Rents YoY
- 0.7%
- Active inventory
- 625
- Price-to-rent
- 8.2×
Monthly cashflow live
- Estimated rent
- $1,309 high interval (Pro) →
- Mortgage (P&I)
- −$674
- Tax from tax record
- −$105 /mo · $1,261/yr
- Insurance
- −$54
- HOA
- −$0
- Vacancy / Maint / Mgmt
- −$275
- Net cashflow
- $202
Break-even live
UW: 25.0% down · 7.5% · 30yr · 1.5% tax · 5.0% vac · 8.0% maint · 8.0% mgmt
Financing live
Cash to close
- Down payment
- $32,125
- Closing costs
- $3,855
- Reserves months
- —
- Total cash needed
- —
Loan-product check · same deal, 3 products live
Conventional
25% down · 7.5% · 30yr
- Down + closing
- —
- Monthly P&I
- —
- Monthly cashflow
- —
- DSCR
- —
- Eligible?
- —
Personal DTI + credit; lowest rate.
DSCR
20% down · 8.5% · 30yr
- Down + closing
- —
- Monthly P&I
- —
- Monthly cashflow
- —
- DSCR
- —
- Eligible?
- —
No personal income docs; deal must DSCR.
Hard money
10% down · 12.0% · 12mo
- Down + closing
- —
- Monthly P&I
- —
- Monthly cashflow
- —
- DSCR
- —
- Eligible?
- —
Short-term bridge; refi at stabilization.
Rent comps 40 comps
| Address | Beds | Baths | Sqft | Rent | $/sqft | DOM | Units | Dist |
|---|---|---|---|---|---|---|---|---|
| 2934 Nicholson Lake Dr Baton Rouge, LA | 3.0 | 2.0 | 1500 | $2,000 | $1.33 | 43d | 1 | 0.25mi |
| 2934 Nicholson Lake Dr Baton Rouge, LA | 3.0 | 2.0 | 1500 | $2,000 | $1.33 | 23d | 1 | 0.25mi |
| 1934 Elvin Dr Baton Rouge, LA | 3.0 | 2.0 | 1112 | $1,600 | $1.44 | 43d | 1 | 0.30mi |
| 3111 Nicholson Lake Dr Baton Rouge, LA | 3.0 | 2.0 | 1468 | $2,000 | $1.36 | 21d | 1 | 0.32mi |
| 2705 Amanda Dr Unit A Baton Rouge, LA | 2.0 | 2.0 | 972 | $800 | $0.82 | 14d | 1 | 0.39mi |
| 11959 Nicholson Dr Baton Rouge, LA | 1.0–3.0 | 1.0–2.0 | 1092 | $1,678 | $1.54 | 14d | 6 | 0.46mi |
| 8526 Leake Ave Unit 8526-D Baton Rouge, LA | 2.0 | 2.0 | 974 | $900 | $0.92 | 43d | 1 | 0.48mi |
| 2182 Gardere Ln Unit B Baton Rouge, LA | 2.0 | 2.0 | 1000 | $800 | $0.80 | 23d | 1 | 0.58mi |
| 2265 Anne Marie Dr Unit D Baton Rouge, LA | 2.0 | 2.0 | 972 | $800 | $0.82 | 43d | 1 | 0.58mi |
| 2266 Anne Marie Dr Unit C Baton Rouge, LA | 2.0 | 2.0 | 1000 | $850 | $0.85 | 14d | 1 | 0.61mi |
| 2266 Anne Marie Dr Unit C Baton Rouge, LA | 2.0 | 2.0 | 1000 | $750 | $0.75 | 43d | 1 | 0.61mi |
| 2266 Anne Marie Dr Unit B Baton Rouge, LA | 2.0 | 2.0 | 1000 | $900 | $0.90 | 43d | 1 | 0.61mi |
| 2059 Mariner Dr Unit 2059-20 Baton Rouge, LA | 2.0 | 2.0 | 950 | $925 | $0.97 | 23d | 1 | 0.65mi |
| 8425 Ned Ave Unit D Baton Rouge, LA | 2.0 | 2.0 | 970 | $875 | $0.90 | 43d | 1 | 0.66mi |
| 2038 Jasper Ave Unit GM 2038-C Baton Rouge, LA | 2.0 | 1.5 | 1100 | $900 | $0.82 | 43d | 1 | 0.68mi |
| 2029 Jasper Ave Unit 2029-B Baton Rouge, LA | 3.0 | 2.0 | 1350 | $1,250 | $0.93 | 23d | 1 | 0.72mi |
| 2029 Jasper Ave Unit 2029-D Baton Rouge, LA | 3.0 | 2.0 | 1350 | $1,200 | $0.89 | 44d | 1 | 0.72mi |
| 8726 Elvin Dr Unit B Baton Rouge, LA | 2.0 | 1.5 | 1300 | $1,800 | $1.38 | 43d | 1 | 0.73mi |
| 8726 Elvin Dr Unit B Baton Rouge, LA | 2.0 | 1.5 | 1300 | $1,800 | $1.38 | 23d | 1 | 0.73mi |
| 8736 Elvin Dr Unit C Baton Rouge, LA | 2.0 | 1.5 | 1140 | $1,100 | $0.96 | 23d | 1 | 0.74mi |
| 8736 Elvin Dr Unit A Baton Rouge, LA | 2.0 | 1.5 | 1140 | $1,100 | $0.96 | 43d | 1 | 0.74mi |
| 1646 Jade Ave Unit GM 1646-D Baton Rouge, LA | 2.0 | 1.5 | 1100 | $900 | $0.82 | 14d | 1 | 0.74mi |
| 1646 Jade Ave Unit GM 1646-C Baton Rouge, LA | 2.0 | 1.5 | 1100 | $850 | $0.77 | 43d | 1 | 0.74mi |
| 1616 Jade Ave Baton Rouge, LA | 2.0 | 1.5 | 1000 | $900 | $0.90 | 23d | 1 | 0.75mi |
| 8234 Keel Ave Baton Rouge, LA | 3.0 | 2.0 | 1000 | $1,000 | $1.00 | 43d | 1 | 0.76mi |
| 1717 Jade Ave Unit 2 Gardere, LA | 2.0 | 1.5 | 1000 | $900 | $0.90 | 43d | 1 | 0.78mi |
| 1717 Jade Ave Unit 1 Baton Rouge, LA | 2.0 | 1.5 | 1000 | $900 | $0.90 | 23d | 1 | 0.78mi |
| 8724 GSRI Ave Unit 8724-B Baton Rouge, LA | 2.0 | 1.0 | 853 | $950 | $1.11 | 14d | 1 | 0.78mi |
| 8246 Ned Ave Apt C Baton Rouge, LA | 2.0 | 2.0 | 990 | $750 | $0.76 | 23d | 1 | 0.80mi |
| 1773 Starboard Dr Unit 1773-1 Baton Rouge, LA | 2.0 | 1.5 | 1100 | $995 | $0.90 | 19d | 1 | 0.80mi |
| 8723 GSRI Ave Unit 8723-B Baton Rouge, LA | 2.0 | 1.0 | 853 | $950 | $1.11 | 21d | 1 | 0.82mi |
| 8215 Skysail Ave Baton Rouge, LA | 2.0 | 2.0 | 1000 | $750 | $0.75 | 23d | 1 | 0.84mi |
| 8225 Ned Ave Unit 8225-C Baton Rouge, LA | 2.0 | 2.0 | 970 | $950 | $0.98 | 44d | 1 | 0.86mi |
| 1434 Jasper Ave Baton Rouge, LA | 2.0 | 1.5 | 1000 | $800 | $0.80 | 43d | 1 | 0.87mi |
| 1658 Starboard Dr Unit 1658-C Baton Rouge, LA | 2.0 | 1.5 | 1100 | $850 | $0.77 | 14d | 1 | 0.89mi |
| 1711 Mast Dr Unit 1711-4 Baton Rouge, LA | 3.0 | 2.5 | 1185 | $1,100 | $0.93 | 44d | 1 | 0.90mi |
| 1648 Starboard Dr Apt C Baton Rouge, LA | 2.0 | 1.0 | 980 | $850 | $0.87 | 43d | 1 | 0.91mi |
| 8911 GSRI Ave Baton Rouge, LA | 2.0 | 2.0 | 1100 | $1,150 | $1.05 | 43d | 1 | 0.94mi |
| 1707 Port Dr Unit D Baton Rouge, LA | 2.0 | 2.0 | 875 | $950 | $1.09 | 43d | 1 | 0.96mi |
| 8727 Granite Dr Unit 8727-C Baton Rouge, LA | 2.0 | 1.5 | 1100 | $940 | $0.85 | 19d | 1 | 0.96mi |
Listing history 17 events
-
2026-06-18days on market $128,500 Active 99 DOM
-
2026-06-17days on market $128,500 Active 98 DOM
-
2026-06-16days on market $128,500 Active 97 DOM
-
2026-06-15days on market $128,500 Active 96 DOM
-
2026-06-14days on market $128,500 Active 94 DOM
-
2026-06-10days on market $128,500 Active 91 DOM
-
2026-06-09days on market $128,500 Active 90 DOM
-
2026-06-08days on market $128,500 Active 89 DOM
-
2026-06-07days on market $128,500 Active 88 DOM
-
2026-06-05days on market $128,500 Active 85 DOM
-
2026-06-03days on market $128,500 Active 84 DOM
-
2026-06-02days on market $128,500 Active 83 DOM
-
2026-06-01days on market $128,500 Active 82 DOM
-
2026-05-31days on market $128,500 Active 81 DOM
-
2026-05-31days on market $128,500 Active 80 DOM
-
2026-03-11$128,500 Active 515-char remark
Show marketing remark (515 chars)
Investor special or starter home opportunity in the Rosewood subdivision. Home offers a large living room and breakfast nook, an extended driveway providing ample parking and a spacious backyard; perfect for outdoor activities or future enhancements. With some repairs and TLC, this home has tremendous potential to increase in value. Whether you're an investor looking to renovate and sell, or a buyer eager to personalize your first home, this property is ideal for those ready to make improvements and add value.
ⓘ Source: listings_history table (triggers on properties + properties_extension) + one-shot
backfill from property_details.listing_events for pre-trigger history.
Tax reassessment forecast LA · Resets to sale price
- Current annual tax
- $1,261 · $105/mo
- Projected year-2 tax
- $1,261 · $105/mo
- Expected delta
- $0/yr ($0/mo · 0.0%)
ⓘ Screening estimate from a state-policy table — verify with the county assessor before closing.
Climate risk First Street
- Flood 1/10 Low FEMA zone X · 0% chance over 30 yrs
- Wildfire 1/10 Low
- Heat 8/10 Severe 7 d/yr ≥108°F today · 21 d/yr by 30 yrs out
- Wind 9/10 Extreme 99% chance of damaging wind over 30 yrs
- Air quality 2/10 Low 1 unhealthy d/yr today · 2 by 30 yrs out
Nearby sold comps map
Loading sold comps map…
Walkable amenities ~0.75 mi
Loading nearby amenities…
Taxation est. · year 1
- Rental income
- $15,708
- − Mortgage interest
- −$7,198
- − Property taxes
- −$1,261
- − Insurance
- −$642
- − Repairs & maintenance
- −$1,257
- − Management
- −$1,257
- − Depreciation
- −$3,738
- Taxable income
- $356
- Est. tax owed @ 24.0%
- −$85
- After-tax cash flow
- $2,335/yr
For passive investors: Depreciation is non-cash, so a rental often shows a tax loss while cash-flowing — sheltering income. Rental losses are passive: they offset passive income freely, and up to $25,000/yr can offset ordinary (W-2) income if you actively participate and your MAGI is under $100k (phasing out to $0 by $150k); unused losses carry forward. On sale, claimed depreciation is recaptured at up to 25%, and gains may owe capital-gains tax (a 1031 exchange can defer both). Figures are a year-1 estimate at your 24.0% rate — not tax advice; consult a CPA.
Schools (NCES district)
- District
- East Baton Rouge Parish
- NCES district ID
- 2200540
- Math proficiency
- 22% ▼ -36.00%
- Reading proficiency
- 34% ▼ -31.00%
- Median HH income
- $46,263
- Composite
- 24.14/100
- National rank
- #7745
- State rank
- #47 of 98 in LA
Livability — Gardere
- Score
- 64/100
- State rank
- #167
- US rank
- #14008
Category grades
Schools grade is shown separately in the Schools card above.
Census & demographics
- Census place
- Gardere, LA
- County
- East Baton Rouge Parish · 399,686 people
- Metro
- Baton Rouge, LA
- Population (ZIP)
- 42,659
- Household income
- $92,098
- Rent vs Own
- Severe rent burden
- 1106.0
Population outlook (East Baton Rouge County) Hauer SSP2
- Today (2025)
- 464,810 people
- By 2030
- 472,137 · +1.6%
- By 2040
- 480,243 · +3.3%
- By 2050
- 484,422 · +4.2%
- By 2075
- 492,069 · +5.9%
- By 2100
- 476,347 · +2.5%
Race, ethnicity, and origin ACS 2023
- Neighborhood character
- Diverse neighborhood (Simpson 0.60)
- Race & ethnicity
- White 55% Black 29% Hispanic / Latino 7% Two or more races 6% Asian 6%
- Hispanic origin (detail)
- Mexican 1%
- Common ancestry
- Lithuanian 11% Slovak 2% Scottish 1%
- Foreign-born
- 9% · Canada, China, South Korea
- Languages at home
- 89% English-only · Spanish 4% Other Indo-European 2% Chinese 1%
Political lean MEDSL · East Baton Rouge
- 2024 margin
- D (+11.1) · D 54.5% · R 43.4% · Other 2.1%
- 2008→2024 swing
- +8.9pp toward D · 2008: 2.2pp · 2024: 11.1pp
- All cycles
- 2024: D+11.1 2020: D+13.1 2016: D+9.2 2012: D+5.2 2008: D+2.2
Not yet ingested
- Civics
- —
Market trends
- HPI YoY
- ▼ -117.55%
- Current HPI
- 172.7593
- Rent YoY
- ▲ 0.68%
- Metro
- Baton Rouge, LA
- State GDP YoY
- ▲ 3.29%
- F500 in state
- 10
Industry mix (Fortune 500 HQ in LA)
| Industry | F500 HQs | Revenue |
|---|---|---|
| Telecommunications | 2 | $23B |
|
||
| Utilities | 1 | $12B |
|
||
| Wholesale / Distribution | 1 | $5B |
|
||
| Advertising | 1 | $2B |
|
||
Price history
+0.0% since first listed2 events — show timeline
- 2026-03-11 Listed $128,500 AcadianaMLS
- 2026-03-11 Listed $128,500 GBRMLS
Property tax history
+22.8%/yrLatest (2025): $1,261 · -0.4% YoY. Source: county tax records.
Cash-flow waterfall
monthlySold comps — $/sqft
last 12 mo · ≤1 miLoading sold comps…