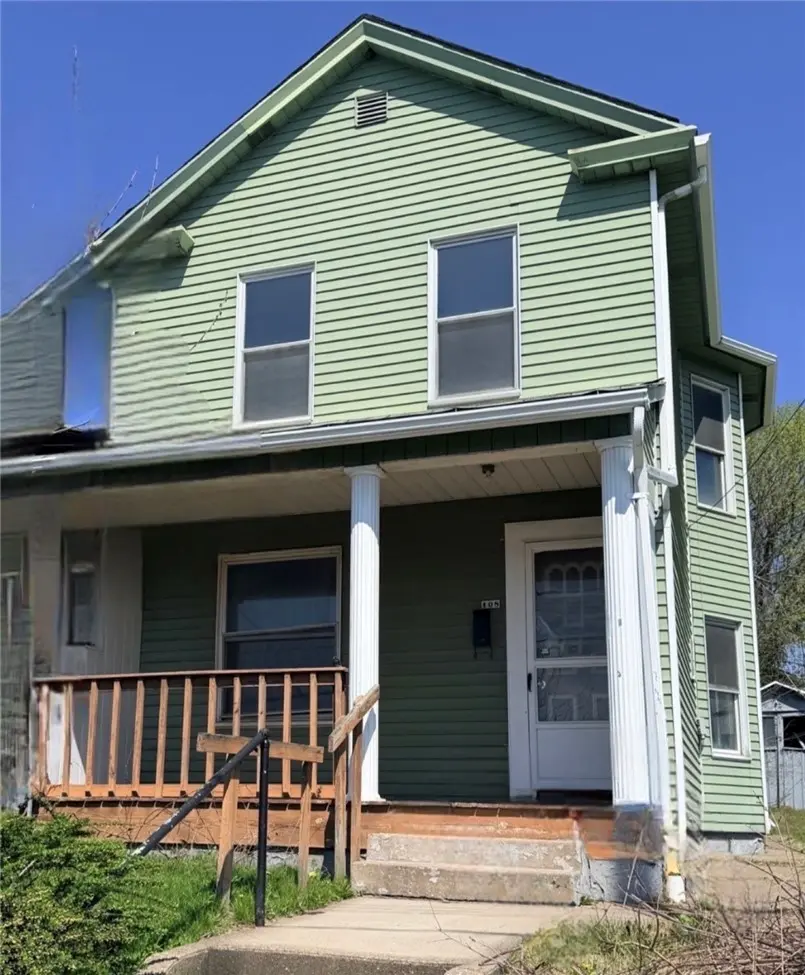
108 Park Rd · Ambridge, PA
Flood risk 8/10 · Major
- FEMA flood zone
- X (unshaded)
- Chance of flooding over 30 yrs
- 0.78%
- Est. flood insurance / yr
- $473 – $860
Fire risk 1/10 · Minimal
- Est. fire insurance / yr
- $511 – $949
Heat risk 4/10 · Minor
- Hot days now (above 97°F)
- 7 days/yr
- Hot days in 30 yrs
- 19 days/yr
Wind risk 2/10 · Minimal
- Chance of severe wind over 30 yrs
- —
Air-quality risk 3/10 · Minor
- Unhealthy air days now
- 2 days/yr
- Unhealthy air days in 30 yrs
- 3 days/yr
Risk factors via First Street. Map © Google.
Why this score? — see what drove the C grade
The composite is a weighted blend of 9 inputs, each scored 0–100. Each bar is that input's sub-score; the figure is the points it added to the 100-point composite (weight × sub-score).
- Cash flow +26.2/30.0
- DSCR +8.9/10.0
- 1% rule +7.1/10.0
- ARV discount +5.9/15.0
- Livability +3.9/5.0
- Schools +3.1/10.0
- Rent growth +2.5/5.0
- Condition / age +2.5/5.0
- Appreciation +0.0/10.0
$100,000
🖨 Deal sheet 📄 Offer letter ✓ Due diligence
Listing remarks
Welcome to 108 Park Road in Ambridge, PA — a beautifully updated 2 story colonial with 3-bedrooms, 1.5-bath home offering comfort, convenience, and modern living in a desirable location. This move-in ready property features newer updates throughout the home and provides easy access to shopping, restaurants, major highways, Downtown Pittsburgh, Pittsburgh International Airport, and nearby entertainment destinations. From the moment you arrive, you will appreciate the inviting curb appeal and well-maintained appearance. Inside, the home offers a functional layout with spacious living areas, abundant natural light, and updated finishes throughout. The main living space provides a warm an
Key facts
- Inviting curb appeal
- Updated kitchen
- Move in ready
Tags
Property features AI
Exterior
- Parking: On-street parking
- Utilities: Public water; Public sewer
- Home design: 2-story home; Resale property; Asphalt roof
- Construction: Built on standard foundation
- Exterior features: Public transportation nearby
Interior
- Bathrooms: One full bathroom
- Interior features: Unfinished walk-out basement; Decorative fireplace (1)
Neighborhood map
What this means for you Summary
Snapshot
- This is a 3-bed/1.0-bath single-family listed at $100k.
Deal economics
- At list price, monthly cash flow is $199 ($2k/yr) — positive.
- The deal already cash-flows at list — no discount required.
- Meets the 1% rule at list price ($1k rent vs $100k).
- Recommended offer: $97k (3.0% below list) — sets the bar for market timing.
- Cap rate 9.3% vs local median 6.6% in Ambridge — top-decile yield for the area; either an underpriced asset or a hidden risk that comps aren't pricing in. Stress-test before assuming the spread holds.
Location & tenants
- Location reads 78/100 on livability (#293 in PA, #2,594 nationally) — a middle-class / working-renter tenant base. Strengths: commute A+, cost of living A+, housing A+; Watch: schools D+, employment D+, crime F.
- Ambridge Area SD (suburban): math 23% / reading 48% proficiency, ranked #408 of 539 in PA (top 76%) — families likely to look elsewhere, expect single-tenant / working-renter base with shorter leases.
- Market conditions: 58 active listings in the ZIP; 4 comparable units currently listed for rent nearby; rentals at typical pace (median 15d on market — plan ~3-4 weeks tenant-placement turnaround); 272 units permitted in Beaver County in 2024 (80 in 5+ unit buildings).
Forward outlook
- Local home prices are declining (-3.0%/yr); year-one equity from $691 of loan paydown is wiped out by about $3k of value loss. Plan a longer hold.
- Beaver County population projected at -14% by 2050 — secular population decline; favor cash flow + early exit over multi-decade hold.
Negotiation context
- It's been on market 34 days — a 3% lower offer ($97k) is reasonable based on typical stale-listing flexibility.
- Current owner paid $11k; list at $100k implies a 809% gain — meaningful room to come down on a strong offer.
Risks & watch-outs
- Watch-outs: flood insurance adds $56/mo; built in 1900 — expect roof / HVAC / electrical / plumbing capex.
- Climate carrying-cost: severe flood risk — expect insurance premiums to compound above CPI over the hold.
Questions for the listing agent
- It's been on market 34 days. Have you received any prior offers? Is the seller open to a 3% concession, seller financing, or rate buy-down credit?
- Built in 1900 — when were the roof, HVAC, electrical panel, plumbing, and water heater last replaced?
- What's the actual annual flood-insurance premium (NFIP or private), and is the property in a SFHA with mandatory coverage?
- Is there a deadline driving the sale (1031 exchange, divorce, estate, relocation)? That informs how much negotiation room exists.
- Schools are D-rated, which usually means shorter tenancies and higher turnover. Who's the typical renter profile here, and what's been the actual vacancy rate?
- Crime grade is F in this area — have there been break-ins, vandalism, or insurance claims at this property in the last 3 years? What carrier currently insures it and at what premium?
- What's the average days-on-market for RENTAL listings here right now (not sales)? A rising rental-DOM trend means longer vacancies and softer asking-rent achievability than the comps imply.
- What's the recent tenant-quality profile in this submarket — average credit score on applications, eviction rate, late-payment / NSF rate, and stable-employment percentage? A property-management company in the area should have these aggregated.
- How much new for-sale + rental construction is in the pipeline within 1–3 miles? Heavy new supply typically softens prices + rents 12–24 months out; constrained supply supports both.
Investment metrics
- 1% rule
- 1.21% ✓
- Cap rate
- 9.35%
- Cash-on-cash
- 10.91%
- DSCR
- 1.49
- GRM
- 6.9
CMA / ARV
- ARV (median comp)
- $96,488
- List price
- $100,000
- Delta
- 3.64%
- Verdict
- FAIR
- Comps
- 20 within 1.0 mi
Show comp detail 12 sales within ~0.75 mi
| Address | Dist | Beds/Ba | Sqft | Sold | Price | $/sf | Match |
|---|---|---|---|---|---|---|---|
| 108 Main St | 0.36mi | 2/1.0 (-1) | 1,335 (+2%) | 1mo | $152,500 | $114 | 75 |
| 86 Main St | 0.36mi | 3/1.0 | 1,344 (+2%) | 7mo | $141,000 | $105 | 74 |
| 557 Glenwood Ave | 0.55mi | 3/1.5 | 1,312 (0%) | 11mo | $165,000 | $126 | 63 |
| 448 Melrose Ave | 0.43mi | 3/1.5 | 1,216 (-7%) | 5mo | $42,000 | $35 | 62 |
| 314 Pine St | 0.38mi | 3/2.0 | 1,459 (+11%) | 2mo | $115,900 | $79 | 58 |
| 347 Washington St | 0.64mi | 3/1.0 | 1,416 (+8%) | 1mo | $168,000 | $119 | 56 |
| 421 Maplewood Ave | 0.35mi | 3/3.0 | 1,440 (+10%) | 12mo | $120,000 | $83 | 49 |
| 716 5th St | 0.46mi | 3/2.0 | 1,140 (-13%) | 12mo | $140,000 | $123 | 43 |
| 895 Valley Rd | 0.71mi | 3/1.0 | 1,134 (-14%) | 6mo | $49,990 | $44 | 40 |
| 551 Glenwood Ave | 0.54mi | 4/1.0 (+1) | 1,490 (+14%) | 11mo | $94,000 | $63 | 38 |
| 17 Ambridge Ave | 0.68mi | 2/1.0 (-1) | 1,140 (-13%) | 7mo | $95,000 | $83 | 36 |
| 591 Virginia Ave | 0.75mi | 2/2.0 (-1) | 1,116 (-15%) | 3mo | $160,000 | $143 | 29 |
Match score weights: distance 35% · size 25% · config 20% · recency 20%. Top-matched comps best support the ARV.
Projected returns pro-forma
-3.0% appreciation · 3.0% rent growth · sell at horizon
- IRR
- -3.3%
- Equity multiple
- 0.88×
- Total profit
- $-3,475
- Equity at exit
- $14,910
- IRR
- 6.4%
- Equity multiple
- 1.48×
- Total profit
- $13,526
- Equity at exit
- $8,646
Cash invested: $28,000 (down + closing). Projections, not guarantees.
Landlord ↔ Tenant lean methodology
- Overall (STATE)
- 62 Landlord-Friendly
- State Pennsylvania
- 62 Landlord-Friendly · EVEN
- County
- — inherits STATE
- City
- — inherits STATE
ZIP-level market 15003
- Home prices YoY
- -15.7%
- Active inventory
- 58
- Price-to-rent
- 6.9×
Monthly cashflow live
- Estimated rent
- $1,208 medium interval (Pro) →
- Mortgage (P&I)
- −$524
- Tax from tax record
- −$133 /mo · $1,601/yr
- Insurance
- −$42
- Flood insurance flood zone
- −$56 /mo · $666/yr
- HOA
- −$0
- Vacancy / Maint / Mgmt
- −$254
- Net cashflow
- $199
Break-even live
UW: 25.0% down · 7.5% · 30yr · 1.5% tax · 5.0% vac · 8.0% maint · 8.0% mgmt
Financing live
Cash to close
- Down payment
- $25,000
- Closing costs
- $3,000
- Reserves months
- —
- Total cash needed
- —
Loan-product check · same deal, 3 products live
Conventional
25% down · 7.5% · 30yr
- Down + closing
- —
- Monthly P&I
- —
- Monthly cashflow
- —
- DSCR
- —
- Eligible?
- —
Personal DTI + credit; lowest rate.
DSCR
20% down · 8.5% · 30yr
- Down + closing
- —
- Monthly P&I
- —
- Monthly cashflow
- —
- DSCR
- —
- Eligible?
- —
No personal income docs; deal must DSCR.
Hard money
10% down · 12.0% · 12mo
- Down + closing
- —
- Monthly P&I
- —
- Monthly cashflow
- —
- DSCR
- —
- Eligible?
- —
Short-term bridge; refi at stabilization.
Rent comps 4 comps
| Address | Beds | Baths | Sqft | Rent | $/sqft | DOM | Units | Dist |
|---|---|---|---|---|---|---|---|---|
| 121 Locust St Ambridge, PA | 2.0–3.0 | 1.0 | 875 | $1,250 | $1.43 | 1d | 3 | 0.15mi |
| 230 Locust St Ambridge, PA | 2.0 | 1.0 | 1205 | $1,103 | $0.92 | 14d | 1 | 0.22mi |
| 266 Beaver St Leetsdale, PA | 3.0 | 1.0 | 1766 | $1,350 | $0.76 | 1d | 1 | 0.92mi |
| 1700 Beaver Rd Ambridge, PA | 3.0 | 1.0 | 1099 | $1,495 | $1.36 | 16d | 1 | 1.44mi |
Listing history 15 events
-
2026-06-18days on market $100,000 Active 34 DOM
-
2026-06-17days on market $100,000 Active 33 DOM
-
2026-06-16days on market $100,000 Active 32 DOM
-
2026-06-15days on market $100,000 Active 31 DOM
-
2026-06-13days on market $100,000 Active 29 DOM
-
2026-06-13days on market $100,000 Active 28 DOM
-
2026-06-09days on market $100,000 Active 25 DOM
-
2026-06-08days on market $100,000 Active 24 DOM
-
2026-06-07days on market $100,000 Active 23 DOM
-
2026-06-03days on market $100,000 Active 19 DOM
-
2026-06-02days on market $100,000 Active 18 DOM
-
2026-06-01days on market $100,000 Active 17 DOM
-
2026-05-31days on market $100,000 Active 16 DOM
-
2026-05-15$100,000 Active 2430-char remark
-
1972-06-01soldstatus $11,000
ⓘ Source: listings_history table (triggers on properties + properties_extension) + one-shot
backfill from property_details.listing_events for pre-trigger history.
Tax reassessment forecast PA · Partial reset (capped growth)
- Current annual tax
- $1,601 · $133/mo
- Projected year-2 tax
- $1,601 · $133/mo
- Expected delta
- $0/yr ($0/mo · 0.0%)
ⓘ Screening estimate from a state-policy table — verify with the county assessor before closing.
Climate risk First Street
- Flood 8/10 Severe FEMA zone X (unshaded) · 78% chance over 30 yrs
- Wildfire 1/10 Low
- Heat 4/10 Moderate 7 d/yr ≥97°F today · 19 d/yr by 30 yrs out
- Wind 2/10 Low
- Air quality 3/10 Moderate 2 unhealthy d/yr today · 3 by 30 yrs out
Nearby sold comps map
Loading sold comps map…
Walkable amenities ~0.75 mi
Loading nearby amenities…
Taxation est. · year 1
- Rental income
- $14,492
- − Mortgage interest
- −$5,602
- − Property taxes
- −$1,601
- − Insurance
- −$1,166
- − Repairs & maintenance
- −$1,159
- − Management
- −$1,159
- − Depreciation
- −$2,909
- Taxable income
- $894
- Est. tax owed @ 24.0%
- −$215
- After-tax cash flow
- $2,173/yr
For passive investors: Depreciation is non-cash, so a rental often shows a tax loss while cash-flowing — sheltering income. Rental losses are passive: they offset passive income freely, and up to $25,000/yr can offset ordinary (W-2) income if you actively participate and your MAGI is under $100k (phasing out to $0 by $150k); unused losses carry forward. On sale, claimed depreciation is recaptured at up to 25%, and gains may owe capital-gains tax (a 1031 exchange can defer both). Figures are a year-1 estimate at your 24.0% rate — not tax advice; consult a CPA.
Schools (NCES district)
- District
- Ambridge Area SD
- NCES district ID
- 4202440
- Math proficiency
- 23% ▼ -12.00%
- Reading proficiency
- 48% ▼ -10.00%
- Median HH income
- $49,514
- Composite
- 30.62/100
- National rank
- #6190
- State rank
- #408 of 539 in PA
Livability — Ambridge
- Score
- 78/100
- State rank
- #293
- US rank
- #2594
Category grades
Schools grade is shown separately in the Schools card above.
Census & demographics
- Census place
- Ambridge, PA
- County
- Beaver County · 116,001 people
- City population
- 11,387
- Metro
- Pittsburgh, PA
- Population (ZIP)
- 11,387
- Household income
- $59,550
- Rent vs Own
- Severe rent burden
- 397.0
Population outlook (Beaver County) Hauer SSP2
- Today (2025)
- 164,976 people
- By 2030
- 161,449 · -2.1%
- By 2040
- 151,752 · -8.0%
- By 2050
- 141,155 · -14.4%
- By 2075
- 118,142 · -28.4%
- By 2100
- 91,740 · -44.4%
Race, ethnicity, and origin ACS 2023
- Neighborhood character
- Predominantly White (77%)
- Race & ethnicity
- White 77% Two or more races 10% Black 9% Hispanic / Latino 7%
- Hispanic origin (detail)
- Mexican 2% Puerto Rican 3%
- Common ancestry
- Romanian 7% Scotch-Irish 3% Subsaharan African 3%
- Foreign-born
- 3% · Canada
- Languages at home
- 95% English-only · Other Indo-European 2% Spanish 2% Russian/Polish/Slavic 1%
Political lean MEDSL · Beaver
- 2024 margin
- Strong R (+20.7) · D 39.2% · R 59.9%
- 2008→2024 swing
- -17.9pp toward R · 2008: -2.8pp · 2024: -20.7pp
- All cycles
- 2024: R+20.7 2020: R+17.7 2016: R+20.1 2012: R+6.6 2008: R+2.8
Not yet ingested
- Civics
- —
Market trends
- HPI YoY
- ▼ -46.42%
- Current HPI
- 249.8525
- Rent YoY
- —
- Metro
- Pittsburgh, PA
- State GDP YoY
- ▲ 1.68%
- F500 in state
- 34
Industry mix (Fortune 500 HQ in PA)
| Industry | F500 HQs | Revenue |
|---|---|---|
| Healthcare | 2 | $309B |
|
||
| Insurance | 2 | $27B |
|
||
| Telecommunications / Media | 1 | $124B |
|
||
| Industrial Distribution | 1 | $22B |
|
||
| Financial Services | 1 | $20B |
|
||
| Chemicals / Materials | 1 | $18B |
|
||
Price history
+809.1% since first listed2 events — show timeline
- 2026-05-15 Listed $100,000 West Penn MLS
- 1972-06-01 Sold (Public Records) $11,000 Public Records
Property tax history
-1.6%/yrLatest (2026): $1,601 · +2.2% YoY. Source: county tax records.
Cash-flow waterfall
monthlySold comps — $/sqft
last 12 mo · ≤1 miLoading sold comps…