 Duplex
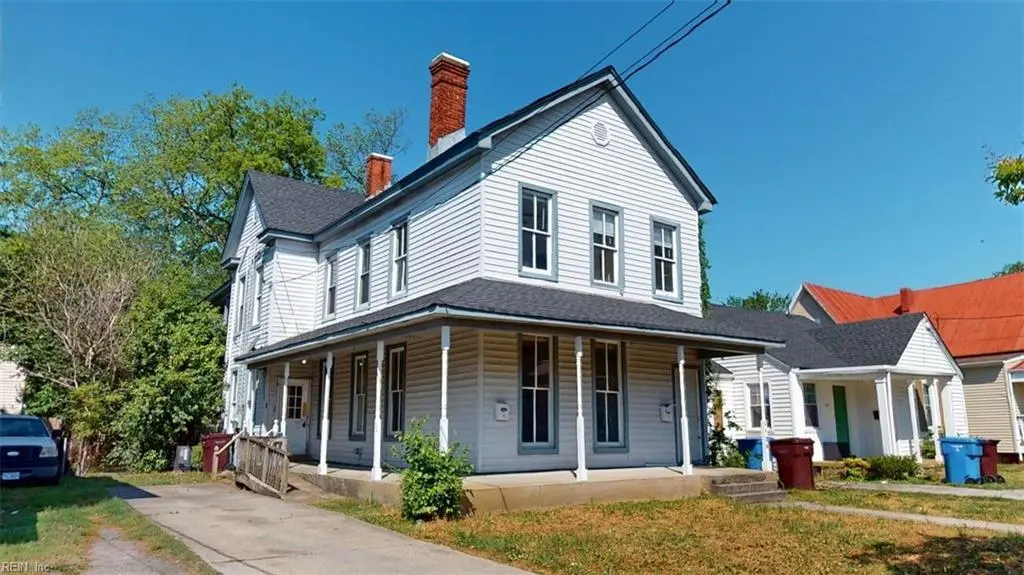
1136 Jackson Ave · Chesapeake, VA
Flood risk 1/10 · Minimal
- FEMA flood zone
- X (unshaded)
- Chance of flooding over 30 yrs
- 0.0%
- Est. flood insurance / yr
- $507 – $1,088
Fire risk 1/10 · Minimal
- Est. fire insurance / yr
- $666 – $1,236
Heat risk 9/10 · Severe
- Hot days now (above 106°F)
- 7 days/yr
- Hot days in 30 yrs
- 16 days/yr
Wind risk 8/10 · Major
- Chance of severe wind over 30 yrs
- 80.0%
Air-quality risk 5/10 · Moderate
- Unhealthy air days now
- 6 days/yr
- Unhealthy air days in 30 yrs
- 7 days/yr
Risk factors via First Street. Map © Google.
Why this score? — see what drove the B+ grade
The composite is a weighted blend of 9 inputs, each scored 0–100. Each bar is that input's sub-score; the figure is the points it added to the 100-point composite (weight × sub-score).
- Cash flow +30.0/30.0
- ARV discount +15.0/15.0
- DSCR +10.0/10.0
- 1% rule +9.2/10.0
- Schools +5.8/10.0
- Livability +3.5/5.0
- Rent growth +2.5/5.0
- Condition / age +2.5/5.0
- Appreciation +0.0/10.0
$230,000
🖨 Deal sheet 📄 Offer letter ✓ Due diligence
Multi-family units
County records classify this as Multi-Family (2-4 Unit). Listing-text estimate: 2 units. confirmed
Listing remarks
Chesapeake duplex opportunity in the established South Norfolk area. This property features two units, each offering 2 bedrooms and 1 full bathroom. Excellent income-producing potential—live in one unit while renting out the other, or add to your investment portfolio. Conveniently located near major interstates, the Jordan Bridge, shipyard, and downtown Norfolk and Portsmouth, making it attractive for tenants and commuters. Property needs some work and is priced with potential in mind. Great opportunity to renovate and maximize rental income. Make sure to ask about the 3D True Immersive Virtual Tour. This technology allows you to literally experience the home on any mobile device, lap
Key facts
- Duplex opportunity
- Conveniently located
- 6,000 sq ft lot
Tags
Property features AI
Finance
- Financial info: Separate meters indicate individually metered utilities for income/expense separation
Exterior
- Parking: Driveway access (Unit A); Off-street parking for both units
- Utilities: City/County water; City/County sewer; Electric water heater; Separate meters for all units
- Home design: Duplex; Over/Under style; Simple ownership; Entry on multiple levels (over/under configuration)
- Construction: Crawl foundation; Asphalt shingle roof
- Exterior features: Vinyl siding; Back fenced yard; Deck
Interior
- Kitchen: Unit A: Kitchen with gas range and refrigerator; Unit B: Kitchen with electric range, microwave, dishwasher, disposal, and refrigerator
- Bedrooms: Unit A: 2 bedrooms (1st floor master in Unit A); Unit B: 2 bedrooms
- Flooring: Vinyl flooring; Wood flooring
- Bathrooms: Unit A: 1 bathroom; Unit B: 1 bathroom
- Heating & cooling: Unit A: Natural gas heating (baseboard, floor furnace); Unit B: Electric forced hot air heating; Unit B: Central air conditioning
- Interior features: Cable TV hookup; Ceiling fan; Satellite dish; Utility room; Deck (lot feature)
- Laundry & utility: Unit A: Washer and dryer; Unit B: Washer and dryer; All units have separate meters
Neighborhood map
What this means for you Summary
Snapshot
- This is a 2 × 2-bed/1.0-bath units multifamily listed at $230k.
Deal economics
- At list price, monthly cash flow is $1k ($13k/yr) — positive. Per door: $550/mo.
- The deal already cash-flows at list — no discount required.
- Meets the 1% rule at list price ($3k rent vs $230k).
- Recommended offer: $223k (3.0% below list) — sets the bar for market timing.
- Cap rate 12.0% vs local median 3.7% in Chesapeake — top-decile yield for the area; either an underpriced asset or a hidden risk that comps aren't pricing in. Stress-test before assuming the spread holds.
Location & tenants
- Location reads 70/100 on livability (#236 in VA) — a middle-class / working-renter tenant base. Strengths: employment A+, housing A+; Watch: crime C-, cost of living C-, amenities F.
- Chesapeake City Public School District (suburban): math 58% / reading 74% proficiency, ranked #31 of 131 in VA (top 24%) — acceptable for families but not a draw, mixed tenant base, ~2y average lease.
- Zoned schools: Rena B. Wright Primary (271 students, 96% FRL); Oscar F. Smith High (math 63% / reading 75%, grade B, #170 of 319 statewide, top 55%, 2,291 students, 70% FRL) — zoned schools average 83% FRL vs 28% district-wide (55 pts higher); higher-poverty schools than district average — tighter screening recommended.
- Market conditions: 116 active listings in the ZIP; 16 comparable units currently listed for rent nearby; rentals at typical pace (median 24d on market — plan ~3-4 weeks tenant-placement turnaround); 44% of comp listings sitting > 30 days — soft ceiling on asking rent; 597 units permitted in Chesapeake city in 2024 (0 in 5+ unit buildings).
Forward outlook
- Local home prices are declining (-3.0%/yr); year-one equity from $2k of loan paydown is wiped out by about $7k of value loss. Plan a longer hold.
- Chesapeake County population projected at +21% by 2050 — long-run rental-demand tailwind backs the buy-and-hold thesis.
- At projected returns (-3.0% appreciation + 3.0% rent growth), your $64k cash investment doubles in ~6 years — after that, you're playing with house money.
Negotiation context
- It's been on market 54 days — a 3% lower offer ($223k) is reasonable based on typical stale-listing flexibility.
- 5 sale attempts since 11y ago with the ask held roughly flat each time — persistent listings suggest the price (not the market) is what's stuck; bring a comps-based counter.
- Current owner paid $75k; list at $230k implies a 207% gain — meaningful room to come down on a strong offer.
Risks & watch-outs
- Watch-outs: built in 1910 — expect roof / HVAC / electrical / plumbing capex.
- Climate carrying-cost: severe wind risk, 80% chance of damaging wind over 30y; extreme-heat days projected 7→16/yr by 2055 (HVAC capex compounding) — expect insurance premiums to compound above CPI over the hold.
Questions for the listing agent
- It's been on market 54 days. Have you received any prior offers? Is the seller open to a 3% concession, seller financing, or rate buy-down credit?
- Can we see the unit-by-unit rent roll, current vacancy, and any below-market leases? What's the average tenancy length?
- What capital expenditures (roof, boiler, parking lot, exteriors) have been made in the last 5 years, and what's planned in the next 2?
- Built in 1910 — when were the roof, HVAC, electrical panel, plumbing, and water heater last replaced?
- Is there a deadline driving the sale (1031 exchange, divorce, estate, relocation)? That informs how much negotiation room exists.
- Schools are A-rated — typically a magnet for longer-tenancy family renters. What's the average tenant stay here, and is there a school-zone premium baked into asking?
- What's the average days-on-market for RENTAL listings here right now (not sales)? A rising rental-DOM trend means longer vacancies and softer asking-rent achievability than the comps imply.
- What's the recent tenant-quality profile in this submarket — average credit score on applications, eviction rate, late-payment / NSF rate, and stable-employment percentage? A property-management company in the area should have these aggregated.
- How much new apartment / multifamily construction is in the pipeline within 1–3 miles? Heavy new supply (>2% of stock underway) typically softens rents 12–24 months out; light construction supports rent growth.
Investment metrics
- 1% rule
- 1.42% ✓
- Cap rate
- 12.03%
- Cash-on-cash
- 20.49%
- DSCR
- 1.91
- GRM
- 5.9
CMA / ARV
- ARV (on-the-fly)
- $293,125
- Comps found
- 1
Show comp detail 1 sale within ~0.75 mi
| Address | Dist | Beds/Ba | Sqft | Sold | Price | $/sf | Match |
|---|---|---|---|---|---|---|---|
| 1305 Chesapeake Ave | 0.18mi | 5/2.0 (+1) | 1,996 (-15%) | 8mo | $250,000 | $125 | 56 |
Match score weights: distance 35% · size 25% · config 20% · recency 20%. Top-matched comps best support the ARV.
Projected returns pro-forma
-3.0% appreciation · 3.0% rent growth · sell at horizon
- IRR
- 12.8%
- Equity multiple
- 1.51×
- Total profit
- $32,753
- Equity at exit
- $34,294
- IRR
- 21.7%
- Equity multiple
- 2.84×
- Total profit
- $118,629
- Equity at exit
- $19,886
Cash invested: $64,400 (down + closing). Projections, not guarantees.
Landlord ↔ Tenant lean methodology
- Overall (STATE)
- 55 Moderately Landlord-Leaning
- State Virginia
- 55 Moderately Landlord-Leaning · D+2
- County
- — inherits STATE
- City
- — inherits STATE
ZIP-level market 23324
- Home prices YoY
- -17.3%
- Active inventory
- 116
- Price-to-rent
- 11.8×
Monthly cashflow live
- Estimated rent
- $3,261 high interval (Pro) →
- Mortgage (P&I)
- −$1,206
- Tax from tax record
- −$174 /mo · $2,094/yr
- Insurance
- −$96
- HOA
- −$0
- Vacancy / Maint / Mgmt
- −$685
- Net cashflow
- $1,100
Break-even live
2-unit breakdown (identical units grouped — click to expand)
| Units | Beds | Baths | Est. rent |
|---|---|---|---|
| 2× units | 2 | 1 | $3,262 |
| #1 | 2 | 1 | $1,631 |
| #2 | 2 | 1 | $1,631 |
| Total (2 units) | $3,261 | ||
UW: 25.0% down · 7.5% · 30yr · 1.5% tax · 5.0% vac · 8.0% maint · 8.0% mgmt
Financing live
Cash to close
- Down payment
- $57,500
- Closing costs
- $6,900
- Reserves months
- —
- Total cash needed
- —
Loan-product check · same deal, 3 products live
Conventional
25% down · 7.5% · 30yr
- Down + closing
- —
- Monthly P&I
- —
- Monthly cashflow
- —
- DSCR
- —
- Eligible?
- —
Personal DTI + credit; lowest rate.
DSCR
20% down · 8.5% · 30yr
- Down + closing
- —
- Monthly P&I
- —
- Monthly cashflow
- —
- DSCR
- —
- Eligible?
- —
No personal income docs; deal must DSCR.
Hard money
10% down · 12.0% · 12mo
- Down + closing
- —
- Monthly P&I
- —
- Monthly cashflow
- —
- DSCR
- —
- Eligible?
- —
Short-term bridge; refi at stabilization.
Rent comps 16 comps
| Address | Beds | Baths | Sqft | Rent | $/sqft | DOM | Units | Dist |
|---|---|---|---|---|---|---|---|---|
| 1108 Jackson Ave Chesapeake, VA | 3.0 | 2.0 | 1784 | $2,100 | $1.18 | 4d | 1 | 0.06mi |
| 1231 Stewart St Chesapeake, VA | 4.0 | 2.5 | 2159 | $2,550 | $1.18 | 3d | 1 | 0.19mi |
| 1110 Park Ave Unit 23324 Chesapeake, VA | 3.0 | 2.0 | 1749 | $2,200 | $1.26 | 23d | 1 | 0.25mi |
| 1110 Park Ave Chesapeake, VA | 3.0 | 2.0 | 1749 | $2,100 | $1.20 | 14d | 1 | 0.26mi |
| 1729 Todd St Norfolk, VA | 3.0 | 2.5 | 2000 | $2,450 | $1.23 | 23d | 1 | 0.76mi |
| 1021 Joyce St Norfolk, VA | 5.0 | 3.0 | 2612 | $4,000 | $1.53 | 43d | 1 | 0.86mi |
| 1512 Marsh St Norfolk, VA | 3.0 | 2.5 | 1727 | $2,195 | $1.27 | 43d | 1 | 0.90mi |
| 722 Culpepper St Norfolk, VA | 5.0 | 4.0 | 1742 | $2,550 | $1.46 | 43d | 1 | 0.91mi |
| 1505 Delevan St Norfolk, VA | 5.0 | 3.5 | 2800 | $3,300 | $1.18 | 17d | 1 | 0.93mi |
| 1008 Grayson St Norfolk, VA | 3.0 | 2.0 | 2200 | $2,495 | $1.13 | 43d | 1 | 1.01mi |
| 413 Walker Ave Norfolk, VA | 5.0 | 3.5 | 2200 | $3,500 | $1.59 | 43d | 1 | 1.03mi |
| 1009 Elkin St Norfolk, VA | 4.0 | 2.5 | 1914 | $2,500 | $1.31 | 12d | 1 | 1.22mi |
| 127 Poplar Ave Unit 1 Norfolk, VA | 3.0 | 2.0 | 1700 | $2,199 | $1.29 | 23d | 1 | 1.27mi |
| 201 Bellamy Ave Norfolk, VA | 5.0 | 2.5 | 2200 | $2,750 | $1.25 | 43d | 1 | 1.42mi |
| 329 S Main St Norfolk, VA | 3.0 | 3.0 | 1652 | $3,000 | $1.82 | 43d | 1 | 1.44mi |
| 2540 Holly Point Blvd Chesapeake, VA | 1.0–3.0 | 1.0–2.0 | 1250 | $2,680 | $2.14 | 1d | 20 | 1.46mi |
Listing history 30 events
-
2026-06-18days on market $230,000 Active 54 DOM
-
2026-06-17days on market $230,000 Active 53 DOM
-
2026-06-16days on market $230,000 Active 52 DOM
-
2026-06-15days on market $230,000 Active 51 DOM
-
2026-06-13days on market $230,000 Active 49 DOM
-
2026-06-09days on market $230,000 Active 45 DOM
-
2026-06-08days on market $230,000 Active 44 DOM
-
2026-06-07pricedays on market $230,000 Active 43 DOM
-
2026-06-03days on market $239,900 Active 39 DOM
-
2026-06-02days on market $239,900 Active 38 DOM
-
2026-06-01days on market $239,900 Active 37 DOM
-
2026-05-31days on market $239,900 Active 36 DOM
-
2026-05-21historical Active Under Contract
-
2026-04-24$239,900 Active
-
2024-11-04historical $1,250
-
2024-09-05$1,250
-
2022-12-08historical
-
2021-01-08soldstatus $75,000
-
2020-12-13historical
-
2020-11-17$144,999 Active
-
2017-01-20price $110,000
-
2017-01-19soldstatus $110,000
-
2016-12-27status Under Contract
-
2016-12-05price $129,900
-
2016-07-25price $144,900
-
2016-03-30$159,900 Active
-
2015-09-18soldstatus $42,500 Sold
-
2015-09-02status Under Contract
-
2015-09-01historical
-
2015-08-21$28,000 Active
ⓘ Source: listings_history table (triggers on properties + properties_extension) + one-shot
backfill from property_details.listing_events for pre-trigger history.
Tax reassessment forecast VA · Resets to sale price
- Current annual tax
- $2,094 · $174/mo
- Projected year-2 tax
- $2,094 · $174/mo
- Expected delta
- $0/yr ($0/mo · 0.0%)
ⓘ Screening estimate from a state-policy table — verify with the county assessor before closing.
Climate risk First Street
- Flood 1/10 Low FEMA zone X (unshaded) · 0% chance over 30 yrs
- Wildfire 1/10 Low
- Heat 9/10 Extreme 7 d/yr ≥106°F today · 16 d/yr by 30 yrs out
- Wind 8/10 Severe 80% chance of damaging wind over 30 yrs
- Air quality 5/10 Major 6 unhealthy d/yr today · 7 by 30 yrs out
Nearby sold comps map
Loading sold comps map…
Walkable amenities ~0.75 mi
Loading nearby amenities…
Taxation est. · year 1
- Rental income
- $39,132
- − Mortgage interest
- −$12,884
- − Property taxes
- −$2,094
- − Insurance
- −$1,150
- − Repairs & maintenance
- −$3,131
- − Management
- −$3,131
- − Depreciation
- −$6,691
- Taxable income
- $10,053
- Est. tax owed @ 24.0%
- −$2,413
- After-tax cash flow
- $10,784/yr
For passive investors: Depreciation is non-cash, so a rental often shows a tax loss while cash-flowing — sheltering income. Rental losses are passive: they offset passive income freely, and up to $25,000/yr can offset ordinary (W-2) income if you actively participate and your MAGI is under $100k (phasing out to $0 by $150k); unused losses carry forward. On sale, claimed depreciation is recaptured at up to 25%, and gains may owe capital-gains tax (a 1031 exchange can defer both). Figures are a year-1 estimate at your 24.0% rate — not tax advice; consult a CPA.
Schools (NCES district)
- District
- Chesapeake City Public School District
- NCES district ID
- 5100810
- Math proficiency
- 58% ▼ -29.00%
- Reading proficiency
- 74% ▼ -7.00%
- Median HH income
- $69,356
- Composite
- 57.84/100
- National rank
- #1047
- State rank
- #31 of 131 in VA
Livability — Chesapeake
- Score
- 70/100
- State rank
- #236
- US rank
- #7942
Category grades
Schools grade is shown separately in the Schools card above.
Census & demographics
- Census place
- Chesapeake, VA
- County
- Chesapeake City · 253,091 people
- City population
- 253,091
- Metro
- Virginia Beach-Norfolk-Newport News, VA-NC
- Population (ZIP)
- 24,670
- Household income
- $57,045
- Rent vs Own
- Severe rent burden
- 1301.0
Population outlook (Chesapeake County) Hauer SSP2
- Today (2025)
- 263,804 people
- By 2030
- 276,798 · +4.9%
- By 2040
- 299,906 · +13.7%
- By 2050
- 318,284 · +20.7%
- By 2075
- 362,137 · +37.3%
- By 2100
- 372,225 · +41.1%
Race, ethnicity, and origin ACS 2023
- Neighborhood character
- Diverse neighborhood (Simpson 0.59)
- Race & ethnicity
- Black 58% White 27% Two or more races 9% Hispanic / Latino 9% Asian 1%
- Hispanic origin (detail)
- Mexican 3% Puerto Rican 4%
- Common ancestry
- Slovak 2% Italian 2% Romanian 1%
- Foreign-born
- 4% · Canada
- Languages at home
- 92% English-only · Spanish 6% French/Haitian/Cajun 1% Other Indo-European 1%
Political lean MEDSL · Chesapeake
- 2024 margin
- Toss-up / Even · D 51.3% · R 47.5% · Other 1.2%
- 2008→2024 swing
- +2.5pp toward D · 2008: 1.3pp · 2024: 3.8pp
- All cycles
- 2024: D+3.8 2020: D+6.5 2016: R+1.3 2012: D+1.1 2008: D+1.3
Not yet ingested
- Civics
- —
Market trends
- HPI YoY
- ▼ -66.73%
- Current HPI
- 319.2653
- Rent YoY
- —
- Metro
- Virginia Beach-Norfolk-Newport News, VA-NC
- State GDP YoY
- ▲ 2.40%
- F500 in state
- 50
Industry mix (Fortune 500 HQ in VA)
| Industry | F500 HQs | Revenue |
|---|---|---|
| Aerospace / Defense | 4 | $236B |
|
||
| Technology / Defense | 3 | $32B |
|
||
| Financial Services | 2 | $176B |
|
||
| Utilities | 2 | $27B |
|
||
| Insurance | 2 | $25B |
|
||
| Technology | 2 | $15B |
|
||
Price history
+756.8% since first listed18 events — show timeline
- 2026-05-21 Contingent — REINMLS
- 2026-04-24 Listed $239,900 REINMLS
- 2024-11-04 Rental Removed $1,250 RENTALBEAST
- 2024-09-05 Listed for Rent $1,250 RENTALBEAST
- 2022-12-08 Rental Removed — RENT.
- 2021-01-08 Sold (Public Records) $75,000 Public Records
- 2020-12-13 Listing Removed — REINMLS
- 2020-11-17 Listed $144,999 REINMLS
- 2017-01-20 Price Changed $110,000 REINMLS
- 2017-01-19 Sold (Public Records) $110,000 Public Records
- 2016-12-27 Pending — REINMLS
- 2016-12-05 Price Changed $129,900 REINMLS
- 2016-07-25 Price Changed $144,900 REINMLS
- 2016-03-30 Listed $159,900 REINMLS
- 2015-09-18 Sold (MLS) $42,500 REINMLS
- 2015-09-02 Pending — REINMLS
- 2015-09-01 Listing Removed — REINMLS
- 2015-08-21 Listed $28,000 REINMLS
Property tax history
+2.6%/yrLatest (2025): $2,094 · +6.6% YoY. Source: county tax records.
Cash-flow waterfall
monthlySold comps — $/sqft
last 12 mo · ≤1 miLoading sold comps…