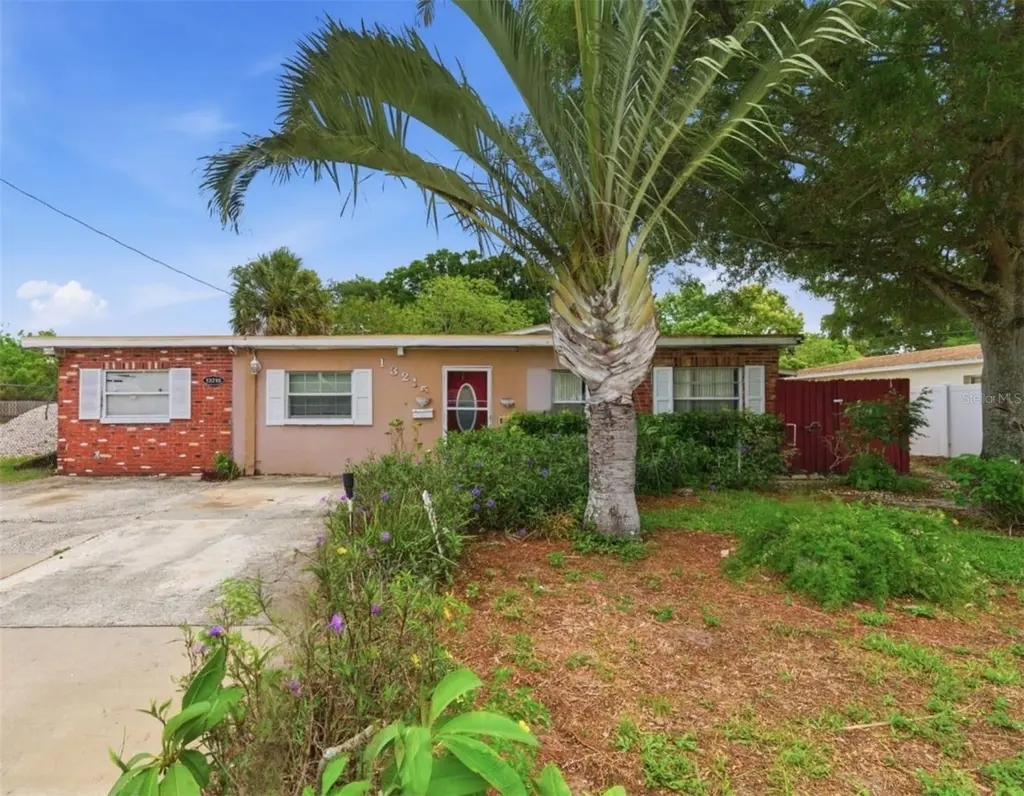
13215 119th St · Ridgecrest, FL
Flood risk 1/10 · Minimal
- FEMA flood zone
- X (unshaded)
- Chance of flooding over 30 yrs
- 0.0%
- Est. flood insurance / yr
- $507 – $1,088
Fire risk 1/10 · Minimal
- Est. fire insurance / yr
- $947 – $1,759
Heat risk 10/10 · Severe
- Hot days now (above 107°F)
- 7 days/yr
- Hot days in 30 yrs
- 25 days/yr
Wind risk 10/10 · Severe
- Chance of severe wind over 30 yrs
- 99.0%
Air-quality risk 3/10 · Minor
- Unhealthy air days now
- 2 days/yr
- Unhealthy air days in 30 yrs
- 3 days/yr
Risk factors via First Street. Map © Google.
Why this score? — see what drove the B grade
The composite is a weighted blend of 9 inputs, each scored 0–100. Each bar is that input's sub-score; the figure is the points it added to the 100-point composite (weight × sub-score).
- Cash flow +30.0/30.0
- 1% rule +10.0/10.0
- DSCR +10.0/10.0
- ARV discount +7.5/15.0
- Schools +4.3/10.0
- Livability +3.6/5.0
- Rent growth +2.8/5.0
- Condition / age +2.5/5.0
- Appreciation +0.0/10.0
$209,900
🖨 Deal sheet 📄 Offer letter ✓ Due diligence
Listing remarks
Auction Property. Auction Date: June 22nd - 24th. This 4 bedroom, 2 bath home with 1,776 sq. ft. of spacious living area is located in unincorporated Pinellas County in Flood Zone X. This unique property has so much potential and is ready for its new owner to restore it back to its original charm or build and customize a home that suit’s your family’s needs on the 60x135 lot. The flexible floor plan includes a bonus room which could serve as a 5th BR, two family rooms, formal dining room, a large screened porch, and a detached 468 sq. ft. storage shed. Conveniently located just minutes to the Pinellas Trail, YMCA, Taylor Park, Walsingham Park, Largo Golf Course, the Library, Fl
Key facts
- Bonus room
- Large screened porch
- 8,100 sq ft lot
Tags
Property features AI
Finance
- Other: Zoned R-3
- HOA & community: No association
Exterior
- Parking: Paved road access
- Utilities: Public water; Public sewer; Public utilities
- Home design: Single-family residence; 1 story; Facing west; Fixer condition
- Construction: Block and wood siding construction; Shingle roof; Slab foundation; Built on a 0.19-acre lot (approx. 60 x 135)
- Exterior features: Enclosed patio/porch; French doors; Sidewalk; Vinyl fencing; Shed and storage structures; Mature landscaping with trees
Interior
- Kitchen: Microwave; Range; Refrigerator
- Bedrooms: 4 bedrooms
- Flooring: Carpet; Ceramic tile
- Bathrooms: 2 full bathrooms
- Heating & cooling: Central heating; Central air conditioning
- Interior features: Ceiling fans; Solid surface countertops; Split-bedroom floor plan; Thermostat
- Laundry & utility: Laundry inside; Inside utility room
Neighborhood map
What this means for you Summary
Snapshot
- This is a 4-bed/2.0-bath single-family listed at $210k.
Deal economics
- At list price, monthly cash flow is $1k ($12k/yr) — positive.
- The deal already cash-flows at list — no discount required.
- Meets the 1% rule at list price ($3k rent vs $210k).
Location & tenants
- Location reads 72/100 on livability (#323 in FL) — a middle-class / working-renter tenant base. Strengths: crime A+, health & safety A+, commute A-; Watch: amenities F, employment F.
- Pinellas (suburban): math 51% / reading 51% proficiency, ranked #31 of 73 in FL (top 42%) — acceptable for families but not a draw, mixed tenant base, ~2y average lease.
- Zoned schools: Fuguitt Elementary School (math 48% / reading 50%, grade D, #1,134 of 2,144 statewide, top 54%, 479 students, 68% FRL); Seminole High School (math 26% / reading 47%, grade F, #351 of 667 statewide, top 54%, 1,546 students, 39% FRL).
- Market conditions: Rents rising (+1.4%/yr); 139 active listings in the ZIP; 22 comparable units currently listed for rent nearby; rentals at typical pace (median 17d on market — plan ~3-4 weeks tenant-placement turnaround); 2,676 units permitted in Pinellas County in 2024 (1,422 in 5+ unit buildings).
- At $3,140/mo this rent would consume 58% of the median local household income ($65k/yr) (locally 261% of renters already pay >50% of income on rent) — very limited rent-growth headroom before tenants either downsize or default.
Forward outlook
- Local home prices are declining (-3.0%/yr); year-one equity from $1k of loan paydown is wiped out by about $6k of value loss. Plan a longer hold.
- Pinellas County population projected at +14% by 2050 — modest demand growth; plan on rents tracking national, not racing it.
- At projected returns (-3.0% appreciation + 1.4% rent growth), your $59k cash investment doubles in ~7 years — after that, you're playing with house money.
Negotiation context
- Only 14 days on market — expect competitive offers; lowballing is unlikely to land.
- 2 sale attempts with the ask held roughly flat each time — persistent listings suggest the price (not the market) is what's stuck; bring a comps-based counter.
- Current owner paid $12k; list at $210k implies a 1649% gain — meaningful room to come down on a strong offer.
Risks & watch-outs
- Climate carrying-cost: severe wind risk, 99% chance of damaging wind over 30y; extreme-heat days projected 7→25/yr by 2055 (HVAC capex compounding) — expect insurance premiums to compound above CPI over the hold.
Questions for the listing agent
- Built in 1960 — when were the roof, HVAC, electrical panel, plumbing, and water heater last replaced?
- Is there a deadline driving the sale (1031 exchange, divorce, estate, relocation)? That informs how much negotiation room exists.
- Schools are D-rated, which usually means shorter tenancies and higher turnover. Who's the typical renter profile here, and what's been the actual vacancy rate?
- What's the average days-on-market for RENTAL listings here right now (not sales)? A rising rental-DOM trend means longer vacancies and softer asking-rent achievability than the comps imply.
- What's the recent tenant-quality profile in this submarket — average credit score on applications, eviction rate, late-payment / NSF rate, and stable-employment percentage? A property-management company in the area should have these aggregated.
- How much new for-sale + rental construction is in the pipeline within 1–3 miles? Heavy new supply typically softens prices + rents 12–24 months out; constrained supply supports both.
Investment metrics
- 1% rule
- 1.50% ✓
- Cap rate
- 12.18%
- Cash-on-cash
- 21.03%
- DSCR
- 1.94
- GRM
- 5.6
CMA / ARV
- ARV (on-the-fly)
- $506,160
- Comps found
- 12
Show comp detail 12 sales within ~0.75 mi
| Address | Dist | Beds/Ba | Sqft | Sold | Price | $/sf | Match |
|---|---|---|---|---|---|---|---|
| 12940 116th St | 0.32mi | 3/2.0 (-1) | 1,779 (+0%) | 3mo | $380,000 | $214 | 78 |
| 11520 132nd Ave | 0.27mi | 3/2.0 (-1) | 1,653 (-7%) | 2mo | $470,000 | $284 | 69 |
| 12985 116th St | 0.32mi | 3/2.0 (-1) | 1,647 (-7%) | 3mo | $470,000 | $285 | 65 |
| 11438 126th Ter | 0.59mi | 3/2.0 (-1) | 1,795 (+1%) | 1mo | $525,000 | $292 | 65 |
| 1716 Madrid Dr | 0.61mi | 4/2.0 | 1,839 (+4%) | 1mo | $400,000 | $218 | 65 |
| 12041 134th Pl | 0.20mi | 3/2.0 (-1) | 1,587 (-11%) | 6mo | $238,229 | $150 | 63 |
| 2372 18th Ave SW | 0.68mi | 4/3.0 | 1,740 (-2%) | 1mo | $380,000 | $218 | 60 |
| 12500 115th St | 0.57mi | 3/2.0 (-1) | 1,834 (+3%) | 6mo | $465,000 | $254 | 58 |
| 13211 111th Ln | 0.62mi | 4/2.0 | 1,664 (-6%) | 4mo | $485,000 | $291 | 57 |
| 11524 124th Ter | 0.61mi | 3/2.0 (-1) | 1,736 (-2%) | 10mo | $510,000 | $294 | 54 |
| 12671 115th St | 0.48mi | 3/2.0 (-1) | 1,568 (-12%) | 3mo | $563,000 | $359 | 51 |
| 13119 111th Ln | 0.63mi | 3/2.0 (-1) | 1,565 (-12%) | 6mo | $525,000 | $335 | 41 |
Match score weights: distance 35% · size 25% · config 20% · recency 20%. Top-matched comps best support the ARV.
Projected returns pro-forma
-3.0% appreciation · 1.38% rent growth · sell at horizon
- IRR
- 11.6%
- Equity multiple
- 1.45×
- Total profit
- $26,609
- Equity at exit
- $31,297
- IRR
- 19.3%
- Equity multiple
- 2.49×
- Total profit
- $87,841
- Equity at exit
- $18,148
Cash invested: $58,772 (down + closing). Projections, not guarantees.
Landlord ↔ Tenant lean methodology
- Overall (STATE)
- 87 Strongly Landlord-Friendly
- State Florida
- 87 Strongly Landlord-Friendly · R+3
- County
- — inherits STATE
- City
- — inherits STATE
ZIP-level market 33778
- Rents YoY
- 1.4%
- Active inventory
- 139
- Price-to-rent
- 5.6×
Monthly cashflow live
- Estimated rent
- $3,140 high interval (Pro) →
- Mortgage (P&I)
- −$1,101
- Tax est. 1.5%
- −$262 /mo · $3,148/yr
- Insurance
- −$87
- HOA
- −$0
- Vacancy / Maint / Mgmt
- −$659
- Net cashflow
- $1,030
Break-even live
UW: 25.0% down · 7.5% · 30yr · 1.5% tax · 5.0% vac · 8.0% maint · 8.0% mgmt
Financing live
Cash to close
- Down payment
- $52,475
- Closing costs
- $6,297
- Reserves months
- —
- Total cash needed
- —
Loan-product check · same deal, 3 products live
Conventional
25% down · 7.5% · 30yr
- Down + closing
- —
- Monthly P&I
- —
- Monthly cashflow
- —
- DSCR
- —
- Eligible?
- —
Personal DTI + credit; lowest rate.
DSCR
20% down · 8.5% · 30yr
- Down + closing
- —
- Monthly P&I
- —
- Monthly cashflow
- —
- DSCR
- —
- Eligible?
- —
No personal income docs; deal must DSCR.
Hard money
10% down · 12.0% · 12mo
- Down + closing
- —
- Monthly P&I
- —
- Monthly cashflow
- —
- DSCR
- —
- Eligible?
- —
Short-term bridge; refi at stabilization.
Rent comps 22 comps
| Address | Beds | Baths | Sqft | Rent | $/sqft | DOM | Units | Dist |
|---|---|---|---|---|---|---|---|---|
| 13250 Ridge Rd Unit 3B1 Largo, FL | 3.0 | 2.0 | 1225 | $1,975 | $1.61 | 18d | 1 | 0.31mi |
| 11704 127th Ave Largo, FL | 3.0 | 2.0 | 1311 | $2,345 | $1.79 | 4d | 1 | 0.34mi |
| 11786 126th Ter Largo, FL | 4.0 | 2.0 | 1242 | $2,650 | $2.13 | 20d | 1 | 0.37mi |
| 13109 114th St Largo, FL | 4.0 | 2.0 | 1925 | $3,146 | $1.63 | 24d | 1 | 0.45mi |
| 11557 124th Ter Largo, FL | 3.0 | 2.0 | 1601 | $3,495 | $2.18 | 18d | 1 | 0.54mi |
| 1767 10th St SW Largo, FL | 4.0 | 2.0 | 1374 | $2,995 | $2.18 | 4d | 1 | 0.59mi |
| 740 16th Ave SW Largo, FL | 4.0 | 2.0 | 1346 | $2,695 | $2.00 | 16d | 1 | 0.76mi |
| 2402 Dryer Ave Largo, FL | 3.0 | 2.0 | 1872 | $3,000 | $1.60 | 24d | 1 | 0.83mi |
| 2503 Mary Sue St SW Largo, FL | 3.0 | 2.0 | 1260 | $2,211 | $1.75 | 14d | 1 | 0.87mi |
| 1261 12th Ct SW Largo, FL | 3.0 | 2.0 | 2086 | $4,200 | $2.01 | 20d | 1 | 0.87mi |
| 2098 Seminole Blvd Largo, FL | 1.0–3.0 | 1.0–2.0 | 1018 | $2,895 | $2.84 | 2d | 23 | 0.89mi |
| 12813 128th Ave Largo, FL | 4.0 | 3.0 | 1919 | $2,800 | $1.46 | 15d | 1 | 0.90mi |
| 2543 Sunny Breeze Ave Unit 1520129P Largo, FL | 3.0 | 3.0 | 1905 | $6,609 | $3.47 | 3d | 1 | 0.95mi |
| 310 15th Ave SW Largo, FL | 3.0 | 2.0 | 1284 | $2,800 | $2.18 | 24d | 1 | 1.06mi |
| 1830 30th Ln SW Largo, FL | 3.0 | 2.0 | 1400 | $2,725 | $1.95 | 14d | 1 | 1.08mi |
| 11365 115th St Unit 1502692P Largo, FL | 4.0 | 2.0 | 1819 | $6,444 | $3.54 | 2d | 1 | 1.21mi |
| 3381 19th Pl SW Largo, FL | 3.0 | 2.0 | 1770 | $2,950 | $1.67 | 24d | 1 | 1.24mi |
| 12217 104th Ln Largo, FL | 3.0 | 2.0 | 1534 | $2,495 | $1.63 | 4d | 1 | 1.29mi |
| 11707 108th St Unit 1018171P Largo, FL | 3.0 | 2.0 | 1259 | $3,119 | $2.48 | 3d | 1 | 1.30mi |
| 1031 Honeysuckle Rd Largo, FL | 3.0 | 2.0 | 1382 | $2,675 | $1.94 | 18d | 1 | 1.35mi |
| 1201 Seminole Blvd Largo, FL | 1.0–3.0 | 1.0–2.0 | 1067 | $2,445 | $2.29 | 2d | 1 | 1.37mi |
| 12293 103rd St Largo, FL | 4.0 | 2.5 | 1339 | $2,469 | $1.84 | 24d | 1 | 1.41mi |
Listing history 9 events
-
2026-06-18days on market $209,900 Active 14 DOM
-
2026-06-17days on market $209,900 Active 13 DOM
-
2026-06-16days on market $209,900 Active 12 DOM
-
2026-06-15days on market $209,900 Active 11 DOM
-
2026-06-13days on market $209,900 Active 9 DOM
-
2026-06-09days on market $209,900 Active 5 DOM
-
2026-06-08days on market $209,900 Active 4 DOM
-
2026-06-07remarks 687-char remark
-
2026-06-07$209,900 Active 3 DOM
ⓘ Source: listings_history table (triggers on properties + properties_extension) + one-shot
backfill from property_details.listing_events for pre-trigger history.
Climate risk First Street
- Flood 1/10 Low FEMA zone X (unshaded) · 0% chance over 30 yrs
- Wildfire 1/10 Low
- Heat 10/10 Extreme 7 d/yr ≥107°F today · 25 d/yr by 30 yrs out
- Wind 10/10 Extreme 99% chance of damaging wind over 30 yrs
- Air quality 3/10 Moderate 2 unhealthy d/yr today · 3 by 30 yrs out
Nearby sold comps map
Loading sold comps map…
Walkable amenities ~0.75 mi
Loading nearby amenities…
Taxation est. · year 1
- Rental income
- $37,682
- − Mortgage interest
- −$11,758
- − Property taxes
- −$3,148
- − Insurance
- −$1,050
- − Repairs & maintenance
- −$3,015
- − Management
- −$3,015
- − Depreciation
- −$6,106
- Taxable income
- $9,591
- Est. tax owed @ 24.0%
- −$2,302
- After-tax cash flow
- $10,060/yr
For passive investors: Depreciation is non-cash, so a rental often shows a tax loss while cash-flowing — sheltering income. Rental losses are passive: they offset passive income freely, and up to $25,000/yr can offset ordinary (W-2) income if you actively participate and your MAGI is under $100k (phasing out to $0 by $150k); unused losses carry forward. On sale, claimed depreciation is recaptured at up to 25%, and gains may owe capital-gains tax (a 1031 exchange can defer both). Figures are a year-1 estimate at your 24.0% rate — not tax advice; consult a CPA.
Schools (NCES district)
- District
- Pinellas
- NCES district ID
- 1201560
- Math proficiency
- 51% ▼ -5.00%
- Reading proficiency
- 51% ▼ -3.00%
- Median HH income
- $46,270
- Composite
- 43.27/100
- National rank
- #3046
- State rank
- #31 of 73 in FL
Livability — Ridgecrest
- Score
- 72/100
- State rank
- #323
- US rank
- #5732
Category grades
Schools grade is shown separately in the Schools card above.
Census & demographics
- Census place
- Ridgecrest, FL
- County
- Pinellas County · 939,478 people
- Metro
- Tampa-St. Petersburg-Clearwater, FL
- Population (ZIP)
- 16,807
- Household income
- $65,355
- Rent vs Own
- Severe rent burden
- 261.0
Population outlook (Pinellas County) Hauer SSP2
- Today (2025)
- 1,027,532 people
- By 2030
- 1,063,586 · +3.5%
- By 2040
- 1,125,020 · +9.5%
- By 2050
- 1,168,637 · +13.7%
- By 2075
- 1,265,188 · +23.1%
- By 2100
- 1,260,357 · +22.7%
Race, ethnicity, and origin ACS 2023
- Neighborhood character
- Predominantly White (72%)
- Race & ethnicity
- White 72% Hispanic / Latino 15% Two or more races 11% Black 9% Asian 2%
- Hispanic origin (detail)
- Puerto Rican 3% Cuban 6%
- Common ancestry
- Romanian 3% Italian 3% Lithuanian 3%
- Foreign-born
- 13% · Canada, Vietnam, Jamaica
- Languages at home
- 85% English-only · Spanish 10% Vietnamese 1% French/Haitian/Cajun 1%
Political lean MEDSL · Pinellas
- 2024 margin
- Lean R (+5.2) · D 46.9% · R 52.1%
- 2008→2024 swing
- -13.5pp toward R · 2008: 8.3pp · 2024: -5.2pp
- All cycles
- 2024: R+5.2 2020: D+0.2 2016: R+1.1 2012: D+5.6 2008: D+8.3
Not yet ingested
- Civics
- —
Market trends
- HPI YoY
- ▼ -320.64%
- Current HPI
- 369.3008
- Rent YoY
- ▲ 1.38%
- Metro
- Tampa-St. Petersburg-Clearwater, FL
- State GDP YoY
- ▲ 3.28%
- F500 in state
- 36
Industry mix (Fortune 500 HQ in FL)
| Industry | F500 HQs | Revenue |
|---|---|---|
| Industrial Technology | 2 | $29B |
|
||
| Insurance | 2 | $17B |
|
||
| Retail | 1 | $60B |
|
||
| Technology Distribution | 1 | $58B |
|
||
| Homebuilding | 1 | $35B |
|
||
| Technology Manufacturing | 1 | $35B |
|
||
Price history
+1649.2% since first listed3 events — show timeline
- 2026-06-04 Listed $209,900 Stellar MLS as Distributed by MLS Grid
- 2026-01-08 Listed $5,000 NFMLS
- 1984-03-01 Sold (Public Records) $12,000 Public Records
Property tax history
-8.8%/yrLatest (2025): $399 · +9.9% YoY. Source: county tax records.
Cash-flow waterfall
monthlySold comps — $/sqft
last 12 mo · ≤1 miLoading sold comps…