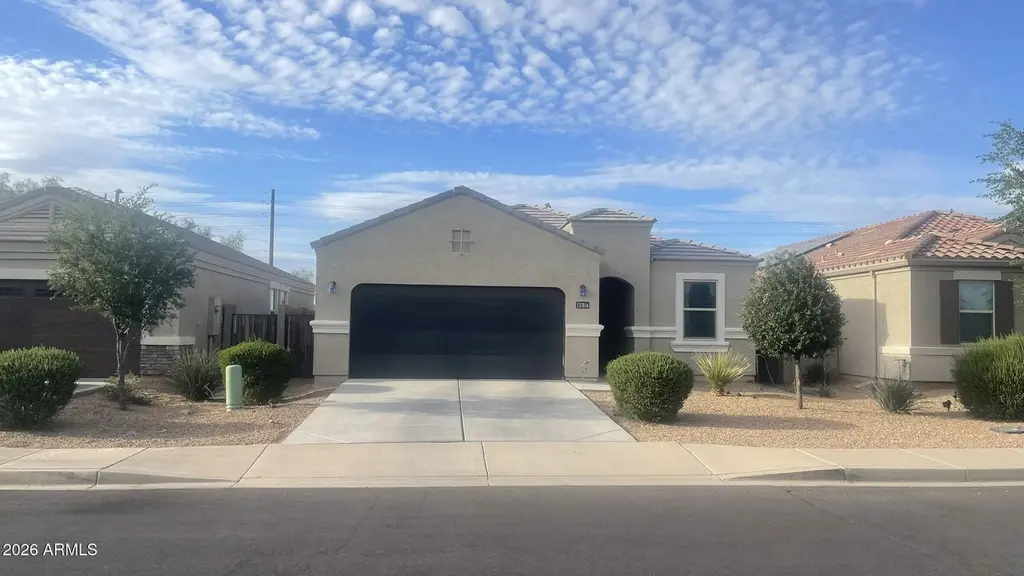
37816 W Amalfi Ave · Maricopa, AZ
Flood risk 1/10 · Minimal
- FEMA flood zone
- X (shaded)
- Chance of flooding over 30 yrs
- 0.0%
- Est. flood insurance / yr
- $507 – $1,088
Fire risk 7/10 · Major
- Est. fire insurance / yr
- $610 – $1,132
Heat risk 9/10 · Severe
- Hot days now (above 114°F)
- 7 days/yr
- Hot days in 30 yrs
- 18 days/yr
Wind risk 1/10 · Minimal
- Chance of severe wind over 30 yrs
- —
Air-quality risk 2/10 · Minimal
- Unhealthy air days now
- 1 days/yr
- Unhealthy air days in 30 yrs
- 1 days/yr
Risk factors via First Street. Map © Google.
Why this score? — see what drove the D grade
The composite is a weighted blend of 9 inputs, each scored 0–100. Each bar is that input's sub-score; the figure is the points it added to the 100-point composite (weight × sub-score).
- ARV discount +14.0/15.0
- Cash flow +7.6/30.0
- Appreciation +4.6/10.0
- Livability +3.6/5.0
- Rent growth +2.9/5.0
- Condition / age +2.5/5.0
- Schools +2.3/10.0
- DSCR +1.7/10.0
- 1% rule +1.4/10.0
$294,900
🖨 Deal sheet (PDF) 📄 Offer letter ✓ Due diligence
Listing remarks
Fall in love with this stunning 3-bedroom, 2-bathroom gem where modern style meets everyday comfort. Step into the heart of the home--a chef-inspired kitchen boasting elegant granite countertops and sleek stainless-steel appliances. The smart, open layout features tile in all the right places, ensuring easy maintenance and a cool, crisp feel throughout. From vibrant dinner parties to cozy movie nights, this move-in-ready home provides the perfect backdrop for your best memories.
Key facts
- 5,401 sq ft lot
- 2 garage spots
- Built 2019
Property features AI
Finance
- Financial info: Current financing: FHA
- HOA & community: Has association; Association fee approximately $84.50 quarterly; Association covers grounds maintenance
Exterior
- Parking: 2 covered parking spaces; 2 open parking spaces; 2-car garage
- Utilities: City water; Public sewer; 220 volts available in kitchen (electric)
- Home design: Single family residence; Fee simple ownership; Asphalt road access
- Construction: Stucco and painted wood frame construction
- Exterior features: Block fencing; Dirt in back yard; Gravel/stone in front yard; Tile roof
Interior
- Kitchen: 220 volts in kitchen
- Bedrooms: 3 possible bedrooms
- Flooring: Carpet; Tile
- Bathrooms: 2 full bathrooms
- Heating & cooling: Ceiling heating; Central air conditioning
- Interior features: Full bathroom in master bedroom; ENERGY STAR qualified windows
- Laundry & utility: Gas dryer hookup; Washer/dryer hookup only
Neighborhood map
What this means for you Summary
Snapshot
- This is a 3-bed/2.0-bath single-family listed at $295k.
Deal economics
- At list price, monthly cash flow is $-353 ($-4k/yr) — negative.
- To cash-flow at today's rent, offer at most $232k (21.2% below list).
- To meet the 1% rule (rent ≥ 1% of price), the offer needs to be $190k (35.6% below list).
- Recommended offer: $190k (35.6% below list) — sets the bar for 1% rule.
- Cap rate 4.9% vs local median 3.7% in Maricopa — top-decile yield for the area; either an underpriced asset or a hidden risk that comps aren't pricing in. Stress-test before assuming the spread holds.
Location & tenants
- Location reads 72/100 on livability (#28 in AZ) — a middle-class / working-renter tenant base. Strengths: housing A+, employment A-, crime B+; Watch: amenities F, commute F, health & safety F.
- Maricopa Unified School District (4441) (town): math 20% / reading 29% proficiency, ranked #128 of 249 in AZ (top 51%) — low school quality limits family demand, transient renter base, plan for 1-2y turnover.
- Zoned schools: Santa Cruz Elementary School (math 27% / reading 34%, grade F, #536 of 1,109 statewide, top 49%, 764 students, 59% FRL); Desert Wind Middle School (math 14% / reading 26%, grade F, #127 of 218 statewide, top 60%, 817 students, 52% FRL); Desert Sunrise High School (615 students, 45% FRL).
- Market conditions: Rents rising (+1.8%/yr); 862 active listings in the ZIP; 40 comparable units currently listed for rent nearby; rentals at typical pace (median 17d on market — plan ~3-4 weeks tenant-placement turnaround); solid renter incomes; 9,504 units permitted in Pinal County in 2024 (776 in 5+ unit buildings).
Forward outlook
- Local home prices are declining (-0.9%/yr); year-one equity from $2k of loan paydown is wiped out by about $3k of value loss. Plan a longer hold.
Negotiation context
- It's been on market 55 days — a 3% lower offer ($286k) is reasonable based on typical stale-listing flexibility.
Risks & watch-outs
- Climate carrying-cost: major wildfire risk; extreme-heat days projected 7→18/yr by 2055 (HVAC capex compounding) — expect insurance premiums to compound above CPI over the hold.
Questions for the listing agent
- What do current leases actually rent for vs. the listed asking? Can we see a recent rent roll and the last 12 months of T-12 income?
- It's been on market 55 days. Have you received any prior offers? Is the seller open to a 36% concession, seller financing, or rate buy-down credit?
- What does the HOA fee cover, when was the last increase, and are there any pending special assessments or reserve-fund shortfalls?
- Is there a deadline driving the sale (1031 exchange, divorce, estate, relocation)? That informs how much negotiation room exists.
- Schools are B-rated — typically a magnet for longer-tenancy family renters. What's the average tenant stay here, and is there a school-zone premium baked into asking?
- The area grade is low — what's the realistic commute time and amenity access for the typical tenant pool here? Any planned neighborhood developments (good or bad) we should know about?
- What's the average days-on-market for RENTAL listings here right now (not sales)? A rising rental-DOM trend means longer vacancies and softer asking-rent achievability than the comps imply.
- What's the recent tenant-quality profile in this submarket — average credit score on applications, eviction rate, late-payment / NSF rate, and stable-employment percentage? A property-management company in the area should have these aggregated.
- How much new for-sale + rental construction is in the pipeline within 1–3 miles? Heavy new supply typically softens prices + rents 12–24 months out; constrained supply supports both.
Investment metrics
- 1% rule
- 0.64% ✗
- Cap rate
- 4.85%
- Cash-on-cash
- -5.14%
- DSCR
- 0.77
- GRM
- 12.9
CMA / ARV
- ARV (median comp)
- $344,556
- List price
- $294,900
- Delta
- -14.41%
- Verdict
- UNDERPRICED
- Comps
- 20 within 1.0 mi
Show comp detail 12 sales within ~0.75 mi
| Address | Dist | Beds/Ba | Sqft | Sold | Price | $/sf | Match |
|---|---|---|---|---|---|---|---|
| 38031 W San Alvarez Ave | 0.17mi | 3/2.0 | 1,573 (+1%) | 1mo | $309,000 | $196 | 89 |
| 37635 W Capri Ave | 0.18mi | 3/2.0 | 1,525 (-2%) | 1mo | $295,000 | $193 | 88 |
| 38149 W Isabella Ln | 0.34mi | 3/2.0 | 1,542 (-1%) | 2mo | $299,000 | $194 | 81 |
| 38135 W Cannataro Ln | 0.28mi | 4/2.0 (+1) | 1,572 (+1%) | 1mo | $312,000 | $198 | 79 |
| 17530 N Salerno Dr | 0.39mi | 4/2.0 (+1) | 1,787 (+15%) | 1mo | $354,990 | $199 | 51 |
| 38205 W Frascati Ave | 0.39mi | 4/2.0 (+1) | 1,787 (+15%) | 2mo | $354,990 | $199 | 50 |
| 37064 W Mondragone Ln | 0.56mi | 3/2.0 | 1,766 (+14%) | 2mo | $298,995 | $169 | 50 |
| 38220 W Frascati Ave | 0.37mi | 4/2.0 (+1) | 1,787 (+15%) | 4mo | $354,990 | $199 | 50 |
| 38190 W Frascati Ave | 0.36mi | 4/2.0 (+1) | 1,787 (+15%) | 4mo | $355,000 | $199 | 50 |
| 38170 W Frascati Ave | 0.35mi | 4/2.0 (+1) | 1,787 (+15%) | 6mo | $315,990 | $177 | 49 |
| 38165 W Frascati Ave | 0.38mi | 4/2.0 (+1) | 1,787 (+15%) | 6mo | $349,990 | $196 | 48 |
| 36796 W Mondragone Ln | 0.70mi | 3/2.0 | 1,381 (-11%) | 2mo | $260,000 | $188 | 47 |
Match score weights: distance 35% · size 25% · config 20% · recency 20%. Top-matched comps best support the ARV.
Projected returns pro-forma
-0.89% appreciation · 1.78% rent growth · sell at horizon
- IRR
- -12.9%
- Equity multiple
- 0.45×
- Total profit
- $-45,604
- Equity at exit
- $72,778
- IRR
- -7.1%
- Equity multiple
- 0.36×
- Total profit
- $-52,689
- Equity at exit
- $77,788
Cash invested: $82,572 (down + closing). Projections, not guarantees.
Landlord ↔ Tenant lean methodology
- Overall (STATE)
- 87 Strongly Landlord-Friendly
- State Arizona
- 87 Strongly Landlord-Friendly · R+3
- County
- — inherits STATE
- City
- — inherits STATE
ZIP-level market 85138
- Home prices YoY
- -0.3%
- Rents YoY
- 1.8%
- Active inventory
- 862
- Price-to-rent
- 12.9×
Monthly cashflow live
- Estimated rent
- $1,900 high interval (Pro) →
- Mortgage (P&I)
- −$1,546
- Tax from tax record
- −$157 /mo · $1,883/yr
- Insurance
- −$123
- HOA
- −$28
- Vacancy / Maint / Mgmt
- −$399
- Net cashflow
- $-353
Break-even live
Sensitivity live
| Price | -10% $-186 | -5% $-270 | +0% $-353 | +5% $-437 | +10% $-520 |
|---|---|---|---|---|---|
| Rent | -10% $-503 | -5% $-428 | +0% $-353 | +5% $-278 | +10% $-203 |
| Rate | -1.0pp $-205 | -0.5pp $-278 | base $-353 | +0.5pp $-430 | +1.0pp $-508 |
UW: 25.0% down · 7.5% · 30yr · 1.5% tax · 5.0% vac · 8.0% maint · 8.0% mgmt
Financing live
Cash to close
- Down payment
- $73,725
- Closing costs
- $8,847
- Reserves months
- —
- Total cash needed
- —
Loan-product check · same deal, 3 products live
Conventional
25% down · 7.5% · 30yr
- Down + closing
- —
- Monthly P&I
- —
- Monthly cashflow
- —
- DSCR
- —
- Eligible?
- —
Personal DTI + credit; lowest rate.
DSCR
20% down · 8.5% · 30yr
- Down + closing
- —
- Monthly P&I
- —
- Monthly cashflow
- —
- DSCR
- —
- Eligible?
- —
No personal income docs; deal must DSCR.
Hard money
10% down · 12.0% · 12mo
- Down + closing
- —
- Monthly P&I
- —
- Monthly cashflow
- —
- DSCR
- —
- Eligible?
- —
Short-term bridge; refi at stabilization.
Rent comps 40 comps
| Address | Beds | Baths | Sqft | Rent | $/sqft | DOM | Units | Dist |
|---|---|---|---|---|---|---|---|---|
| 17878 N Pietra Rd Maricopa, AZ | 3.0 | 2.0 | 1555 | $1,625 | $1.05 | 45d | 1 | 0.07mi |
| 37995 W San Ildefanso Ave Maricopa, AZ | 4.0 | 2.0 | 1711 | $1,890 | $1.10 | 0d | 1 | 0.20mi |
| 38128 W San Sisto Ave Maricopa, AZ | 3.0 | 2.0 | 1593 | $1,995 | $1.25 | 45d | 1 | 0.20mi |
| 17936 N Lettere Cir Maricopa, AZ | 4.0 | 2.5 | 2012 | $1,800 | $0.89 | 7d | 1 | 0.24mi |
| 38060 W Frascati Ave Maricopa, AZ | 4.0 | 2.0 | 1790 | $1,995 | $1.11 | 45d | 1 | 0.31mi |
| 37392 W Capri Ave Maricopa, AZ | 3.0 | 2.0 | 1764 | $1,695 | $0.96 | 16d | 1 | 0.32mi |
| 37392 W Capri Ave Maricopa, AZ | 3.0 | 2.0 | 1764 | $1,695 | $0.96 | 18d | 1 | 0.32mi |
| 38165 W Excussare Way Maricopa, AZ | 4.0 | 2.0 | 1572 | $1,995 | $1.27 | 7d | 1 | 0.32mi |
| 38105 W Isabella Ln Maricopa, AZ | 3.0 | 2.0 | 1795 | $1,711 | $0.95 | 0d | 1 | 0.32mi |
| 37154 W Amalfi Ave Maricopa, AZ | 4.0 | 2.5 | 2223 | $1,695 | $0.76 | 26d | 1 | 0.42mi |
| 37144 W Amalfi Ave Maricopa, AZ | 4.0 | 2.0 | 1516 | $1,669 | $1.10 | 0d | 1 | 0.43mi |
| 37144 W Amalfi Ave Maricopa, AZ | 4.0 | 2.0 | 1516 | $1,839 | $1.21 | 25d | 1 | 0.43mi |
| 38248 W Santa Clara Ave Maricopa, AZ | 3.0 | 2.0 | 1700 | $2,150 | $1.26 | 26d | 1 | 0.44mi |
| 37088 W Amalfi Ave Maricopa, AZ | 4.0 | 2.0 | 1516 | $1,735 | $1.14 | 45d | 1 | 0.47mi |
| 37128 W Mondragone Ln Maricopa, AZ | 3.0 | 2.0 | 1409 | $1,450 | $1.03 | 45d | 1 | 0.55mi |
| 37078 W Mondragone Ln Maricopa, AZ | 3.0 | 2.0 | 1409 | $1,600 | $1.14 | 0d | 1 | 0.56mi |
| 36837 W Mediterranean Way Maricopa, AZ | 3.0 | 2.0 | 1278 | $1,695 | $1.33 | 45d | 1 | 0.72mi |
| 36837 W Mediterranean Way Maricopa, AZ | 3.0 | 2.0 | 1278 | $1,595 | $1.25 | 0d | 1 | 0.72mi |
| 36822 W Maddaloni Ave Maricopa, AZ | 4.0 | 2.0 | 1825 | $1,775 | $0.97 | 3d | 1 | 0.74mi |
| 36990 W Nola Way Maricopa, AZ | 3.0 | 2.0 | 1769 | $1,639 | $0.93 | 12d | 1 | 0.76mi |
| 36605 W Mondragone Ln Maricopa, AZ | 3.0 | 2.0 | 1170 | $1,595 | $1.36 | 12d | 1 | 0.82mi |
| 36502 W San Ildefanso Ave Maricopa, AZ | 3.0 | 2.5 | 2104 | $2,400 | $1.14 | 0d | 1 | 0.89mi |
| 36419 W San Ildefanso Ave Maricopa, AZ | 4.0 | 2.0 | 1849 | $1,795 | $0.97 | 16d | 1 | 0.93mi |
| 36355 W Mediterranean Way Maricopa, AZ | 3.0 | 2.0 | 1411 | $2,050 | $1.45 | 3d | 1 | 0.99mi |
| 36355 W Mediterranean Way Maricopa, AZ | 3.0 | 2.0 | 1411 | $2,050 | $1.45 | 0d | 1 | 0.99mi |
| 37014 W Prado St Maricopa, AZ | 3.0 | 2.0 | 1568 | $1,700 | $1.08 | 18d | 1 | 1.00mi |
| 18853 N Vemto St Maricopa, AZ | 4.0 | 3.0 | 2233 | $1,895 | $0.85 | 26d | 1 | 1.01mi |
| 37043 W Vera Cruz Dr Maricopa, AZ | 4.0 | 2.0 | 1832 | $2,300 | $1.26 | 0d | 1 | 1.01mi |
| 36972 W Prado St Maricopa, AZ | 3.0 | 2.0 | 1568 | $1,700 | $1.08 | 18d | 1 | 1.02mi |
| 17589 N Del Mar Ave Maricopa, AZ | 3.0 | 2.0 | 1177 | $1,895 | $1.61 | 46d | 1 | 1.02mi |
| 36085 W San Sisto Ave Maricopa, AZ | 4.0 | 2.0 | 1605 | $2,500 | $1.56 | 0d | 1 | 1.10mi |
| 36043 W Santa Clara Ave Maricopa, AZ | 3.0 | 2.0 | 1700 | $1,895 | $1.11 | 3d | 1 | 1.16mi |
| 19270 N Costa Verdez Ave Maricopa, AZ | 3.0 | 2.0 | 1220 | $1,645 | $1.35 | 0d | 1 | 1.17mi |
| 19270 N Costa Verdez Ave Maricopa, AZ | 3.0 | 2.0 | 1220 | $1,610 | $1.32 | 45d | 1 | 1.17mi |
| 35963 W San Alvarez Ave Maricopa, AZ | 4.0 | 2.0 | 1922 | $1,995 | $1.04 | 26d | 1 | 1.18mi |
| 36033 W San Clemente Ave Maricopa, AZ | 4.0 | 2.0 | 1775 | $1,700 | $0.96 | 45d | 1 | 1.22mi |
| 36635 W Honeycutt Rd Maricopa, AZ | 1.0–3.0 | 1.0–2.0 | 972 | $2,259 | $2.32 | 0d | 83 | 1.27mi |
| 18392 N Los Gabrieles Way Maricopa, AZ | 3.0 | 2.0 | 1662 | $1,785 | $1.07 | 6d | 1 | 1.38mi |
| 39696 W Lococo St Maricopa, AZ | 3.0 | 2.0 | 1130 | $1,604 | $1.42 | 45d | 1 | 1.39mi |
| 35579 W San Capistrano Ave Maricopa, AZ | 3.0 | 2.0 | 1662 | $1,650 | $0.99 | 7d | 1 | 1.43mi |
HOA detail
- Monthly dues
- $28 · $336/yr
Listing history 19 events
-
2026-06-21days on market $294,900 Active 55 DOM
-
2026-06-18days on market $294,900 Active 52 DOM
-
2026-06-17days on market $294,900 Active 51 DOM
-
2026-06-16days on market $294,900 Active 50 DOM
-
2026-06-15days on market $294,900 Active 49 DOM
-
2026-06-13days on market $294,900 Active 47 DOM
-
2026-06-13days on market $294,900 Active 46 DOM
-
2026-06-09days on market $294,900 Active 43 DOM
-
2026-06-08days on market $294,900 Active 42 DOM
-
2026-06-07days on market $294,900 Active 41 DOM
-
2026-06-04days on market $294,900 Active 38 DOM
-
2026-06-03days on market $294,900 Active 37 DOM
-
2026-06-02days on market $294,900 Active 36 DOM
-
2026-06-01days on market $294,900 Active 35 DOM
-
2026-05-31days on market $294,900 Active 34 DOM
-
2026-04-27$294,900 Active 483-char remark
-
2017-10-17soldstatus $6,365,000
-
2012-10-03soldstatus $11,950,000
-
2006-07-05soldstatus $1,700,270
ⓘ Source: listings_history table (triggers on properties + properties_extension) + one-shot
backfill from property_details.listing_events for pre-trigger history.
Tax reassessment forecast AZ · Resets to sale price
- Current annual tax
- $1,883 · $157/mo
- Projected year-2 tax
- $1,946 · $162/mo
- Expected delta
- +$63/yr (+$5/mo · 3.4%)
ⓘ Screening estimate from a state-policy table — verify with the county assessor before closing.
Climate risk First Street
- Flood 1/10 Low FEMA zone X (shaded) · 0% chance over 30 yrs
- Wildfire 7/10 Severe
- Heat 9/10 Extreme 7 d/yr ≥114°F today · 18 d/yr by 30 yrs out
- Wind 1/10 Low
- Air quality 2/10 Low 1 unhealthy d/yr today · 1 by 30 yrs out
Nearby sold comps map
Loading sold comps map…
Walkable amenities ~0.75 mi
Loading nearby amenities…
Taxation est. · year 1
- Rental income
- $22,798
- − Mortgage interest
- −$16,519
- − Property taxes
- −$1,883
- − Insurance
- −$1,474
- − Repairs & maintenance
- −$1,824
- − Management
- −$1,824
- − HOA
- −$336
- − Depreciation
- −$8,579
- Taxable loss
- −$9,641
- Est. tax savings @ 24.0%
- +$2,314
- After-tax cash flow
- $-1,927/yr
For passive investors: Depreciation is non-cash, so a rental often shows a tax loss while cash-flowing — sheltering income. Rental losses are passive: they offset passive income freely, and up to $25,000/yr can offset ordinary (W-2) income if you actively participate and your MAGI is under $100k (phasing out to $0 by $150k); unused losses carry forward. On sale, claimed depreciation is recaptured at up to 25%, and gains may owe capital-gains tax (a 1031 exchange can defer both). Figures are a year-1 estimate at your 24.0% rate — not tax advice; consult a CPA.
Schools (NCES district)
- District
- Maricopa Unified School District (4441)
- NCES district ID
- 0404720
- Math proficiency
- 20% ▼ -18.00%
- Reading proficiency
- 29% ▼ -9.00%
- Median HH income
- $63,725
- Composite
- 22.92/100
- National rank
- #7993
- State rank
- #128 of 249 in AZ
Livability — Maricopa
- Score
- 72/100
- State rank
- #28
- US rank
- #5943
Category grades
Schools grade is shown separately in the Schools card above.
Census & demographics
- Census place
- Maricopa, AZ
- County
- Pinal County · 399,947 people
- City population
- 76,044
- Metro
- Phoenix-Mesa-Chandler, AZ
- Population (ZIP)
- 55,260
- Household income
- $95,867
- Rent vs Own
- Severe rent burden
- 432.0
Population outlook (Pinal County) Hauer SSP2
- Today (2025)
- 437,574 people
- By 2030
- 446,903 · +2.1%
- By 2040
- 452,589 · +3.4%
- By 2050
- 444,126 · +1.5%
- By 2075
- 430,300 · -1.7%
- By 2100
- 393,536 · -10.1%
Race, ethnicity, and origin ACS 2023
- Neighborhood character
- Diverse neighborhood (Simpson 0.69)
- Race & ethnicity
- White 45% Hispanic / Latino 30% Two or more races 17% Black 13% Native American 3% Asian 3% Pacific Islander 1%
- Hispanic origin (detail)
- Mexican 26% Puerto Rican 1%
- Common ancestry
- Lithuanian 2% Romanian 2% Italian 2%
- Foreign-born
- 10% · Canada
- Languages at home
- 79% English-only · Spanish 16% Other Asian/Pacific 1% Other Indo-European 1%
Political lean MEDSL · Pinal
- 2024 margin
- Strong R (+22.1) · D 38.5% · R 60.6%
- 2008→2024 swing
- -7.6pp toward R · 2008: -14.5pp · 2024: -22.1pp
- All cycles
- 2024: R+22.1 2020: R+17.3 2016: R+19.3 2012: R+17.1 2008: R+14.5
Not yet ingested
- Civics
- —
Market trends
- HPI YoY
- ▼ -0.89%
- Current HPI
- 258.1461
- Rent YoY
- ▲ 1.78%
- Metro
- Phoenix-Mesa-Chandler, AZ
- State GDP YoY
- ▲ 4.54%
- F500 in state
- 20
Industry mix (Fortune 500 HQ in AZ)
| Industry | F500 HQs | Revenue |
|---|---|---|
| Technology | 2 | $13B |
|
||
| Mining / Metals | 1 | $23B |
|
||
| Environmental Services | 1 | $16B |
|
||
| Metals / Steel | 1 | $14B |
|
||
| Technology Distribution | 1 | $9B |
|
||
| Homebuilding | 1 | $8B |
|
||
Price history
-82.7% since first listed4 events — show timeline
- 2026-04-27 Listed $294,900 ARMLS
- 2017-10-17 Sold (Public Records) $6,365,000 Public Records
- 2012-10-03 Sold (Public Records) $11,950,000 Public Records
- 2006-07-05 Sold (Public Records) $1,700,270 Public Records
Property tax history
+22.3%/yrLatest (2025): $1,883 · +3.6% YoY. Source: county tax records.
Cash-flow waterfall
monthlySold comps — $/sqft
last 12 mo · ≤1 miLoading sold comps…