1905 Tryon Dr #3 · Fayetteville, NC
Flood risk 1/10 · Minimal
- FEMA flood zone
- X (unshaded)
- Chance of flooding over 30 yrs
- 0.0%
- Est. flood insurance / yr
- $507 – $1,088
Fire risk 4/10 · Minor
- Est. fire insurance / yr
- $906 – $1,684
Heat risk 7/10 · Major
- Hot days now (above 107°F)
- 7 days/yr
- Hot days in 30 yrs
- 16 days/yr
Wind risk 6/10 · Moderate
- Chance of severe wind over 30 yrs
- 74.0%
Air-quality risk 2/10 · Minimal
- Unhealthy air days now
- 0 days/yr
- Unhealthy air days in 30 yrs
- 1 days/yr
Risk factors via First Street. Map © Google.
Why this score? — see what drove the B- grade
The composite is a weighted blend of 9 inputs, each scored 0–100. Each bar is that input's sub-score; the figure is the points it added to the 100-point composite (weight × sub-score).
- Cash flow +26.7/30.0
- 1% rule +9.9/10.0
- DSCR +9.2/10.0
- ARV discount +7.5/15.0
- Livability +3.8/5.0
- Rent growth +3.3/5.0
- Schools +3.1/10.0
- Condition / age +2.2/5.0
- Appreciation +0.0/10.0
$79,500
🖨 Deal sheet 📄 Offer letter ✓ Due diligence
Listing remarks
INVESTOR or Starter Special! CONDO IN GATED COMMUNITY JUST MINUTES FROM SHOPPING AND BASE - 2 BEDROOM / 2 BATH UNIT - WOOD BURNING FIREPLACE IN GREAT ROOM - MASTER SUITE FEATURES WALK IN CLOSET AND GARDEN TUB WITH A LITTLE TLC YOU CAN MAKE IT YOUR OWN- CALL TODAY 910-850-6841 Listing Agent Zack Williams 329673 [email protected]
Key facts
- Gated community
- Walk in closet
- Garden tub
Tags
Property features AI
Finance
- HOA & community: Homeowners association with a monthly fee of $171
Exterior
- Utilities: Public water; Public sewer
- Home design: Residential condominium; Located in the Briarcliff subdivision
- Construction: Wood siding
- Exterior features: Balcony; Barbecue; Covered patio
Interior
- Kitchen: Refrigerator; Dishwasher; Free-standing electric range; Free-standing refrigerator
- Flooring: Carpet; Vinyl
- Bathrooms: 2 full bathrooms
- Heating & cooling: Electric forced-air heating
- Interior features: Breakfast bar; Walk-in closet(s); One wood-burning fireplace
Neighborhood map
What this means for you Summary
Snapshot
- This is a 2-bed/2.0-bath condo listed at $80k. Condition is rated fair.
Deal economics
- At list price, monthly cash flow is $215 ($3k/yr) — positive.
- The deal already cash-flows at list — no discount required.
- Meets the 1% rule at list price ($1k rent vs $80k).
- Recommended offer: $78k (1.5% below list) — sets the bar for market timing.
- Cap rate 9.5% vs local median 4.9% in Fayetteville — top-decile yield for the area; either an underpriced asset or a hidden risk that comps aren't pricing in. Stress-test before assuming the spread holds.
Location & tenants
- Location reads 75/100 on livability (#45 in NC, #4,031 nationally) — a middle-class / working-renter tenant base. Strengths: commute A+, cost of living A+, housing A+; Watch: schools C-, crime F, employment D-.
- Cumberland County Schools (urban): math 32% / reading 41% proficiency, ranked #126 of 178 in NC (top 71%) — families likely to look elsewhere, expect single-tenant / working-renter base with shorter leases.
- Market conditions: Rents rising (+3.0%/yr); 280 active listings in the ZIP; 39 comparable units currently listed for rent nearby; rentals at typical pace (median 24d on market — plan ~3-4 weeks tenant-placement turnaround); 1,125 units permitted in Cumberland County in 2024 (104 in 5+ unit buildings).
Forward outlook
- Local home prices are declining (-3.0%/yr); year-one equity from $550 of loan paydown is wiped out by about $2k of value loss. Plan a longer hold.
- At projected returns (-3.0% appreciation + 3.0% rent growth), your $22k cash investment doubles in ~10 years — after that, you're playing with house money.
Negotiation context
- It's been on market 24 days — a 2% lower offer ($78k) is reasonable based on typical stale-listing flexibility.
Risks & watch-outs
- Climate carrying-cost: major wind risk, 74% chance of damaging wind over 30y; extreme-heat days projected 7→16/yr by 2055 (HVAC capex compounding) — expect insurance premiums to compound above CPI over the hold.
Questions for the listing agent
- Have any recent inspections been done? Can we get a copy of the seller's disclosures and any deferred-maintenance estimates?
- What does the HOA fee cover, when was the last increase, and are there any pending special assessments or reserve-fund shortfalls?
- Any open or pending special assessments — roof, HVAC, plumbing, elevator, façade? What's the per-unit balance and payoff schedule, and is the seller paying it off at close or rolling it to the buyer?
- Is there a deadline driving the sale (1031 exchange, divorce, estate, relocation)? That informs how much negotiation room exists.
- Crime grade is F in this area — have there been break-ins, vandalism, or insurance claims at this property in the last 3 years? What carrier currently insures it and at what premium?
- What's the average days-on-market for RENTAL listings here right now (not sales)? A rising rental-DOM trend means longer vacancies and softer asking-rent achievability than the comps imply.
- What's the recent tenant-quality profile in this submarket — average credit score on applications, eviction rate, late-payment / NSF rate, and stable-employment percentage? A property-management company in the area should have these aggregated.
- How much new apartment / multifamily construction is in the pipeline within 1–3 miles? Heavy new supply (>2% of stock underway) typically softens rents 12–24 months out; light construction supports rent growth.
Investment metrics
- 1% rule
- 1.49% ✓
- Cap rate
- 9.54%
- Cash-on-cash
- 11.59%
- DSCR
- 1.52
- GRM
- 5.6
CMA / ARV
No comps found within radius.
Projected returns pro-forma
-3.0% appreciation · 3.01% rent growth · sell at horizon
- IRR
- 1.1%
- Equity multiple
- 1.04×
- Total profit
- $947
- Equity at exit
- $11,854
- IRR
- 10.9%
- Equity multiple
- 1.85×
- Total profit
- $19,007
- Equity at exit
- $6,874
Cash invested: $22,260 (down + closing). Projections, not guarantees.
Landlord ↔ Tenant lean methodology
- Overall (STATE)
- 85 Strongly Landlord-Friendly
- State North Carolina
- 85 Strongly Landlord-Friendly · R+3
- County
- — inherits STATE
- City
- — inherits STATE
ZIP-level market 28303
- Home prices YoY
- -25.4%
- Rents YoY
- 3.0%
- Active inventory
- 280
- Price-to-rent
- 5.6×
Monthly cashflow live
- Estimated rent
- $1,184 high interval (Pro) →
- Mortgage (P&I)
- −$417
- Tax est. 1.5%
- −$99 /mo · $1,192/yr
- Insurance
- −$33
- HOA
- −$171
- Vacancy / Maint / Mgmt
- −$249
- Net cashflow
- $215
Break-even live
UW: 25.0% down · 7.5% · 30yr · 1.5% tax · 5.0% vac · 8.0% maint · 8.0% mgmt
Financing live
Cash to close
- Down payment
- $19,875
- Closing costs
- $2,385
- Reserves months
- —
- Total cash needed
- —
Loan-product check · same deal, 3 products live
Conventional
25% down · 7.5% · 30yr
- Down + closing
- —
- Monthly P&I
- —
- Monthly cashflow
- —
- DSCR
- —
- Eligible?
- —
Personal DTI + credit; lowest rate.
DSCR
20% down · 8.5% · 30yr
- Down + closing
- —
- Monthly P&I
- —
- Monthly cashflow
- —
- DSCR
- —
- Eligible?
- —
No personal income docs; deal must DSCR.
Hard money
10% down · 12.0% · 12mo
- Down + closing
- —
- Monthly P&I
- —
- Monthly cashflow
- —
- DSCR
- —
- Eligible?
- —
Short-term bridge; refi at stabilization.
Rent comps 39 comps
| Address | Beds | Baths | Sqft | Rent | $/sqft | DOM | Units | Dist |
|---|---|---|---|---|---|---|---|---|
| 4420 Blanton Rd Unit 4420-H Fayetteville, NC | 2.0 | 1.5 | 990 | $1,025 | $1.04 | 13d | 1 | 0.03mi |
| 1909 Tryon Dr #7 Fayetteville, NC | 2.0 | 2.0 | 1060 | $1,050 | $0.99 | 23d | 1 | 0.03mi |
| 1849 Tryon Dr Fayetteville, NC | 2.0 | 2.0 | 1061 | $998 | $0.94 | 23d | 2 | 0.08mi |
| 1861 Tryon Dr Unit 3 Fayetteville, NC | 2.0 | 2.0 | 1050 | $995 | $0.95 | 23d | 1 | 0.10mi |
| 1882 Tryon Dr #4 Fayetteville, NC | 2.0 | 2.0 | 1063 | $1,100 | $1.03 | 13d | 1 | 0.10mi |
| 1808 Tryon Dr Fayetteville, NC | 2.0 | 2.0 | 1066 | $995 | $0.93 | 23d | 1 | 0.20mi |
| 1937 Sardonyx Rd Fayetteville, NC | 2.0 | 2.0 | 1200 | $1,150 | $0.96 | 23d | 1 | 0.29mi |
| 3374 Galleria Dr Fayetteville, NC | 3.0 | 2.0 | 1350 | $1,200 | $0.89 | 23d | 1 | 0.35mi |
| 1907 Eichelberger Dr Fayetteville, NC | 3.0 | 2.0 | 1463 | $1,650 | $1.13 | 23d | 1 | 0.45mi |
| 710 Villagio Pl Fayetteville, NC | 1.0–2.0 | 1.0–2.0 | 984 | $1,686 | $1.71 | 13d | 9 | 0.46mi |
| 1199 Wrenwood Ct Fayetteville, NC | 2.0 | 2.5 | 1224 | $1,345 | $1.10 | 23d | 1 | 0.47mi |
| 1198 Windham Ct Fayetteville, NC | 2.0 | 2.5 | 1200 | $1,100 | $0.92 | 13d | 1 | 0.48mi |
| 1276 N Forest Dr Fayetteville, NC | 2.0 | 2.5 | 1200 | $1,295 | $1.08 | 23d | 1 | 0.50mi |
| 1160 Windham Ct Fayetteville, NC | 2.0 | 2.5 | 1200 | $1,250 | $1.04 | 23d | 1 | 0.52mi |
| 1615 Morehead Ave Fayetteville, NC | 3.0 | 2.0 | 1073 | $1,400 | $1.30 | 23d | 1 | 0.57mi |
| 844 Anita Rd Fayetteville, NC | 2.0 | 1.0 | 850 | $850 | $1.00 | 13d | 1 | 0.61mi |
| 5109 Higgins St Fayetteville, NC | 2.0 | 1.0 | 862 | $1,000 | $1.16 | 23d | 1 | 0.66mi |
| 5112 Cannon St Fayetteville, NC | 2.0 | 1.0 | 750 | $949 | $1.27 | 13d | 1 | 0.69mi |
| 4916 Schmidt St Fayetteville, NC | 2.0 | 1.0 | 801 | $945 | $1.18 | 23d | 1 | 0.83mi |
| 1914 King George Dr Fayetteville, NC | 2.0 | 1.0 | 800 | $850 | $1.06 | 23d | 1 | 0.85mi |
| 3318 Rogers Dr Fayetteville, NC | 3.0 | 2.0 | 1392 | $1,750 | $1.26 | 13d | 1 | 0.94mi |
| 908 William Clark Rd Fayetteville, NC | 2.0 | 1.0 | 750 | $975 | $1.30 | 13d | 1 | 1.02mi |
| 421 Squirrel St Unit A Fayetteville, NC | 2.0 | 1.0 | 780 | $900 | $1.15 | 23d | 1 | 1.09mi |
| 1156 Acorn St Fayetteville, NC | 2.0 | 1.0 | 800 | $1,000 | $1.25 | 23d | 1 | 1.09mi |
| 4943 Fieldcrest Dr Unit B Fayetteville, NC | 1.0 | 1.0 | 825 | $799 | $0.97 | 23d | 1 | 1.16mi |
| 2110 Rogers Dr Fayetteville, NC | 1.0 | 1.0 | 700 | $895 | $1.28 | 23d | 1 | 1.19mi |
| 4959 Fieldcrest Dr Fayetteville, NC | 1.0 | 1.0 | 850 | $725 | $0.85 | 13d | 1 | 1.19mi |
| 1404 Hibiscus Rd Fayetteville, NC | 3.0 | 1.5 | 1418 | $1,350 | $0.95 | 21d | 1 | 1.21mi |
| 1350 Shaw Rd Fayetteville, NC | 3.0 | 2.0 | 1339 | $1,399 | $1.04 | 13d | 1 | 1.23mi |
| 2056 Wheeling St Fayetteville, NC | 3.0 | 2.5 | 1401 | $1,595 | $1.14 | 23d | 1 | 1.24mi |
| 4981 Galveston Dr Fayetteville, NC | 2.0 | 1.5 | 750 | $1,050 | $1.40 | 23d | 1 | 1.25mi |
| 5745 Holland St Fayetteville, NC | 3.0 | 1.0 | 1140 | $1,650 | $1.45 | 23d | 1 | 1.30mi |
| 1981 Wheeling St Fayetteville, NC | 3.0 | 2.0 | 1400 | $1,500 | $1.07 | 23d | 1 | 1.30mi |
| 622 Dashland Dr Unit A Fayetteville, NC | 1.0 | 1.0 | 700 | $835 | $1.19 | 13d | 1 | 1.30mi |
| 622 Dashland Dr Unit B Fayetteville, NC | 2.0 | 1.5 | 750 | $940 | $1.25 | 13d | 1 | 1.31mi |
| 1014 Enclave Dr Fayetteville, NC | 1.0–3.0 | 1.0–2.0 | 1112 | $1,512 | $1.36 | 13d | 19 | 1.32mi |
| 1000a Elm St Fayetteville, NC | 1.0–2.0 | 1.0–2.0 | 675 | $1,403 | $2.08 | 13d | 23 | 1.42mi |
| 1130 Annondale Way Fayetteville, NC | 1.0–3.0 | 1.0–2.5 | 1180 | $1,942 | $1.65 | 13d | 6 | 1.49mi |
| 301 Barcelona Dr Fayetteville, NC | 1.0–2.0 | 1.0–2.0 | 845 | $1,326 | $1.57 | 13d | 58 | 1.50mi |
HOA detail condo
- Monthly dues
- $171 · $2,052/yr
- Likely covers
- security
- Assessments
- None detected in remarks — confirm with the listing agent.
Listing history 17 events
-
2026-06-18price $79,500 Active 24 DOM
-
2026-06-18days on market $80,000 Active 24 DOM
-
2026-06-17days on market $80,000 Active 23 DOM
-
2026-06-16days on market $80,000 Active 22 DOM
-
2026-06-15days on market $80,000 Active 21 DOM
-
2026-06-14days on market $80,000 Active 19 DOM
-
2026-06-13days on market $80,000 Active 18 DOM
-
2026-06-10days on market $80,000 Active 16 DOM
-
2026-06-09days on market $80,000 Active 15 DOM
-
2026-06-08days on market $80,000 Active 14 DOM
-
2026-06-07days on market $80,000 Active 13 DOM
-
2026-06-03days on market $80,000 Active 9 DOM
-
2026-06-02days on market $80,000 Active 8 DOM
-
2026-06-01days on market $80,000 Active 7 DOM
-
2026-05-31days on market $80,000 Active 6 DOM
-
2026-05-30days on market $80,000 Active 5 DOM
-
2026-05-25$80,000 Active
ⓘ Source: listings_history table (triggers on properties + properties_extension) + one-shot
backfill from property_details.listing_events for pre-trigger history.
Climate risk First Street
- Flood 1/10 Low FEMA zone X (unshaded) · 0% chance over 30 yrs
- Wildfire 4/10 Moderate
- Heat 7/10 Severe 7 d/yr ≥107°F today · 16 d/yr by 30 yrs out
- Wind 6/10 Major 74% chance of damaging wind over 30 yrs
- Air quality 2/10 Low 0 unhealthy d/yr today · 1 by 30 yrs out
Nearby sold comps map
Loading sold comps map…
Walkable amenities ~0.75 mi
Loading nearby amenities…
Taxation est. · year 1
- Rental income
- $14,209
- − Mortgage interest
- −$4,453
- − Property taxes
- −$1,192
- − Insurance
- −$398
- − Repairs & maintenance
- −$1,137
- − Management
- −$1,137
- − HOA
- −$2,052
- − Depreciation
- −$2,313
- Taxable income
- $1,528
- Est. tax owed @ 24.0%
- −$367
- After-tax cash flow
- $2,214/yr
For passive investors: Depreciation is non-cash, so a rental often shows a tax loss while cash-flowing — sheltering income. Rental losses are passive: they offset passive income freely, and up to $25,000/yr can offset ordinary (W-2) income if you actively participate and your MAGI is under $100k (phasing out to $0 by $150k); unused losses carry forward. On sale, claimed depreciation is recaptured at up to 25%, and gains may owe capital-gains tax (a 1031 exchange can defer both). Figures are a year-1 estimate at your 24.0% rate — not tax advice; consult a CPA.
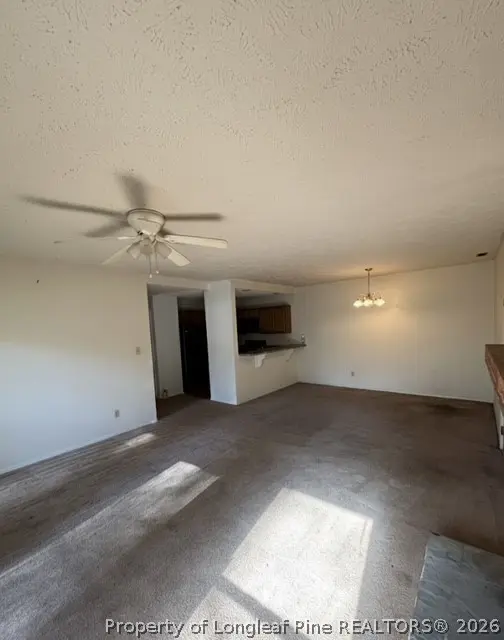
Condition & rehab AI · 4 photos
This townhouse requires moderate renovations, focusing on painting, updating ceiling fans, and improving curb appeal. With some TLC, it can become a move-in-ready property.
Repairs flagged
- Minor Ceiling fan in kitchen — Ceiling fan appears slightly worn.
- Minor Ceiling fan in living room — Ceiling fan appears slightly worn.
- Minor Ceiling fan in bedroom — Ceiling fan appears slightly worn.
Value-add opportunities
- Both Paint interior walls — Fresh paint enhances curb appeal and interior aesthetics.
- Both Replace ceiling fans — New ceiling fans improve air circulation and aesthetics.
- Both Deep clean carpets — Clean carpets make the home more inviting and reduce allergens.
- Both Landscaping and curb appeal — Aesthetic improvements boost curb appeal and attract potential buyers/tenants.
Renovation cost estimate screening
| Repair item | Severity | Est. cost |
|---|---|---|
| Ceiling fan in kitchen · Ceiling fan appears slightly worn. | Minor | $500–3,000 |
| Ceiling fan in living room · Ceiling fan appears slightly worn. | Minor | $500–3,000 |
| Ceiling fan in bedroom · Ceiling fan appears slightly worn. | Minor | $500–3,000 |
| Total estimated repair cost · 3 items | $1,500–9,000 |
Value-add ROI direction
- Both Paint interior walls — Fresh paint enhances curb appeal and interior aesthetics. ↑
- Both Replace ceiling fans — New ceiling fans improve air circulation and aesthetics. ↑
- Both Deep clean carpets — Clean carpets make the home more inviting and reduce allergens. ↑
- Both Landscaping and curb appeal — Aesthetic improvements boost curb appeal and attract potential buyers/tenants. ↑
ⓘ Cost ranges are severity-bucket heuristics (US national rule-of-thumb). Get contractor quotes + a written scope before underwriting a rehab budget.
Schools (NCES district)
- District
- Cumberland County Schools
- NCES district ID
- 3700011
- Math proficiency
- 32% ▼ -2.00%
- Reading proficiency
- 41% ▼ -1.00%
- Median HH income
- $44,168
- Composite
- 31.0/100
- National rank
- #6096
- State rank
- #126 of 178 in NC
Livability — Fayetteville
- Score
- 75/100
- State rank
- #45
- US rank
- #4031
Category grades
Schools grade is shown separately in the Schools card above.
Census & demographics
- Census place
- Fayetteville, NC
- County
- Cumberland County · 265,314 people
- City population
- 226,118
- Metro
- Fayetteville, NC
- Population (ZIP)
- 30,965
- Household income
- $58,223
- Rent vs Own
- Severe rent burden
- 1370.0
Population outlook (Cumberland County) Hauer SSP2
- Today (2025)
- 330,855 people
- By 2030
- 333,523 · +0.8%
- By 2040
- 335,583 · +1.4%
- By 2050
- 335,325 · +1.4%
- By 2075
- 342,853 · +3.6%
- By 2100
- 340,698 · +3.0%
Race, ethnicity, and origin ACS 2023
- Neighborhood character
- Diverse neighborhood (Simpson 0.70)
- Race & ethnicity
- White 39% Black 37% Two or more races 11% Hispanic / Latino 10% Asian 4% Pacific Islander 1%
- Hispanic origin (detail)
- Mexican 2% Puerto Rican 3%
- Common ancestry
- Slovak 3% Serbian 1% Lithuanian 1%
- Foreign-born
- 9% · Canada, South Korea, Vietnam
- Languages at home
- 86% English-only · Spanish 7% Other Asian/Pacific 2% Korean 1%
Political lean MEDSL · Cumberland
- 2024 margin
- D (+13.4) · D 56.1% · R 42.7% · Other 1.2%
- 2008→2024 swing
- -4.3pp toward R · 2008: 17.7pp · 2024: 13.4pp
- All cycles
- 2024: D+13.4 2020: D+16.6 2016: D+16.0 2012: D+19.7 2008: D+17.7
Not yet ingested
- Civics
- —
Market trends
- HPI YoY
- ▼ -77.14%
- Current HPI
- 226.5097
- Rent YoY
- ▲ 3.01%
- Metro
- Fayetteville, NC
- State GDP YoY
- ▲ 3.28%
- F500 in state
- 26
Industry mix (Fortune 500 HQ in NC)
| Industry | F500 HQs | Revenue |
|---|---|---|
| Financial Services | 2 | $213B |
|
||
| Retail | 2 | $95B |
|
||
| Industrial Conglomerate | 1 | $38B |
|
||
| Metals / Steel | 1 | $35B |
|
||
| Utilities | 1 | $30B |
|
||
| Industrial Machinery | 1 | $19B |
|
||
Price history
1 event — show timeline
- 2026-05-25 Listed $80,000 LPRMLS
Cash-flow waterfall
monthlySold comps — $/sqft
last 12 mo · ≤1 miLoading sold comps…