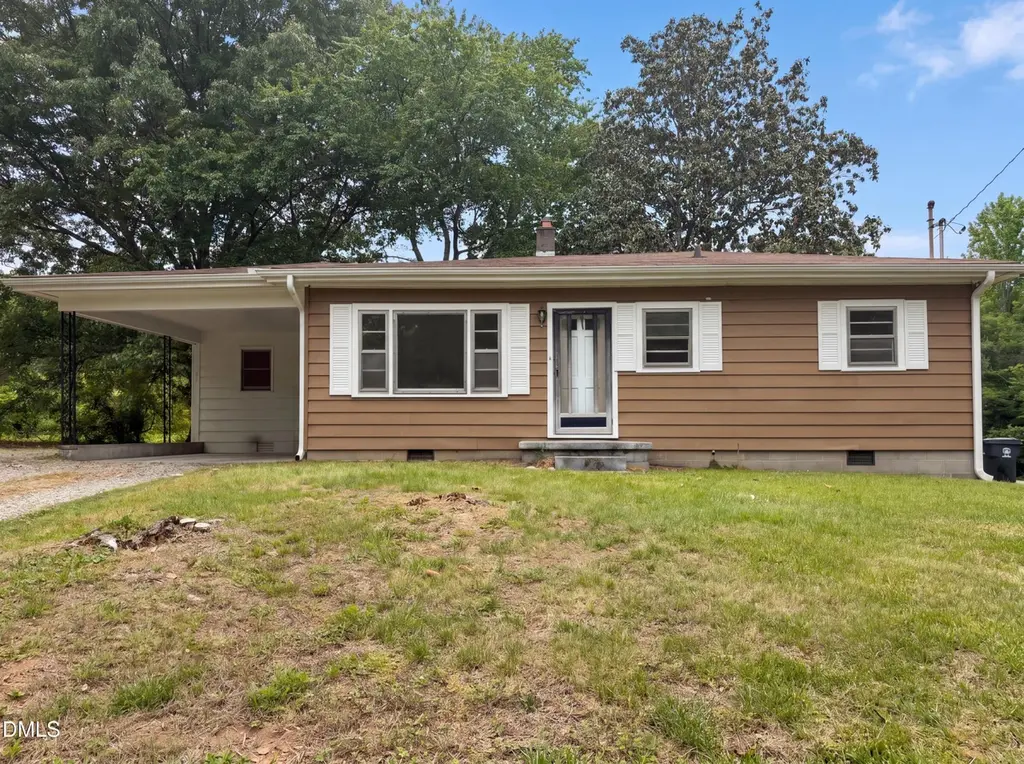
3041 Forrester St · Durham, NC
Flood risk 1/10 · Minimal
- FEMA flood zone
- X (unshaded)
- Chance of flooding over 30 yrs
- 0.0%
- Est. flood insurance / yr
- $507 – $1,088
Fire risk 2/10 · Minimal
- Est. fire insurance / yr
- $906 – $1,684
Heat risk 6/10 · Moderate
- Hot days now (above 105°F)
- 7 days/yr
- Hot days in 30 yrs
- 17 days/yr
Wind risk 6/10 · Moderate
- Chance of severe wind over 30 yrs
- 27.0%
Air-quality risk 2/10 · Minimal
- Unhealthy air days now
- 1 days/yr
- Unhealthy air days in 30 yrs
- 1 days/yr
Risk factors via First Street. Map © Google.
Why this score? — see what drove the D grade
The composite is a weighted blend of 9 inputs, each scored 0–100. Each bar is that input's sub-score; the figure is the points it added to the 100-point composite (weight × sub-score).
- Cash flow +15.0/30.0
- ARV discount +6.6/15.0
- DSCR +4.6/10.0
- Livability +4.0/5.0
- 1% rule +3.4/10.0
- Rent growth +3.1/5.0
- Schools +3.0/10.0
- Condition / age +2.5/5.0
- Appreciation +0.0/10.0
$180,000
🖨 Deal sheet (PDF) 📄 Offer letter ✓ Due diligence
Listing remarks
Welcome to 3041 Forrester St, a residence arranged for everyday practicality, emphasizing functional use and comfortable living. This property includes a dedicated storage shed, providing a practical solution for organizing outdoor gear, gardening tools, or seasonal items, enhancing the overall utility of the grounds. It maintains a straightforward design focusing on functional elements. Don't miss this blend of practicality and comfort.
Key facts
- 0.26 acre lot
- 2 parking spots
- Built 1961
Tags
Property features AI
Finance
- HOA & community: No homeowners association
Exterior
- Parking: Carport plus one open parking space (2 parking spaces total); Carport (1 space) and open parking (1 space)
- Utilities: Public water; Septic tank
- Home design: One-story home
- Construction: Vinyl and wood siding; Composition/shingle roof; Other foundation
- Exterior features: Lot is approximately 0.26 acres; Publicly maintained road access
Interior
- Bedrooms: Two bedrooms (both on the main level)
- Flooring: Carpet; Laminate
- Bathrooms: One full bathroom
- Heating & cooling: Central heating; Central air conditioning
- Interior features: Carpet and laminate flooring
Neighborhood map
What this means for you Summary
Snapshot
- This is a 2-bed/1.0-bath single-family listed at $180k.
Deal economics
- At list price, monthly cash flow is $54 ($653/yr) — positive.
- The deal already cash-flows at list — no discount required.
- To meet the 1% rule (rent ≥ 1% of price), the offer needs to be $151k (16.4% below list).
- Recommended offer: $151k (16.4% below list) — sets the bar for 1% rule.
- Cap rate 6.7% vs local median 3.0% in Durham — top-decile yield for the area; either an underpriced asset or a hidden risk that comps aren't pricing in. Stress-test before assuming the spread holds.
Location & tenants
- Location reads 81/100 on livability (#15 in NC, #1,411 nationally) — a professional / high-income tenant draw. Strengths: amenities A+, commute A+, housing A+; Watch: crime F.
- Durham Public Schools (urban): math 29% / reading 39% proficiency, ranked #132 of 178 in NC (top 74%) — families likely to look elsewhere, expect single-tenant / working-renter base with shorter leases.
- Zoned schools: Holt Elementary (math 10% / reading 26%, grade F, #1,280 of 1,410 statewide, top 91%, 636 students, 83% FRL); Lucas Middle (math 17% / reading 27%, grade F, #416 of 475 statewide, top 89%, 371 students, 70% FRL); Northern High (math 30% / reading 35%, grade F, #441 of 535 statewide, top 83%, 1,308 students, 64% FRL).
- Market conditions: Rents rising (+2.6%/yr); 400 active listings in the ZIP; 10 comparable units currently listed for rent nearby; rentals at typical pace (median 25d on market — plan ~3-4 weeks tenant-placement turnaround); 2,905 units permitted in Durham County in 2024 (955 in 5+ unit buildings).
Forward outlook
- Local home prices are declining (-3.0%/yr); year-one equity from $1k of loan paydown is wiped out by about $5k of value loss. Plan a longer hold.
- Durham County population projected at +44% by 2050 — long-run rental-demand tailwind backs the buy-and-hold thesis.
Negotiation context
- Only 4 days on market — expect competitive offers; lowballing is unlikely to land.
Risks & watch-outs
- Climate carrying-cost: major wind risk, 27% chance of damaging wind over 30y; extreme-heat days projected 7→17/yr by 2055 (HVAC capex compounding) — expect insurance premiums to compound above CPI over the hold.
Questions for the listing agent
- Built in 1961 — when were the roof, HVAC, electrical panel, plumbing, and water heater last replaced?
- Is there a deadline driving the sale (1031 exchange, divorce, estate, relocation)? That informs how much negotiation room exists.
- Schools are D-rated, which usually means shorter tenancies and higher turnover. Who's the typical renter profile here, and what's been the actual vacancy rate?
- Crime grade is F in this area — have there been break-ins, vandalism, or insurance claims at this property in the last 3 years? What carrier currently insures it and at what premium?
- The area grade is low — what's the realistic commute time and amenity access for the typical tenant pool here? Any planned neighborhood developments (good or bad) we should know about?
- What's the average days-on-market for RENTAL listings here right now (not sales)? A rising rental-DOM trend means longer vacancies and softer asking-rent achievability than the comps imply.
- What's the recent tenant-quality profile in this submarket — average credit score on applications, eviction rate, late-payment / NSF rate, and stable-employment percentage? A property-management company in the area should have these aggregated.
- How much new for-sale + rental construction is in the pipeline within 1–3 miles? Heavy new supply typically softens prices + rents 12–24 months out; constrained supply supports both.
Investment metrics
- 1% rule
- 0.84% ✗
- Cap rate
- 6.66%
- Cash-on-cash
- 1.30%
- DSCR
- 1.06
- GRM
- 10.0
CMA / ARV
- ARV (on-the-fly)
- $176,320
- Comps found
- 11
Show comp detail 11 sales within ~0.75 mi
| Address | Dist | Beds/Ba | Sqft | Sold | Price | $/sf | Match |
|---|---|---|---|---|---|---|---|
| 707 Old Oxford Rd | 0.47mi | 3/1.0 (+1) | 920 (-1%) | 4mo | $175,000 | $190 | 68 |
| 711 Old Oxford Rd | 0.46mi | 2/1.0 | 865 (-7%) | 4mo | $115,000 | $133 | 64 |
| 1465 Maplewood Dr | 0.59mi | 2/1.0 | 1,002 (+8%) | 5mo | $195,000 | $195 | 55 |
| 2721 Thelma St | 0.52mi | 3/1.0 (+1) | 957 (+3%) | 13mo | $215,000 | $225 | 55 |
| 3103 Dearborn Dr | 0.34mi | 3/1.0 (+1) | 797 (-14%) | 2mo | $135,000 | $169 | 54 |
| 3615 Cub Creek Rd | 0.46mi | 3/1.0 (+1) | 1,045 (+13%) | 3mo | $180,000 | $172 | 50 |
| 1457 Maplewood Dr Unit A | 0.62mi | 2/1.0 | 825 (-11%) | 14mo | $58,000 | $70 | 41 |
| 915 Da Vinci St | 0.62mi | 3/1.5 (+1) | 1,002 (+8%) | 12mo | $267,000 | $266 | 41 |
| 903 Da Vinci St | 0.62mi | 3/1.5 (+1) | 1,014 (+9%) | 13mo | $190,000 | $187 | 38 |
| 1473 Maplewood Dr | 0.58mi | 3/1.0 (+1) | 814 (-12%) | 19mo | $265,000 | $326 | 32 |
| 2709 Hinson Dr | 0.74mi | 3/1.5 (+1) | 1,020 (+10%) | 23mo | $230,000 | $225 | 23 |
Match score weights: distance 35% · size 25% · config 20% · recency 20%. Top-matched comps best support the ARV.
Projected returns pro-forma
-3.0% appreciation · 2.58% rent growth · sell at horizon
- IRR
- -14.7%
- Equity multiple
- 0.48×
- Total profit
- $-26,378
- Equity at exit
- $26,839
- IRR
- -6.7%
- Equity multiple
- 0.58×
- Total profit
- $-21,261
- Equity at exit
- $15,563
Cash invested: $50,400 (down + closing). Projections, not guarantees.
Landlord ↔ Tenant lean methodology
- Overall (STATE)
- 85 Strongly Landlord-Friendly
- State North Carolina
- 85 Strongly Landlord-Friendly · R+3
- County
- — inherits STATE
- City
- — inherits STATE
ZIP-level market 27704
- Rents YoY
- 2.6%
- Active inventory
- 400
- Price-to-rent
- 10.0×
Monthly cashflow live
- Estimated rent
- $1,505 high interval (Pro) →
- Mortgage (P&I)
- −$944
- Tax from tax record
- −$116 /mo · $1,389/yr
- Insurance
- −$75
- HOA
- −$0
- Vacancy / Maint / Mgmt
- −$316
- Net cashflow
- $54
Break-even live
Sensitivity live
| Price | -10% $156 | -5% $105 | +0% $54 | +5% $4 | +10% $-47 |
|---|---|---|---|---|---|
| Rent | -10% $-64 | -5% $-5 | +0% $54 | +5% $114 | +10% $173 |
| Rate | -1.0pp $145 | -0.5pp $100 | base $54 | +0.5pp $8 | +1.0pp $-40 |
UW: 25.0% down · 7.5% · 30yr · 1.5% tax · 5.0% vac · 8.0% maint · 8.0% mgmt
Financing live
Cash to close
- Down payment
- $45,000
- Closing costs
- $5,400
- Reserves months
- —
- Total cash needed
- —
Loan-product check · same deal, 3 products live
Conventional
25% down · 7.5% · 30yr
- Down + closing
- —
- Monthly P&I
- —
- Monthly cashflow
- —
- DSCR
- —
- Eligible?
- —
Personal DTI + credit; lowest rate.
DSCR
20% down · 8.5% · 30yr
- Down + closing
- —
- Monthly P&I
- —
- Monthly cashflow
- —
- DSCR
- —
- Eligible?
- —
No personal income docs; deal must DSCR.
Hard money
10% down · 12.0% · 12mo
- Down + closing
- —
- Monthly P&I
- —
- Monthly cashflow
- —
- DSCR
- —
- Eligible?
- —
Short-term bridge; refi at stabilization.
Rent comps 10 comps
| Address | Beds | Baths | Sqft | Rent | $/sqft | DOM | Units | Dist |
|---|---|---|---|---|---|---|---|---|
| 414 Craven St Unit B Durham, NC | 1.0 | 1.0 | 610 | $1,200 | $1.97 | 25d | 1 | 0.36mi |
| 705 Piper St Durham, NC | 3.0 | 1.0 | 1001 | $1,500 | $1.50 | 25d | 1 | 0.62mi |
| 4018 Sudbury Rd Durham, NC | 3.0 | 1.0 | 987 | $1,600 | $1.62 | 15d | 1 | 0.84mi |
| 3800 Meriwether Dr Durham, NC | 1.0–2.0 | 1.0–2.0 | 904 | $1,750 | $1.94 | 15d | 23 | 0.84mi |
| 4001 Meriwether Dr Durham, NC | 1.0–3.0 | 1.0–2.0 | 909 | $1,450 | $1.60 | 25d | 1 | 0.96mi |
| 215 William Penn Plz Durham, NC | 1.0–3.0 | 1.0–2.0 | 1031 | $1,595 | $1.55 | 15d | 28 | 1.16mi |
| 409 E Maynard Ave Durham, NC | 2.0 | 1.0 | 775 | $1,197 | $1.54 | 25d | 1 | 1.21mi |
| E Maynard Ave Durham, NC | 2.0 | 1.0 | 775 | $1,197 | $1.54 | 15d | 2 | 1.21mi |
| 3523 N Roxboro St Durham, NC | 1.0–2.0 | 1.0–2.0 | 891 | $1,299 | $1.46 | 25d | 1 | 1.27mi |
| 4801 Danube Ln Durham, NC | 1.0–3.0 | 1.0–2.0 | 1036 | $1,855 | $1.79 | 14d | 13 | 1.40mi |
Listing history 3 events
-
2026-05-05status Pending
-
2026-05-01$180,000 Active
-
2026-04-22soldstatus $180,000
ⓘ Source: listings_history table (triggers on properties + properties_extension) + one-shot
backfill from property_details.listing_events for pre-trigger history.
Tax reassessment forecast NC · Resets to sale price
- Current annual tax
- $1,389 · $116/mo
- Projected year-2 tax
- $1,476 · $123/mo
- Expected delta
- +$87/yr (+$7/mo · 6.3%)
ⓘ Screening estimate from a state-policy table — verify with the county assessor before closing.
Climate risk First Street
- Flood 1/10 Low FEMA zone X (unshaded) · 0% chance over 30 yrs
- Wildfire 2/10 Low
- Heat 6/10 Major 7 d/yr ≥105°F today · 17 d/yr by 30 yrs out
- Wind 6/10 Major 27% chance of damaging wind over 30 yrs
- Air quality 2/10 Low 1 unhealthy d/yr today · 1 by 30 yrs out
Nearby sold comps map
Loading sold comps map…
Walkable amenities ~0.75 mi
Loading nearby amenities…
Taxation est. · year 1
- Rental income
- $18,063
- − Mortgage interest
- −$10,083
- − Property taxes
- −$1,389
- − Insurance
- −$900
- − Repairs & maintenance
- −$1,445
- − Management
- −$1,445
- − Depreciation
- −$5,236
- Taxable loss
- −$2,435
- Est. tax savings @ 24.0%
- +$584
- After-tax cash flow
- $1,238/yr
For passive investors: Depreciation is non-cash, so a rental often shows a tax loss while cash-flowing — sheltering income. Rental losses are passive: they offset passive income freely, and up to $25,000/yr can offset ordinary (W-2) income if you actively participate and your MAGI is under $100k (phasing out to $0 by $150k); unused losses carry forward. On sale, claimed depreciation is recaptured at up to 25%, and gains may owe capital-gains tax (a 1031 exchange can defer both). Figures are a year-1 estimate at your 24.0% rate — not tax advice; consult a CPA.
Schools (NCES district)
- District
- Durham Public Schools
- NCES district ID
- 3701260
- Math proficiency
- 29% ▼ -3.00%
- Reading proficiency
- 39% ▲ 2.00%
- Median HH income
- $52,143
- Composite
- 29.69/100
- National rank
- #6457
- State rank
- #132 of 178 in NC
Livability — Durham
- Score
- 81/100
- State rank
- #15
- US rank
- #1411
Category grades
Schools grade is shown separately in the Schools card above.
Census & demographics
- County
- Durham County · 288,747 people
- City population
- 288,747
- Metro
- Durham-Chapel Hill, NC
- Population (ZIP)
- 40,102
- Household income
- $69,668
- Rent vs Own
- Severe rent burden
- 1280.0
Population outlook (Durham County) Hauer SSP2
- Today (2025)
- 368,962 people
- By 2030
- 402,686 · +9.1%
- By 2040
- 468,677 · +27.0%
- By 2050
- 531,727 · +44.1%
- By 2075
- 660,446 · +79.0%
- By 2100
- 739,971 · +100.6%
Race, ethnicity, and origin ACS 2023
- Neighborhood character
- Diverse neighborhood (Simpson 0.67)
- Race & ethnicity
- Black 48% White 23% Hispanic / Latino 22% Two or more races 10% Asian 2%
- Hispanic origin (detail)
- Mexican 9%
- Common ancestry
- Italian 2% Slovak 1% Lithuanian 1%
- Foreign-born
- 17% · Canada, Jamaica
- Languages at home
- 76% English-only · Spanish 19% Tagalog/Filipino 1% Other Indo-European 1%
Political lean MEDSL · Durham
- 2024 margin
- Solid D (+61.9) · D 80.2% · R 18.2% · Other 1.6%
- 2008→2024 swing
- +10.0pp toward D · 2008: 51.9pp · 2024: 61.9pp
- All cycles
- 2024: D+61.9 2020: D+62.4 2016: D+60.4 2012: D+52.7 2008: D+51.9
Not yet ingested
- Civics
- —
Market trends
- HPI YoY
- ▼ -383.91%
- Current HPI
- 265.4178
- Rent YoY
- ▲ 2.58%
- Metro
- Durham-Chapel Hill, NC
- State GDP YoY
- ▲ 3.28%
- F500 in state
- 26
Industry mix (Fortune 500 HQ in NC)
| Industry | F500 HQs | Revenue |
|---|---|---|
| Financial Services | 2 | $213B |
|
||
| Retail | 2 | $95B |
|
||
| Industrial Conglomerate | 1 | $38B |
|
||
| Metals / Steel | 1 | $35B |
|
||
| Utilities | 1 | $30B |
|
||
| Industrial Machinery | 1 | $19B |
|
||
Price history
+0.0% since first listed3 events — show timeline
- 2026-05-05 Pending — TMLS
- 2026-05-01 Listed $180,000 TMLS
- 2026-04-22 Sold (Public Records) $180,000 Public Records
Property tax history
+5.5%/yrLatest (2025): $1,389 · +77.1% YoY. Source: county tax records.
Cash-flow waterfall
monthlySold comps — $/sqft
last 12 mo · ≤1 miLoading sold comps…