 Multi-family
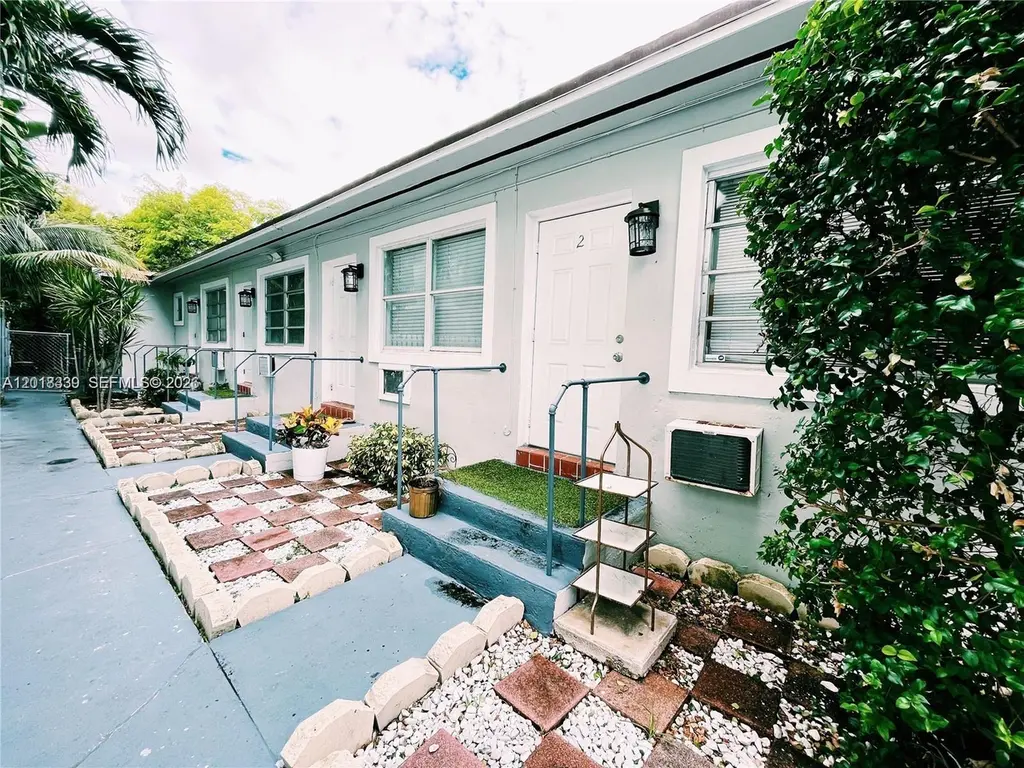
7630 Byron Ave · Miami Beach, FL
Flood risk 9/10 · Severe
- FEMA flood zone
- AE
- Chance of flooding over 30 yrs
- 0.99%
- Est. flood insurance / yr
- $1,737 – $8,500
Fire risk 1/10 · Minimal
- Est. fire insurance / yr
- $947 – $1,759
Heat risk 10/10 · Severe
- Hot days now (above 103°F)
- 7 days/yr
- Hot days in 30 yrs
- 30 days/yr
Wind risk 10/10 · Severe
- Chance of severe wind over 30 yrs
- 99.0%
Air-quality risk 2/10 · Minimal
- Unhealthy air days now
- 1 days/yr
- Unhealthy air days in 30 yrs
- 2 days/yr
Risk factors via First Street. Map © Google.
Why this score? — see what drove the B- grade
The composite is a weighted blend of 9 inputs, each scored 0–100. Each bar is that input's sub-score; the figure is the points it added to the 100-point composite (weight × sub-score).
- Cash flow +30.0/30.0
- DSCR +10.0/10.0
- 1% rule +8.8/10.0
- ARV discount +7.5/15.0
- Schools +4.2/10.0
- Livability +4.0/5.0
- Rent growth +2.6/5.0
- Condition / age +2.5/5.0
- Appreciation +0.0/10.0
$1,575,000
🖨 Deal sheet (PDF) 📄 Offer letter ✓ Due diligence
Multi-family units
County records classify this as Multi-Family (5+ Unit). Listing-text estimate: 1 unit. estimate disagrees with records
5+ unit building — per-unit beds/baths from public records are typically unavailable; the breakdown below (if shown) is an estimate from the listing text.
Listing remarks
Prime multifamily investment opportunity in the heart of Miami Beach. This fully renovated income-producing property features 6 turnkey units, including four spacious 1-bedroom/1-bath residences and two studio apartments. Ideally located just steps from the beach, Collins Avenue, world-class dining, shopping, and entertainment. Strong cash flow with current gross rental income exceeding $11.300/month and significant upside potential driven by high rental demand in the area. Upgrades throughout provide low-maintenance ownership and excellent tenant appeal. Perfect for investors seeking stable income, short- or long-term rental potential, and prime Miami Beach real estate appreciation. Seller
Key facts
- Turnkey units
- Steps from the beach
- High rental demand
Tags
Property features AI
Finance
- Other: Rent includes hot water and water
- Financial info: Annual tax amount reported
Exterior
- Utilities: Public sewer; Cable not available
- Home design: Single-story; Resale property; Shingle roof; Block construction
- Construction: Built previously (resale); Block construction; Shingle roof
- Exterior features: Less than quarter acre lot
Interior
- Flooring: Laminate
- Heating & cooling: Wall furnace heating; Wall/window cooling units
- Interior features: Laminate flooring
Neighborhood map
What this means for you Summary
Snapshot
- This is a 6-bed/6.0-bath multifamily listed at $1.57M.
Deal economics
- At list price, monthly cash flow is $6k ($73k/yr) — positive.
- The deal already cash-flows at list — no discount required.
- Meets the 1% rule at list price ($22k rent vs $1.57M).
- Recommended offer: $1.53M (3.0% below list) — sets the bar for market timing.
- Cap rate 11.2% vs local median 1.5% in Miami Beach — top-decile yield for the area; either an underpriced asset or a hidden risk that comps aren't pricing in. Stress-test before assuming the spread holds.
Location & tenants
- Location reads 80/100 on livability (#108 in FL, #1,672 nationally) — a professional / high-income tenant draw. Strengths: crime A+, commute A+, health & safety A+; Watch: housing C-, amenities D-, cost of living F.
- Miami-Dade (suburban): math 45% / reading 54% proficiency, ranked #40 of 73 in FL (top 55%) — families likely to look elsewhere, expect single-tenant / working-renter base with shorter leases; 64% free/reduced lunch — lower-income household profile, screen leases tightly.
- Zoned schools: Biscayne Beach Elementary School (math 42% / reading 49%, grade D-, #1,247 of 2,144 statewide, top 59%, 578 students, 63% FRL); Miami Beach Nautilus Middle School (math 46% / reading 58%, grade C+, #217 of 571 statewide, top 40%, 918 students, 44% FRL); Miami Beach Senior High School (math 21% / reading 48%, grade F, #386 of 667 statewide, top 59%, 2,175 students, 40% FRL) — zoned schools average 49% FRL vs 64% district-wide (15 pts lower); this property's tenant base skews higher-income than the district average.
- Market conditions: Rents flat; 648 active listings in the ZIP; 9 comparable units currently listed for rent nearby; rentals at typical pace (median 26d on market — plan ~3-4 weeks tenant-placement turnaround); 10,051 units permitted in Miami-Dade County in 2024 (7,758 in 5+ unit buildings).
Forward outlook
- Local home prices are declining (-3.0%/yr); year-one equity from $11k of loan paydown is wiped out by about $47k of value loss. Plan a longer hold.
- Miami-Dade County population projected at +28% by 2050 — long-run rental-demand tailwind backs the buy-and-hold thesis.
- At projected returns (-3.0% appreciation + 0.4% rent growth), your $441k cash investment doubles in ~10 years — after that, you're playing with house money.
Negotiation context
- It's been on market 38 days — a 3% lower offer ($1.53M) is reasonable based on typical stale-listing flexibility.
- 4 sale attempts since 5y ago with the ask held roughly flat each time — persistent listings suggest the price (not the market) is what's stuck; bring a comps-based counter.
- Current owner paid $765k; list at $1.57M implies a 106% gain — meaningful room to come down on a strong offer.
Risks & watch-outs
- Watch-outs: flood insurance adds $427/mo; built in 1950 — expect roof / HVAC / electrical / plumbing capex.
- Climate carrying-cost: in FEMA flood zone AE (mandatory federal flood insurance); severe wind risk, 99% chance of damaging wind over 30y; extreme-heat days projected 7→30/yr by 2055 (HVAC capex compounding) — expect insurance premiums to compound above CPI over the hold.
Questions for the listing agent
- It's been on market 38 days. Have you received any prior offers? Is the seller open to a 3% concession, seller financing, or rate buy-down credit?
- Built in 1950 — when were the roof, HVAC, electrical panel, plumbing, and water heater last replaced?
- What's the actual annual flood-insurance premium (NFIP or private), and is the property in a SFHA with mandatory coverage?
- Is there a deadline driving the sale (1031 exchange, divorce, estate, relocation)? That informs how much negotiation room exists.
- Schools are A-rated — typically a magnet for longer-tenancy family renters. What's the average tenant stay here, and is there a school-zone premium baked into asking?
- What's the average days-on-market for RENTAL listings here right now (not sales)? A rising rental-DOM trend means longer vacancies and softer asking-rent achievability than the comps imply.
- What's the recent tenant-quality profile in this submarket — average credit score on applications, eviction rate, late-payment / NSF rate, and stable-employment percentage? A property-management company in the area should have these aggregated.
- How much new apartment / multifamily construction is in the pipeline within 1–3 miles? Heavy new supply (>2% of stock underway) typically softens rents 12–24 months out; light construction supports rent growth.
Investment metrics
- 1% rule
- 1.38% ✓
- Cap rate
- 11.23%
- Cash-on-cash
- 17.64%
- DSCR
- 1.78
- GRM
- 6.0
CMA / ARV
No comps found within radius.
Projected returns pro-forma
-3.0% appreciation · 0.44% rent growth · sell at horizon
- IRR
- 4.6%
- Equity multiple
- 1.17×
- Total profit
- $76,442
- Equity at exit
- $234,838
- IRR
- 11.5%
- Equity multiple
- 1.80×
- Total profit
- $352,495
- Equity at exit
- $136,177
Cash invested: $441,000 (down + closing). Projections, not guarantees.
Landlord ↔ Tenant lean methodology
- Overall (STATE)
- 87 Strongly Landlord-Friendly
- State Florida
- 87 Strongly Landlord-Friendly · R+3
- County
- — inherits STATE
- City
- — inherits STATE
ZIP-level market 33141
- Rents YoY
- 0.4%
- Active inventory
- 648
- Price-to-rent
- 36.3×
Monthly cashflow live
- Estimated rent
- $21,719 medium interval (Pro) →
- Mortgage (P&I)
- −$8,259
- Tax from tax record
- −$1,759 /mo · $21,110/yr
- Insurance
- −$656
- Flood insurance flood zone
- −$427 /mo · $5,118/yr
- HOA
- −$0
- Vacancy / Maint / Mgmt
- −$4,561
- Net cashflow
- $6,057
Break-even live
Sensitivity live
| Price | -10% $6,948 | -5% $6,502 | +0% $6,057 | +5% $5,611 | +10% $5,165 |
|---|---|---|---|---|---|
| Rent | -10% $4,341 | -5% $5,199 | +0% $6,057 | +5% $6,915 | +10% $7,772 |
| Rate | -1.0pp $6,850 | -0.5pp $6,457 | base $6,057 | +0.5pp $5,648 | +1.0pp $5,233 |
6-unit breakdown (identical units grouped — click to expand)
| Units | Beds | Baths | Est. rent |
|---|---|---|---|
| 4× units | 1 | 1 | $14,480 |
| #1 | 1 | 1 | $3,620 |
| #2 | 1 | 1 | $3,620 |
| #3 | 1 | 1 | $3,620 |
| #4 | 1 | 1 | $3,620 |
| 2× units | 1 | 0 | $7,240 |
| #5 | 1 | 0 | $3,620 |
| #6 | 1 | 0 | $3,620 |
| Total (6 units) | $21,719 | ||
UW: 25.0% down · 7.5% · 30yr · 1.5% tax · 5.0% vac · 8.0% maint · 8.0% mgmt
Financing live
Cash to close
- Down payment
- $393,750
- Closing costs
- $47,250
- Reserves months
- —
- Total cash needed
- —
Loan-product check · same deal, 3 products live
Conventional
25% down · 7.5% · 30yr
- Down + closing
- —
- Monthly P&I
- —
- Monthly cashflow
- —
- DSCR
- —
- Eligible?
- —
Personal DTI + credit; lowest rate.
DSCR
20% down · 8.5% · 30yr
- Down + closing
- —
- Monthly P&I
- —
- Monthly cashflow
- —
- DSCR
- —
- Eligible?
- —
No personal income docs; deal must DSCR.
Hard money
10% down · 12.0% · 12mo
- Down + closing
- —
- Monthly P&I
- —
- Monthly cashflow
- —
- DSCR
- —
- Eligible?
- —
Short-term bridge; refi at stabilization.
Rent comps 9 comps
| Address | Beds | Baths | Sqft | Rent | $/sqft | DOM | Units | Dist |
|---|---|---|---|---|---|---|---|---|
| 7811 Carlyle Ave Miami Beach, FL | 6.0 | 5.5 | 3405 | $50,000 | $14.68 | 25d | 1 | 0.10mi |
| 1055 Stillwater Dr Miami Beach, FL | 6.0 | 5.5 | 4787 | $29,000 | $6.06 | 22d | 1 | 0.67mi |
| 1131 Stillwater Dr Unit SFH Miami Beach, FL | 5.0 | 3.5 | 3980 | $19,000 | $4.77 | 25d | 1 | 0.71mi |
| 1151 Stillwater Dr Miami Beach, FL | 5.0 | 3.0 | 3237 | $18,000 | $5.56 | 18d | 1 | 0.72mi |
| 1625 Daytonia Rd Miami Beach, FL | 5.0 | 3.0 | 2690 | $18,000 | $6.69 | 25d | 1 | 0.81mi |
| 1249 Biscaya Dr Surfside, FL | 5.0 | 4.5 | 4486 | $26,900 | $6.00 | 25d | 1 | 0.86mi |
| 7972 Biscayne Point Cir Miami Beach, FL | 5.0 | 5.0 | 3989 | $60,000 | $15.04 | 25d | 1 | 1.17mi |
| 9380 Bay Dr Surfside, FL | 5.0 | 5.0 | 4737 | $35,000 | $7.39 | 25d | 1 | 1.46mi |
| 9221 E Bay Harbor Dr Unit 511/512 Bay Harbor Islands, FL | 7.0 | 7.5 | 4565 | $27,500 | $6.02 | 0d | 1 | 1.47mi |
Listing history 25 events
-
2026-06-21days on market $1,575,000 Active 38 DOM
-
2026-06-18days on market $1,575,000 Active 35 DOM
-
2026-06-17days on market $1,575,000 Active 34 DOM
-
2026-06-16days on market $1,575,000 Active 33 DOM
-
2026-06-15days on market $1,575,000 Active 32 DOM
-
2026-06-13days on market $1,575,000 Active 30 DOM
-
2026-06-09days on market $1,575,000 Active 26 DOM
-
2026-06-08days on market $1,575,000 Active 25 DOM
-
2026-06-07days on market $1,575,000 Active 24 DOM
-
2026-06-04days on market $1,575,000 Active 21 DOM
-
2026-06-03days on market $1,575,000 Active 20 DOM
-
2026-06-02days on market $1,575,000 Active 19 DOM
-
2026-06-01days on market $1,575,000 Active 18 DOM
-
2026-05-31days on market $1,575,000 Active 17 DOM
-
2026-05-13$1,575,000 Active
-
2022-03-22historical
-
2022-02-08$1,495,000 Active
-
2022-01-26historical
-
2021-10-27$1,495,000 Active
-
2021-08-19historical
-
2021-06-28price $1,495,000
-
2021-04-20$1,500,000 Active
-
2019-06-07soldstatus $765,000
-
2000-02-24soldstatus $192,100
-
1984-09-01soldstatus $124,500
ⓘ Source: listings_history table (triggers on properties + properties_extension) + one-shot
backfill from property_details.listing_events for pre-trigger history.
Tax reassessment forecast FL · Resets to sale price
- Current annual tax
- $21,110 · $1,759/mo
- Projected year-2 tax
- $21,110 · $1,759/mo
- Expected delta
- $0/yr ($0/mo · 0.0%)
ⓘ Screening estimate from a state-policy table — verify with the county assessor before closing.
Climate risk First Street
- Flood 9/10 Extreme FEMA zone AE · 99% chance over 30 yrs
- Wildfire 1/10 Low
- Heat 10/10 Extreme 7 d/yr ≥103°F today · 30 d/yr by 30 yrs out
- Wind 10/10 Extreme 99% chance of damaging wind over 30 yrs
- Air quality 2/10 Low 1 unhealthy d/yr today · 2 by 30 yrs out
Nearby sold comps map
Loading sold comps map…
Walkable amenities ~0.75 mi
Loading nearby amenities…
Taxation est. · year 1
- Rental income
- $260,628
- − Mortgage interest
- −$88,224
- − Property taxes
- −$21,110
- − Insurance
- −$12,994
- − Repairs & maintenance
- −$20,850
- − Management
- −$20,850
- − Depreciation
- −$45,818
- Taxable income
- $50,782
- Est. tax owed @ 24.0%
- −$12,188
- After-tax cash flow
- $60,492/yr
For passive investors: Depreciation is non-cash, so a rental often shows a tax loss while cash-flowing — sheltering income. Rental losses are passive: they offset passive income freely, and up to $25,000/yr can offset ordinary (W-2) income if you actively participate and your MAGI is under $100k (phasing out to $0 by $150k); unused losses carry forward. On sale, claimed depreciation is recaptured at up to 25%, and gains may owe capital-gains tax (a 1031 exchange can defer both). Figures are a year-1 estimate at your 24.0% rate — not tax advice; consult a CPA.
Schools (NCES district)
- District
- Miami-Dade
- NCES district ID
- 1200390
- Math proficiency
- 45% ▼ -16.00%
- Reading proficiency
- 54% ▼ -5.00%
- Median HH income
- $43,928
- Composite
- 41.76/100
- National rank
- #3397
- State rank
- #40 of 73 in FL
Livability — Miami Beach
- Score
- 80/100
- State rank
- #108
- US rank
- #1672
Category grades
Schools grade is shown separately in the Schools card above.
Census & demographics
- Census place
- Miami Beach, FL
- County
- Miami-Dade County · 2,697,751 people
- City population
- 90,533
- Metro
- Miami-Fort Lauderdale-Pompano Beach, FL
- Population (ZIP)
- 36,438
- Household income
- $68,738
- Rent vs Own
- Severe rent burden
- 3521.0
Population outlook (Miami-Dade County) Hauer SSP2
- Today (2025)
- 3,126,439 people
- By 2030
- 3,325,765 · +6.4%
- By 2040
- 3,697,561 · +18.3%
- By 2050
- 4,012,134 · +28.3%
- By 2075
- 4,605,612 · +47.3%
- By 2100
- 4,866,598 · +55.7%
Race, ethnicity, and origin ACS 2023
- Neighborhood character
- Predominantly Hispanic (67%)
- Race & ethnicity
- Hispanic / Latino 67% Two or more races 36% White 20% Black 4% Asian 3%
- Hispanic origin (detail)
- Mexican 1% Puerto Rican 3% Cuban 27% Salvadoran 6%
- Common ancestry
- Scotch-Irish 2% Romanian 2% Armenian 1%
- Foreign-born
- 62% · Canada, Jamaica, Dominican Republic
- Languages at home
- 18% English-only · Spanish 69% Other Indo-European 4% French/Haitian/Cajun 3%
Political lean MEDSL · Miami-Dade
- 2024 margin
- R (+11.4) · D 43.9% · R 55.4%
- 2008→2024 swing
- -27.6pp toward R · 2008: 16.1pp · 2024: -11.4pp
- All cycles
- 2024: R+11.4 2020: D+7.3 2016: D+29.6 2012: D+23.7 2008: D+16.1
Not yet ingested
- Civics
- —
Market trends
- HPI YoY
- ▼ -472.71%
- Current HPI
- 336.7298
- Rent YoY
- ▲ 0.44%
- Metro
- Miami-Fort Lauderdale-Pompano Beach, FL
- State GDP YoY
- ▲ 3.28%
- F500 in state
- 36
Industry mix (Fortune 500 HQ in FL)
| Industry | F500 HQs | Revenue |
|---|---|---|
| Industrial Technology | 2 | $29B |
|
||
| Insurance | 2 | $17B |
|
||
| Retail | 1 | $60B |
|
||
| Technology Distribution | 1 | $58B |
|
||
| Homebuilding | 1 | $35B |
|
||
| Technology Manufacturing | 1 | $35B |
|
||
Price history
+1165.1% since first listed11 events — show timeline
- 2026-05-13 Listed $1,575,000 MARMLS
- 2022-03-22 Listing Removed — MARMLS
- 2022-02-08 Listed $1,495,000 MARMLS
- 2022-01-26 Listing Removed — MARMLS
- 2021-10-27 Listed $1,495,000 MARMLS
- 2021-08-19 Listing Removed — MARMLS
- 2021-06-28 Price Changed $1,495,000 MARMLS
- 2021-04-20 Listed $1,500,000 MARMLS
- 2019-06-07 Sold (Public Records) $765,000 Public Records
- 2000-02-24 Sold (Public Records) $192,100 Public Records
- 1984-09-01 Sold (Public Records) $124,500 Public Records
Property tax history
+6.5%/yrLatest (2025): $21,110 · +8.1% YoY. Source: county tax records.
Cash-flow waterfall
monthlySold comps — $/sqft
last 12 mo · ≤1 miLoading sold comps…