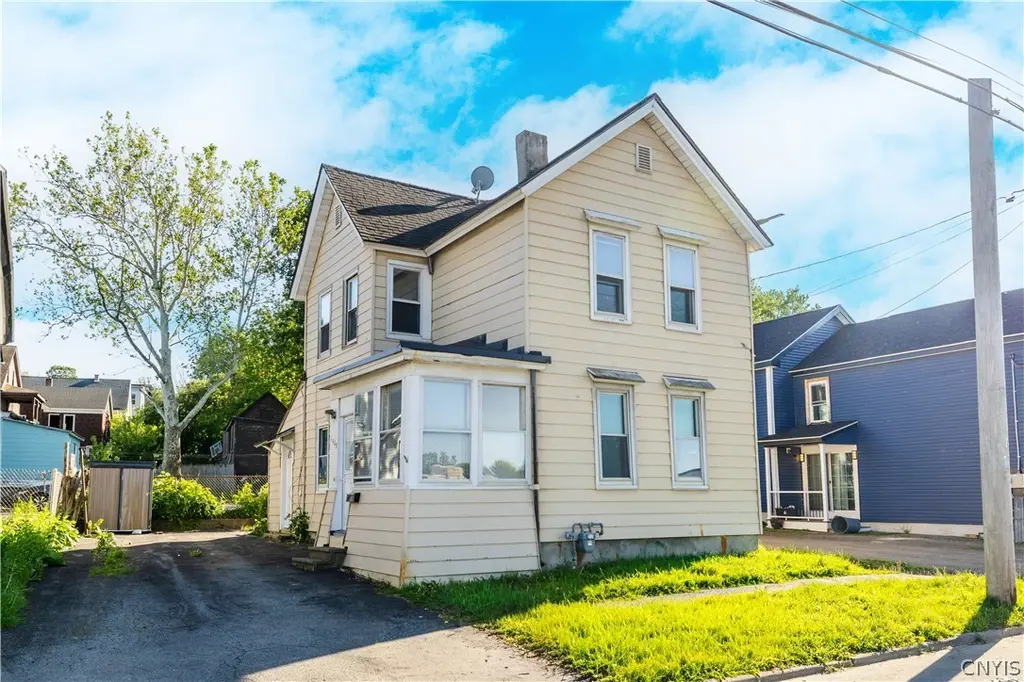
1409 Erie St · Utica, NY
Flood risk 1/10 · Minimal
- FEMA flood zone
- X (unshaded)
- Chance of flooding over 30 yrs
- 0.0%
- Est. flood insurance / yr
- $473 – $860
Fire risk 1/10 · Minimal
- Est. fire insurance / yr
- $691 – $1,283
Heat risk 3/10 · Minor
- Hot days now (above 97°F)
- 7 days/yr
- Hot days in 30 yrs
- 16 days/yr
Wind risk 1/10 · Minimal
- Chance of severe wind over 30 yrs
- 1.0%
Air-quality risk 2/10 · Minimal
- Unhealthy air days now
- 0 days/yr
- Unhealthy air days in 30 yrs
- 2 days/yr
Risk factors via First Street. Map © Google.
Why this score? — see what drove the B+ grade
The composite is a weighted blend of 9 inputs, each scored 0–100. Each bar is that input's sub-score; the figure is the points it added to the 100-point composite (weight × sub-score).
- Cash flow +30.0/30.0
- ARV discount +13.6/15.0
- 1% rule +10.0/10.0
- DSCR +10.0/10.0
- Livability +4.0/5.0
- Schools +2.9/10.0
- Rent growth +2.5/5.0
- Condition / age +2.5/5.0
- Appreciation +0.0/10.0
$105,000
🖨 Deal sheet (PDF) 📄 Offer letter ✓ Due diligence
Listing remarks MLS
* * Step Into Charm and Serenity in This Beautifully Refreshed Home! * * Immerse yourself in the inviting ambiance of this lovingly updated single-family retreat. A contemporary palette and new flooring flow effortlessly through each room, with sunlight streaming through energy-efficient vinyl windows to create a bright, uplifting atmosphere. The updated kitchen shines with crisp white cabinets, adding a touch of modern elegance and functionality. Start your mornings or unwind in the cozy enclosed porch—your perfect nook for coffee, reading, or quiet reflection. Upstairs, discover a versatile walk-through room, ideal as an extra bedroom or private home office. With first-floor washer and dryer hookups, a 100-amp circuit breaker, a reliable Utica boiler, and a private driveway, this home blends thoughtful details with classic charm, making it ready to welcome you!
Key facts
- Off street parking
- Updated interior
- Enclosed porch
Tags
Property features AI
Exterior
- Parking: No garage
- Utilities: Electricity connected (circuit breakers); Public water connected; Sewer connected
- Home design: 2-story house; Resale property; City street frontage; Rectangular residential lot; Near public transit
- Construction: Spray foam insulation; Vinyl siding; Copper plumbing; Asphalt roof; Rolled/Hot Mop roofing; Block and stone foundation; Built as existing structure
- Exterior features: Blacktop driveway; Enclosed porch; Open porch; Partial fencing; Shed(s)/storage
Interior
- Kitchen: Gas oven; Gas range; Range hood; Exhaust fan; Refrigerator
- Bedrooms: One bedroom on the main level; Two additional bedrooms on the second level; One bedroom on the first level
- Flooring: Laminate flooring; Varies
- Bathrooms: One full bathroom; One half bathroom; One main-level bathroom
- Heating & cooling: Heating present; Electric heating; Gas heating; Radiator heating; Steam heating
- Interior features: Thermal windows; Eat-in kitchen; Separate/formal living room; Bedroom on main level; Partial basement
- Laundry & utility: Gas water heater
Neighborhood map
What this means for you Summary
Snapshot
- This is a 3-bed/1.5-bath single-family listed at $105k.
Deal economics
- At list price, monthly cash flow is $824 ($10k/yr) — positive.
- The deal already cash-flows at list — no discount required.
- Meets the 1% rule at list price ($2k rent vs $105k).
- Recommended offer: $103k (1.5% below list) — sets the bar for market timing.
- Cap rate 15.7% vs local median 7.7% in Utica — top-decile yield for the area; either an underpriced asset or a hidden risk that comps aren't pricing in. Stress-test before assuming the spread holds.
Location & tenants
- Location reads 80/100 on livability (#104 in NY, #1,589 nationally) — a professional / high-income tenant draw. Strengths: commute A+, cost of living A+, housing A+; Watch: employment D, schools D-, crime F.
- Utica City School District (urban): math 33% / reading 38% proficiency, ranked #562 of 590 in NY (top 95%) — families likely to look elsewhere, expect single-tenant / working-renter base with shorter leases; 71% free/reduced lunch — lower-income household profile, screen leases tightly.
- Market conditions: 150 active listings in the ZIP; 8 comparable units currently listed for rent nearby; rentals lingering (median 45d on market — plan ~5-8 weeks vacancy on turnover, expect pricing pressure); 100% of comp listings sitting > 30 days — soft ceiling on asking rent; 204 units permitted in Oneida County in 2024 (68 in 5+ unit buildings).
- This rent runs 39% of the median local income ($58k/yr) — at the standard rent-burdened threshold; future hikes will face affordability resistance.
Forward outlook
- Local home prices are declining (-3.0%/yr); year-one equity from $726 of loan paydown is wiped out by about $3k of value loss. Plan a longer hold.
- Oneida County population projected at -12% by 2050 — secular population decline; favor cash flow + early exit over multi-decade hold.
- At projected returns (-3.0% appreciation + 3.0% rent growth), your $29k cash investment doubles in ~4 years — after that, you're playing with house money.
Negotiation context
- It's been on market 18 days — a 2% lower offer ($103k) is reasonable based on typical stale-listing flexibility.
- 4 sale attempts since 11y ago with the ask held roughly flat each time — persistent listings suggest the price (not the market) is what's stuck; bring a comps-based counter.
- Current owner paid $90k; 17% above their basis — modest negotiation headroom, anchor on the comps not their cost.
Risks & watch-outs
- Watch-outs: built in 1890 — expect roof / HVAC / electrical / plumbing capex.
Questions for the listing agent
- Built in 1890 — when were the roof, HVAC, electrical panel, plumbing, and water heater last replaced?
- Is there a deadline driving the sale (1031 exchange, divorce, estate, relocation)? That informs how much negotiation room exists.
- Schools are D-rated, which usually means shorter tenancies and higher turnover. Who's the typical renter profile here, and what's been the actual vacancy rate?
- Crime grade is F in this area — have there been break-ins, vandalism, or insurance claims at this property in the last 3 years? What carrier currently insures it and at what premium?
- What's the average days-on-market for RENTAL listings here right now (not sales)? A rising rental-DOM trend means longer vacancies and softer asking-rent achievability than the comps imply.
- What's the recent tenant-quality profile in this submarket — average credit score on applications, eviction rate, late-payment / NSF rate, and stable-employment percentage? A property-management company in the area should have these aggregated.
- How much new for-sale + rental construction is in the pipeline within 1–3 miles? Heavy new supply typically softens prices + rents 12–24 months out; constrained supply supports both.
Investment metrics
- 1% rule
- 1.79% ✓
- Cap rate
- 15.71%
- Cash-on-cash
- 33.62%
- DSCR
- 2.50
- GRM
- 4.6
CMA / ARV
- ARV (on-the-fly)
- $121,426
- Comps found
- 12
Show comp detail 12 sales within ~0.75 mi
| Address | Dist | Beds/Ba | Sqft | Sold | Price | $/sf | Match |
|---|---|---|---|---|---|---|---|
| 1409 Erie St | 0.00mi | 2/1.5 (-1) | 1,114 (0%) | 9mo | $90,000 | $81 | 88 |
| 6 Bryant St | 0.21mi | 2/2.0 (-1) | 1,084 (-3%) | 1mo | $104,680 | $97 | 78 |
| 1007 Warren St | 0.49mi | 3/1.5 | 1,133 (+2%) | 8mo | $45,000 | $40 | 67 |
| 11 Bryant St | 0.19mi | 2/1.0 (-1) | 999 (-10%) | 6mo | $109,000 | $109 | 61 |
| 2133 Mcbride Ave | 0.60mi | 3/1.0 | 1,200 (+8%) | 8mo | $154,500 | $129 | 51 |
| 1216 Oak St | 0.71mi | 3/1.0 | 1,196 (+7%) | 3mo | $69,000 | $58 | 50 |
| 2206 Caroline St | 0.74mi | 4/1.0 (+1) | 1,155 (+4%) | 7mo | $212,000 | $184 | 46 |
| 1209 Ney Ave | 0.74mi | 3/1.0 | 1,250 (+12%) | 1mo | $162,500 | $130 | 42 |
| 913 Champlin Ave | 0.74mi | 3/1.5 | 1,252 (+12%) | 7mo | $135,000 | $108 | 39 |
| 1310 Oak St | 0.70mi | 3/1.0 | 1,254 (+13%) | 7mo | $160,000 | $128 | 38 |
| 1308 Maple St | 0.65mi | 3/2.0 | 1,275 (+14%) | 10mo | $205,000 | $161 | 36 |
| 1212 Oak St | 0.72mi | 2/1.0 (-1) | 973 (-13%) | 6mo | $26,000 | $27 | 33 |
Match score weights: distance 35% · size 25% · config 20% · recency 20%. Top-matched comps best support the ARV.
Projected returns pro-forma
-3.0% appreciation · 3.0% rent growth · sell at horizon
- IRR
- 28.9%
- Equity multiple
- 2.21×
- Total profit
- $35,443
- Equity at exit
- $15,656
- IRR
- 36.3%
- Equity multiple
- 4.35×
- Total profit
- $98,382
- Equity at exit
- $9,078
Cash invested: $29,400 (down + closing). Projections, not guarantees.
Landlord ↔ Tenant lean methodology
- Overall (STATE)
- 15 Strongly Tenant-Friendly
- State New York
- 15 Strongly Tenant-Friendly · D+10
- County
- — inherits STATE
- City
- — inherits STATE
ZIP-level market 13502
- Home prices YoY
- -12.1%
- Active inventory
- 150
- Price-to-rent
- 4.6×
Monthly cashflow live
- Estimated rent
- $1,882 high interval (Pro) →
- Mortgage (P&I)
- −$551
- Tax from tax record
- −$69 /mo · $825/yr
- Insurance
- −$44
- HOA
- −$0
- Vacancy / Maint / Mgmt
- −$395
- Net cashflow
- $824
Break-even live
Sensitivity live
| Price | -10% $883 | -5% $854 | +0% $824 | +5% $794 | +10% $764 |
|---|---|---|---|---|---|
| Rent | -10% $675 | -5% $749 | +0% $824 | +5% $898 | +10% $972 |
| Rate | -1.0pp $877 | -0.5pp $850 | base $824 | +0.5pp $797 | +1.0pp $769 |
UW: 25.0% down · 7.5% · 30yr · 1.5% tax · 5.0% vac · 8.0% maint · 8.0% mgmt
Financing live
Cash to close
- Down payment
- $26,250
- Closing costs
- $3,150
- Reserves months
- —
- Total cash needed
- —
Loan-product check · same deal, 3 products live
Conventional
25% down · 7.5% · 30yr
- Down + closing
- —
- Monthly P&I
- —
- Monthly cashflow
- —
- DSCR
- —
- Eligible?
- —
Personal DTI + credit; lowest rate.
DSCR
20% down · 8.5% · 30yr
- Down + closing
- —
- Monthly P&I
- —
- Monthly cashflow
- —
- DSCR
- —
- Eligible?
- —
No personal income docs; deal must DSCR.
Hard money
10% down · 12.0% · 12mo
- Down + closing
- —
- Monthly P&I
- —
- Monthly cashflow
- —
- DSCR
- —
- Eligible?
- —
Short-term bridge; refi at stabilization.
Rent comps 8 comps
| Address | Beds | Baths | Sqft | Rent | $/sqft | DOM | Units | Dist |
|---|---|---|---|---|---|---|---|---|
| 1224 Whitesboro St Unit 1 Utica, NY | 3.0 | 1.0 | 1100 | $1,125 | $1.02 | 45d | 1 | 0.13mi |
| 11 Noyes St Unit 4 Utica, NY | 2.0 | 1.0 | 1000 | $1,125 | $1.12 | 45d | 1 | 0.97mi |
| 4 1st St Yorkville, NY | 3.0 | 1.0 | 888 | $2,100 | $2.36 | 45d | 1 | 1.10mi |
| 239 Genesee St Utica, NY | 1.0–2.0 | 1.0–2.0 | 1200 | $2,700 | $2.25 | 45d | 15 | 1.12mi |
| 119 Hotel St Utica, NY | 1.0–2.0 | 1.0–2.0 | 1053 | $2,300 | $2.18 | 45d | 14 | 1.27mi |
| 221 Elizabeth St #2 Utica, NY | 2.0 | 1.0 | 1100 | $2,000 | $1.82 | 45d | 1 | 1.30mi |
| 1503 Fox Pl Utica, NY | 3.0 | 1.0 | 1119 | $2,000 | $1.79 | 45d | 1 | 1.36mi |
| 9646 River Rd Marcy, NY | 2.0 | 1.0 | 768 | $1,600 | $2.08 | 45d | 1 | 1.49mi |
Listing history 14 events
-
2026-06-19days on market $105,000 Active 18 DOM
-
2026-06-18days on market $105,000 Active 17 DOM
-
2026-06-17days on market $105,000 Active 16 DOM
-
2026-06-16days on market $105,000 Active 15 DOM
-
2026-06-15days on market $105,000 Active 14 DOM
-
2026-06-14days on market $105,000 Active 12 DOM
-
2026-06-13days on market $105,000 Active 11 DOM
-
2026-06-10days on market $105,000 Active 9 DOM
-
2026-06-09days on market $105,000 Active 8 DOM
-
2026-06-08days on market $105,000 Active 7 DOM
-
2026-06-07days on market $105,000 Active 6 DOM
-
2026-06-03days on market $105,000 Active 2 DOM
-
2026-06-01remarks 687-char remark
-
2026-06-01$105,000 Active 1 DOM
ⓘ Source: listings_history table (triggers on properties + properties_extension) + one-shot
backfill from property_details.listing_events for pre-trigger history.
Tax reassessment forecast NY · Partial reset (capped growth)
- Current annual tax
- $825 · $69/mo
- Projected year-2 tax
- $1,300 · $108/mo
- Expected delta
- +$475/yr (+$40/mo · 57.5%)
ⓘ Screening estimate from a state-policy table — verify with the county assessor before closing.
Climate risk First Street
- Flood 1/10 Low FEMA zone X (unshaded) · 0% chance over 30 yrs
- Wildfire 1/10 Low
- Heat 3/10 Moderate 7 d/yr ≥97°F today · 16 d/yr by 30 yrs out
- Wind 1/10 Low 100% chance of damaging wind over 30 yrs
- Air quality 2/10 Low 0 unhealthy d/yr today · 2 by 30 yrs out
Nearby sold comps map
Loading sold comps map…
Walkable amenities ~0.75 mi
Loading nearby amenities…
Taxation est. · year 1
- Rental income
- $22,586
- − Mortgage interest
- −$5,882
- − Property taxes
- −$825
- − Insurance
- −$525
- − Repairs & maintenance
- −$1,807
- − Management
- −$1,807
- − Depreciation
- −$3,055
- Taxable income
- $8,686
- Est. tax owed @ 24.0%
- −$2,085
- After-tax cash flow
- $7,801/yr
For passive investors: Depreciation is non-cash, so a rental often shows a tax loss while cash-flowing — sheltering income. Rental losses are passive: they offset passive income freely, and up to $25,000/yr can offset ordinary (W-2) income if you actively participate and your MAGI is under $100k (phasing out to $0 by $150k); unused losses carry forward. On sale, claimed depreciation is recaptured at up to 25%, and gains may owe capital-gains tax (a 1031 exchange can defer both). Figures are a year-1 estimate at your 24.0% rate — not tax advice; consult a CPA.
Schools (NCES district)
- District
- Utica City School District
- NCES district ID
- 3629370
- Math proficiency
- 33% ▼ -7.00%
- Reading proficiency
- 38% ▲ 2.00%
- Median HH income
- $31,834
- Composite
- 29.01/100
- National rank
- #6613
- State rank
- #562 of 590 in NY
Livability — Utica
- Score
- 80/100
- State rank
- #104
- US rank
- #1589
Category grades
Schools grade is shown separately in the Schools card above.
Census & demographics
- Census place
- Utica, NY
- County
- Oneida County · 89,710 people
- City population
- 72,968
- Metro
- Utica-Rome, NY
- Population (ZIP)
- 34,037
- Household income
- $57,835
- Rent vs Own
- Severe rent burden
- 1604.0
Population outlook (Oneida County) Hauer SSP2
- Today (2025)
- 225,223 people
- By 2030
- 220,384 · -2.1%
- By 2040
- 209,071 · -7.2%
- By 2050
- 197,920 · -12.1%
- By 2075
- 175,541 · -22.1%
- By 2100
- 148,491 · -34.1%
Race, ethnicity, and origin ACS 2023
- Neighborhood character
- Predominantly White (71%)
- Race & ethnicity
- White 71% Hispanic / Latino 11% Black 9% Two or more races 7% Asian 5%
- Hispanic origin (detail)
- Mexican 2% Puerto Rican 5% Dominican 2%
- Common ancestry
- Romanian 11% Lithuanian 3% American 2%
- Foreign-born
- 12% · Canada, Philippines, China
- Languages at home
- 81% English-only · Spanish 7% Russian/Polish/Slavic 4% Other Asian/Pacific 3%
Political lean MEDSL · Oneida
- 2024 margin
- Strong R (+21.3) · D 39.4% · R 60.6%
- 2008→2024 swing
- -15.2pp toward R · 2008: -6.1pp · 2024: -21.3pp
- All cycles
- 2024: R+21.3 2020: R+15.5 2016: R+21.1 2012: R+5.3 2008: R+6.1
Not yet ingested
- Civics
- —
Market trends
- HPI YoY
- ▼ -50.76%
- Current HPI
- 368.3955
- Rent YoY
- —
- Metro
- Utica-Rome, NY
- State GDP YoY
- ▲ 2.60%
- F500 in state
- 92
Industry mix (Fortune 500 HQ in NY)
| Industry | F500 HQs | Revenue |
|---|---|---|
| Financial Services | 10 | $950B |
|
||
| Consumer Goods | 9 | $162B |
|
||
| Insurance | 4 | $225B |
|
||
| Telecommunications | 2 | $144B |
|
||
| Pharmaceuticals | 2 | $112B |
|
||
| Media / Entertainment | 2 | $69B |
|
||
Price history
+356.5% since first listed9 events — show timeline
- 2026-06-01 Listed $105,000 CNYIS
- 2025-09-29 Sold (MLS) $90,000 CNYIS
- 2025-09-04 Sold (Public Records) $90,000 Public Records
- 2025-05-15 Pending — CNYIS
- 2025-01-30 Listed $95,000 CNYIS
- 2025-01-22 Listing Removed — CNYIS
- 2024-11-15 Listed $115,000 CNYIS
- 2016-02-17 Sold (MLS) $18,500 CNYIS
- 2015-04-01 Listed $22,999 CNYIS
Property tax history
-0.3%/yrLatest (2025): $825 · -33.5% YoY. Source: county tax records.
Cash-flow waterfall
monthlySold comps — $/sqft
last 12 mo · ≤1 miLoading sold comps…