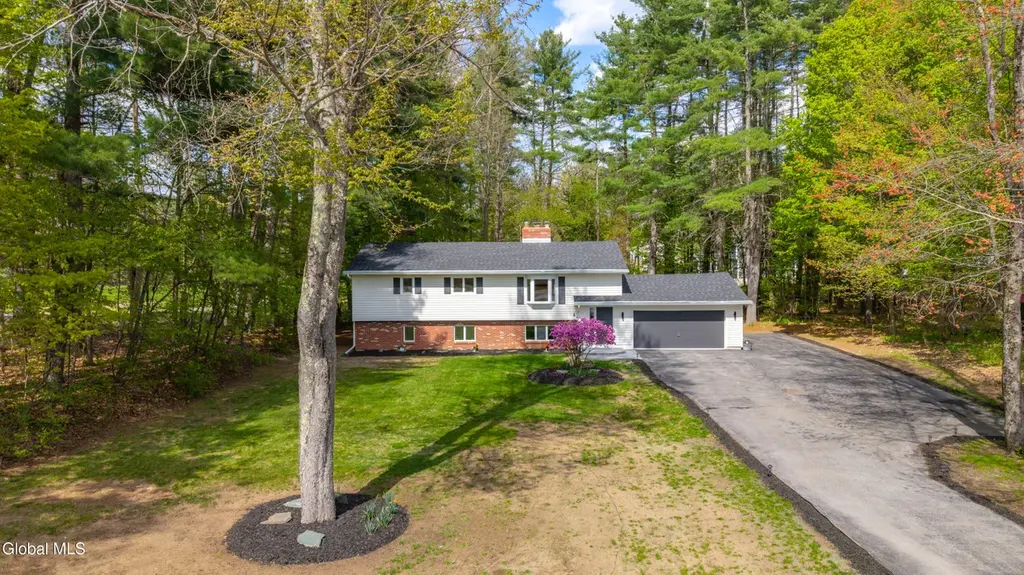
2 Carefree Ln · Saratoga Springs, NY
Flood risk 5/10 · Moderate
- FEMA flood zone
- —
- Chance of flooding over 30 yrs
- 0.24%
- Est. flood insurance / yr
- —
Fire risk 2/10 · Minimal
- Est. fire insurance / yr
- $691 – $1,283
Heat risk 3/10 · Minor
- Hot days now (above 97°F)
- 7 days/yr
- Hot days in 30 yrs
- 16 days/yr
Wind risk 2/10 · Minimal
- Chance of severe wind over 30 yrs
- 4.0%
Air-quality risk 1/10 · Minimal
- Unhealthy air days now
- 0 days/yr
- Unhealthy air days in 30 yrs
- 0 days/yr
Risk factors via First Street. Map © Google.
Why this score? — see what drove the D- grade
The composite is a weighted blend of 9 inputs, each scored 0–100. Each bar is that input's sub-score; the figure is the points it added to the 100-point composite (weight × sub-score).
- ARV discount +14.9/15.0
- Cash flow +7.3/30.0
- Schools +6.1/10.0
- Livability +4.1/5.0
- Rent growth +2.5/5.0
- Condition / age +2.5/5.0
- DSCR +1.4/10.0
- 1% rule +1.2/10.0
- Appreciation +0.0/10.0
$549,900
🖨 Deal sheet (PDF) 📄 Offer letter ✓ Due diligence
Listing remarks MLS
Sold before Print
Key facts
- New subflooring
- Finished lower level
- 0.48 acre lot
Tags
Property features AI
Exterior
- Parking: Attached garage (2 spaces); Driveway parking — total 6 parking spaces
- Utilities: Septic tank
- Home design: Single family residence; Living area approximately 2,460
- Construction: Vinyl siding; Shingle/asphalt roof
- Exterior features: Deck; Driveway paved
Interior
- Kitchen: Range; Dishwasher; Refrigerator
- Bedrooms: Primary bedroom on second level; Additional bedrooms on first and second levels
- Flooring: Tile; Vinyl; Hardwood
- Bathrooms: Three full bathrooms (one on first level, two on second level)
- Heating & cooling: Forced air heating (natural gas); Central air conditioning
- Interior features: Built-in features; Ceramic tile bath; Basement (other); Two fireplaces
- Laundry & utility: Main-level laundry room; Washer and dryer included
Neighborhood map
What this means for you Summary
Snapshot
- This is a 5-bed/2.5-bath single-family listed at $550k.
Deal economics
- At list price, monthly cash flow is $-742 ($-9k/yr) — negative.
- To cash-flow at today's rent, offer at most $419k (23.8% below list).
- To meet the 1% rule (rent ≥ 1% of price), the offer needs to be $340k (38.2% below list).
- Recommended offer: $340k (38.2% below list) — sets the bar for 1% rule.
- Cap rate 4.7% vs local median 2.0% in Saratoga Springs — top-decile yield for the area; either an underpriced asset or a hidden risk that comps aren't pricing in. Stress-test before assuming the spread holds.
Location & tenants
- Location reads 82/100 on livability (#83 in NY, #1,284 nationally) — a professional / high-income tenant draw. Strengths: employment A+, housing A+, health & safety A; Watch: amenities D+, cost of living F.
- Saratoga Springs City SD (suburban): math 67% / reading 72% proficiency, ranked #138 of 590 in NY (top 23%) — acceptable for families but not a draw, mixed tenant base, ~2y average lease; only 15% free/reduced lunch — higher-income household profile.
- Zoned schools: Dorothy Nolan Elementary School (math 69% / reading 68%, grade B+, #517 of 2,108 statewide, top 25%, 688 students, 22% FRL); Maple Avenue Middle School (math 46% / reading 69%, grade B, #187 of 729 statewide, top 26%, 1,392 students, 27% FRL); Saratoga Springs High School (math 98% / reading 92%, grade A+, #83 of 1,100 statewide, top 8%, 1,947 students, 26% FRL).
- Market conditions: 115 active listings in the ZIP; solid renter incomes; 1,132 units permitted in Saratoga County in 2024 (378 in 5+ unit buildings).
- This rent runs 41% of the median local income ($100k/yr) — at the standard rent-burdened threshold; future hikes will face affordability resistance.
Forward outlook
- Local home prices are declining (-3.0%/yr); year-one equity from $4k of loan paydown is wiped out by about $16k of value loss. Plan a longer hold.
- Saratoga County population projected at +4% by 2050 — modest demand growth; plan on rents tracking national, not racing it.
Negotiation context
- It's been on market 21 days — a 2% lower offer ($542k) is reasonable based on typical stale-listing flexibility.
- 3 sale attempts with the ask held roughly flat each time — persistent listings suggest the price (not the market) is what's stuck; bring a comps-based counter.
- Current owner paid $363k; list at $550k implies a 51% gain — meaningful room to come down on a strong offer.
Risks & watch-outs
- Climate carrying-cost: moderate flood risk — expect insurance premiums to compound above CPI over the hold.
Questions for the listing agent
- What do current leases actually rent for vs. the listed asking? Can we see a recent rent roll and the last 12 months of T-12 income?
- Built in 1972 — when were the roof, HVAC, electrical panel, plumbing, and water heater last replaced?
- Is there a deadline driving the sale (1031 exchange, divorce, estate, relocation)? That informs how much negotiation room exists.
- Schools are A-rated — typically a magnet for longer-tenancy family renters. What's the average tenant stay here, and is there a school-zone premium baked into asking?
- The area grade is low — what's the realistic commute time and amenity access for the typical tenant pool here? Any planned neighborhood developments (good or bad) we should know about?
- What's the average days-on-market for RENTAL listings here right now (not sales)? A rising rental-DOM trend means longer vacancies and softer asking-rent achievability than the comps imply.
- What's the recent tenant-quality profile in this submarket — average credit score on applications, eviction rate, late-payment / NSF rate, and stable-employment percentage? A property-management company in the area should have these aggregated.
- How much new for-sale + rental construction is in the pipeline within 1–3 miles? Heavy new supply typically softens prices + rents 12–24 months out; constrained supply supports both.
Investment metrics
- 1% rule
- 0.62% ✗
- Cap rate
- 4.67%
- Cash-on-cash
- -5.78%
- DSCR
- 0.74
- GRM
- 13.5
CMA / ARV
- ARV (median comp)
- $657,583
- List price
- $549,900
- Delta
- -16.38%
- Verdict
- UNDERPRICED
- Comps
- 20 within 1.0 mi
Show comp detail 11 sales within ~0.75 mi
| Address | Dist | Beds/Ba | Sqft | Sold | Price | $/sf | Match |
|---|---|---|---|---|---|---|---|
| 288 Northern Pines Rd | 0.09mi | 4/2.5 (-1) | 1,908 (-5%) | 2mo | $447,000 | $234 | 80 |
| 50 Fieldstone Dr | 0.21mi | 4/2.5 (-1) | 2,000 (-1%) | 13mo | $550,000 | $275 | 73 |
| 276 Northern Pines Rd | 0.17mi | 4/2.0 (-1) | 1,918 (-5%) | 9mo | $456,000 | $238 | 70 |
| 12 Deer Run | 0.35mi | 5/3.0 | 2,183 (+8%) | 6mo | $689,900 | $316 | 64 |
| 31 Fairway Blvd | 0.35mi | 5/2.0 | 2,203 (+9%) | 16mo | $475,000 | $216 | 53 |
| 9 Rolling Hills Dr | 0.63mi | 4/2.0 (-1) | 1,918 (-5%) | 9mo | $405,000 | $211 | 48 |
| 63 Hearthstone Dr | 0.45mi | 4/3.5 (-1) | 2,292 (+14%) | 2mo | $800,000 | $349 | 46 |
| 19 Cobble Hill Dr | 0.53mi | 4/3.0 (-1) | 2,259 (+12%) | 23mo | $565,000 | $250 | 29 |
| 16 Carr Rd | 0.69mi | 4/2.0 (-1) | 1,769 (-12%) | 16mo | $386,000 | $218 | 27 |
| 9 Greylock Dr | 0.67mi | 4/2.5 (-1) | 2,312 (+15%) | 16mo | $545,000 | $236 | 26 |
| 227 Northern Pines Rd | 0.61mi | 4/2.5 (-1) | 2,316 (+15%) | 21mo | $500,000 | $216 | 24 |
Match score weights: distance 35% · size 25% · config 20% · recency 20%. Top-matched comps best support the ARV.
Projected returns pro-forma
-3.0% appreciation · 3.0% rent growth · sell at horizon
- IRR
- -26.3%
- Equity multiple
- 0.11×
- Total profit
- $-136,539
- Equity at exit
- $81,992
- IRR
- -23.4%
- Equity multiple
- -0.17×
- Total profit
- $-180,466
- Equity at exit
- $47,545
Cash invested: $153,972 (down + closing). Projections, not guarantees.
Landlord ↔ Tenant lean methodology
- Overall (STATE)
- 15 Strongly Tenant-Friendly
- State New York
- 15 Strongly Tenant-Friendly · D+10
- County
- — inherits STATE
- City
- — inherits STATE
ZIP-level market 12831
- Home prices YoY
- -12.8%
- Active inventory
- 115
- Price-to-rent
- 13.5×
Monthly cashflow live
- Estimated rent
- $3,398 medium interval (Pro) →
- Mortgage (P&I)
- −$2,884
- Tax from tax record
- −$313 /mo · $3,760/yr
- Insurance
- −$229
- HOA
- −$0
- Vacancy / Maint / Mgmt
- −$714
- Net cashflow
- $-742
Break-even live
Sensitivity live
| Price | -10% $-431 | -5% $-586 | +0% $-742 | +5% $-898 | +10% $-1,053 |
|---|---|---|---|---|---|
| Rent | -10% $-1,010 | -5% $-876 | +0% $-742 | +5% $-608 | +10% $-473 |
| Rate | -1.0pp $-465 | -0.5pp $-602 | base $-742 | +0.5pp $-884 | +1.0pp $-1,029 |
UW: 25.0% down · 7.5% · 30yr · 1.5% tax · 5.0% vac · 8.0% maint · 8.0% mgmt
Financing live
Cash to close
- Down payment
- $137,475
- Closing costs
- $16,497
- Reserves months
- —
- Total cash needed
- —
Loan-product check · same deal, 3 products live
Conventional
25% down · 7.5% · 30yr
- Down + closing
- —
- Monthly P&I
- —
- Monthly cashflow
- —
- DSCR
- —
- Eligible?
- —
Personal DTI + credit; lowest rate.
DSCR
20% down · 8.5% · 30yr
- Down + closing
- —
- Monthly P&I
- —
- Monthly cashflow
- —
- DSCR
- —
- Eligible?
- —
No personal income docs; deal must DSCR.
Hard money
10% down · 12.0% · 12mo
- Down + closing
- —
- Monthly P&I
- —
- Monthly cashflow
- —
- DSCR
- —
- Eligible?
- —
Short-term bridge; refi at stabilization.
Listing history 18 events
-
2026-06-18status $549,900 Pending 21 DOM
-
2026-06-18days on market $549,900 Active 21 DOM
-
2026-06-17days on market $549,900 Active 20 DOM
-
2026-06-16days on market $549,900 Active 19 DOM
-
2026-06-15days on market $549,900 Active 18 DOM
-
2026-06-14days on market $549,900 Active 16 DOM
-
2026-06-13days on market $549,900 Active 15 DOM
-
2026-06-10days on market $549,900 Active 13 DOM
-
2026-06-09days on market $549,900 Active 12 DOM
-
2026-06-08days on market $549,900 Active 11 DOM
-
2026-06-07days on market $549,900 Active 10 DOM
-
2026-06-05status $549,900 Active 7 DOM
-
2026-05-14status Pending 1275-char remark
-
2026-05-07$549,900 Active 1275-char remark
-
2025-11-24soldstatus $363,000 Closed 17-char remark
Show marketing remark (17 chars)
Sold before Print
-
2025-11-24$425,000 Active 17-char remark
Show marketing remark (17 chars)
Sold before Print
-
2025-10-29soldstatus $363,000
-
2004-06-03soldstatus $210,000
ⓘ Source: listings_history table (triggers on properties + properties_extension) + one-shot
backfill from property_details.listing_events for pre-trigger history.
Tax reassessment forecast NY · Partial reset (capped growth)
- Current annual tax
- $3,760 · $313/mo
- Projected year-2 tax
- $6,527 · $544/mo
- Expected delta
- +$2,767/yr (+$231/mo · 73.6%)
ⓘ Screening estimate from a state-policy table — verify with the county assessor before closing.
Climate risk First Street
- Flood 5/10 Major 24% chance over 30 yrs
- Wildfire 2/10 Low
- Heat 3/10 Moderate 7 d/yr ≥97°F today · 16 d/yr by 30 yrs out
- Wind 2/10 Low 4% chance of damaging wind over 30 yrs
- Air quality 1/10 Low 0 unhealthy d/yr today · 0 by 30 yrs out
Nearby sold comps map
Loading sold comps map…
Walkable amenities ~0.75 mi
Loading nearby amenities…
Taxation est. · year 1
- Rental income
- $40,774
- − Mortgage interest
- −$30,803
- − Property taxes
- −$3,760
- − Insurance
- −$2,750
- − Repairs & maintenance
- −$3,262
- − Management
- −$3,262
- − Depreciation
- −$15,997
- Taxable loss
- −$19,059
- Est. tax savings @ 24.0%
- +$4,574
- After-tax cash flow
- $-4,329/yr
For passive investors: Depreciation is non-cash, so a rental often shows a tax loss while cash-flowing — sheltering income. Rental losses are passive: they offset passive income freely, and up to $25,000/yr can offset ordinary (W-2) income if you actively participate and your MAGI is under $100k (phasing out to $0 by $150k); unused losses carry forward. On sale, claimed depreciation is recaptured at up to 25%, and gains may owe capital-gains tax (a 1031 exchange can defer both). Figures are a year-1 estimate at your 24.0% rate — not tax advice; consult a CPA.
Schools (NCES district)
- District
- Saratoga Springs City SD
- NCES district ID
- 3625770
- Math proficiency
- 67% ▼ -10.00%
- Reading proficiency
- 72% ▲ 6.00%
- Median HH income
- $69,864
- Composite
- 60.83/100
- National rank
- #818
- State rank
- #138 of 590 in NY
Livability — Saratoga Springs
- Score
- 82/100
- State rank
- #83
- US rank
- #1284
Category grades
Schools grade is shown separately in the Schools card above.
Census & demographics
- County
- Saratoga County · 166,192 people
- City population
- 40,057
- Metro
- Albany-Schenectady-Troy, NY
- Population (ZIP)
- 18,025
- Household income
- $100,024
- Rent vs Own
- Severe rent burden
- 497.0
Population outlook (Saratoga County) Hauer SSP2
- Today (2025)
- 238,889 people
- By 2030
- 243,681 · +2.0%
- By 2040
- 249,118 · +4.3%
- By 2050
- 248,638 · +4.1%
- By 2075
- 241,675 · +1.2%
- By 2100
- 213,150 · -10.8%
Race, ethnicity, and origin ACS 2023
- Neighborhood character
- Predominantly White (92%)
- Race & ethnicity
- White 92% Hispanic / Latino 3% Two or more races 3% Asian 1%
- Common ancestry
- Lithuanian 11% Romanian 4% Iranian 2%
- Foreign-born
- 3% · Canada
- Languages at home
- 95% English-only · Spanish 2% Russian/Polish/Slavic 1% Other Indo-European 1%
Political lean MEDSL · Saratoga
- 2024 margin
- Toss-up / Even · D 50.9% · R 49.1%
- 2008→2024 swing
- -1.6pp toward R · 2008: 3.4pp · 2024: 1.8pp
- All cycles
- 2024: D+1.8 2020: D+5.4 2016: R+4.4 2012: D+2.1 2008: D+3.4
Not yet ingested
- Civics
- —
Market trends
- HPI YoY
- ▼ -51.79%
- Current HPI
- 351.6972
- Rent YoY
- —
- Metro
- Albany-Schenectady-Troy, NY
- State GDP YoY
- ▲ 2.60%
- F500 in state
- 92
Industry mix (Fortune 500 HQ in NY)
| Industry | F500 HQs | Revenue |
|---|---|---|
| Financial Services | 10 | $950B |
|
||
| Consumer Goods | 9 | $162B |
|
||
| Insurance | 4 | $225B |
|
||
| Telecommunications | 2 | $144B |
|
||
| Pharmaceuticals | 2 | $112B |
|
||
| Media / Entertainment | 2 | $69B |
|
||
Price history
+161.9% since first listed7 events — show timeline
- 2026-06-04 Relisted — Global MLS
- 2026-05-14 Pending — Global MLS
- 2026-05-07 Listed $549,900 Global MLS
- 2025-11-24 Listed $425,000 Global MLS
- 2025-11-24 Sold (MLS) $363,000 Global MLS
- 2025-10-29 Sold (Public Records) $363,000 Public Records
- 2004-06-03 Sold (Public Records) $210,000 Public Records
Property tax history
+0.8%/yrLatest (2025): $3,760 · -1.8% YoY. Source: county tax records.
Cash-flow waterfall
monthlySold comps — $/sqft
last 12 mo · ≤1 miLoading sold comps…