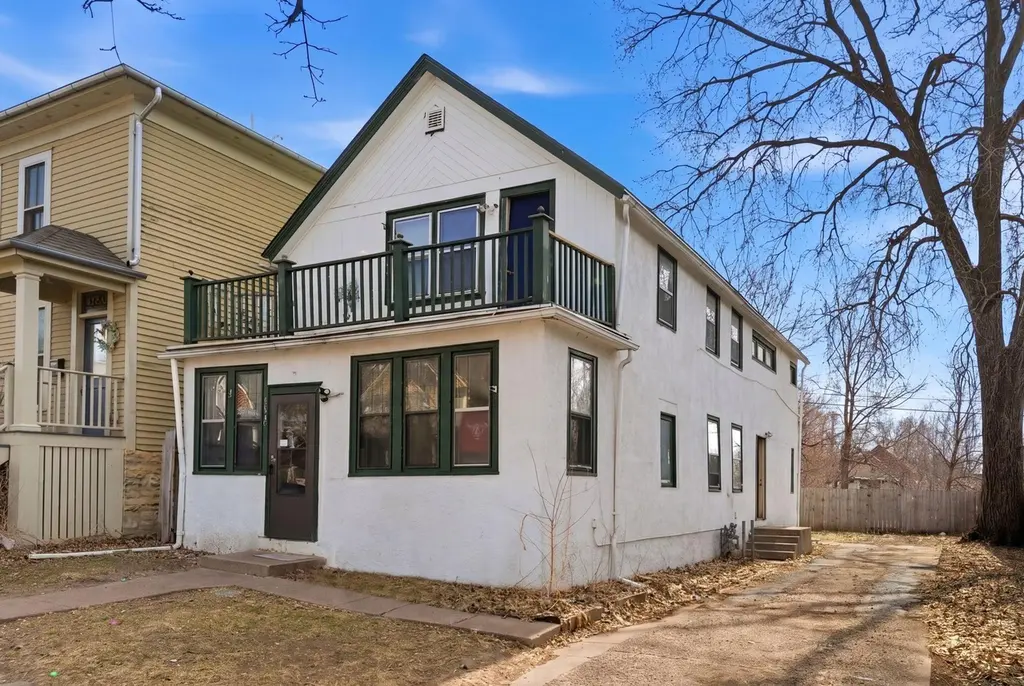
 Duplex
692 4th St E · St. Paul, MN
Flood risk 1/10 · Minimal
- FEMA flood zone
- X (unshaded)
- Chance of flooding over 30 yrs
- 0.0%
- Est. flood insurance / yr
- $473 – $860
Fire risk 1/10 · Minimal
- Est. fire insurance / yr
- $888 – $1,650
Heat risk 2/10 · Minimal
- Hot days now (above 99°F)
- 7 days/yr
- Hot days in 30 yrs
- 14 days/yr
Wind risk 2/10 · Minimal
- Chance of severe wind over 30 yrs
- —
Air-quality risk 2/10 · Minimal
- Unhealthy air days now
- 1 days/yr
- Unhealthy air days in 30 yrs
- 1 days/yr
Risk factors via First Street. Map © Google.
Why this score? — see what drove the C grade
The composite is a weighted blend of 9 inputs, each scored 0–100. Each bar is that input's sub-score; the figure is the points it added to the 100-point composite (weight × sub-score).
- Cash flow +25.6/30.0
- DSCR +8.5/10.0
- ARV discount +7.5/15.0
- 1% rule +6.6/10.0
- Rent growth +4.1/5.0
- Livability +2.5/5.0
- Condition / age +2.5/5.0
- Schools +2.4/10.0
- Appreciation +0.0/10.0
$384,750
🖨 Deal sheet 📄 Offer letter ✓ Due diligence
Multi-family units
County records classify this as Multi-Family (2-4 Unit). Listing-text estimate: 2 units. confirmed
Listing remarks
Well located up and down duplex on St Pauls East Side offering strong long-term rental appeal in a stable and growing neighborhood. Convenient access to downtown St Paul, public transportation, Mississippi Market Co-Op, and the restaurants, shopping, and entertainment along East 7th Street. Property features a practical duplex layout with continued rental demand driven by the neighborhoods accessibility and proximity to downtown employment centers. Utilities are currently partially owner-paid with ownership implementing a RUBS utility reimbursement program across the portfolio beginning Q3 2026, creating additional NOI upside potential through utility cost recovery and operational efficienc
Key facts
- 4,312 sq ft lot
- Built 1900
- Listed 33 days
Property features AI
Finance
- Other: Other annual assessment amount reported
- Financial info: Property is owner-occupied: No; Two-unit building; Owner pays electricity, gas, trash collection and water; Tenants pay electricity and gas; Gross income reported as $32,223
Exterior
- Parking: On-street parking only
- Utilities: City water connected; City sewer connected; Electric and natural gas service available
- Home design: Residential income property (duplex, up-and-down); Two levels; Entry/accessibility features include wider doors
- Construction: Constructed with block, concrete and frame materials; Asphalt pitched roof (age 8 years or less); Foundation described as other with block foundation and foundation dimensions approx. 21 x 62
- Exterior features: Wood exterior; Partial fencing; Public transit within six blocks; City street frontage with curbs and paved streets; Publicly maintained road
Interior
- Kitchen: Each unit includes a range and refrigerator
- Bedrooms: Total of 4 bedrooms; Unit breakdown: one 2-bedroom unit and a second 2-bedroom unit
- Bathrooms: Two full bathrooms (one in each unit)
- Heating & cooling: Forced air heating; No central cooling listed for either unit
- Interior features: Accessible doors 36" or wider; Level topography
- Laundry & utility: Laundry located in the basement; Each unit has a gas water heater
Neighborhood map
What this means for you Summary
Snapshot
- This is a 2 × 2-bed/1.0-bath units multifamily listed at $385k.
Deal economics
- At list price, monthly cash flow is $907 ($11k/yr) — positive. Per door: $454/mo.
- The deal already cash-flows at list — no discount required.
- Meets the 1% rule at list price ($4k rent vs $385k).
- Recommended offer: $373k (3.0% below list) — sets the bar for market timing.
Location & tenants
- Location reads: area grade C — affects rentability + tenant quality, not the cash-flow math above.
- St. Paul Public School District (urban): math 21% / reading 33% proficiency, ranked #270 of 301 in MN (top 90%) — low school quality limits family demand, transient renter base, plan for 1-2y turnover; 64% free/reduced lunch — lower-income household profile, screen leases tightly.
- Market conditions: Rents rising fast (+6.3%/yr); 255 active listings in the ZIP; 5 comparable units currently listed for rent nearby; rentals leasing fast (median 2d on market — plan ~1-2 weeks tenant-placement turnaround); 1,202 units permitted in Ramsey County in 2024 (880 in 5+ unit buildings).
- At $4,456/mo this rent would consume 76% of the median local household income ($70k/yr) (locally 2046% of renters already pay >50% of income on rent) — very limited rent-growth headroom before tenants either downsize or default.
Forward outlook
- Local home prices are declining (-3.0%/yr); year-one equity from $3k of loan paydown is wiped out by about $12k of value loss. Plan a longer hold.
- Ramsey County population projected at +27% by 2050 — long-run rental-demand tailwind backs the buy-and-hold thesis.
- At projected returns (-3.0% appreciation + 6.3% rent growth), your $108k cash investment doubles in ~8 years — after that, you're playing with house money.
Negotiation context
- It's been on market 34 days — a 3% lower offer ($373k) is reasonable based on typical stale-listing flexibility.
Risks & watch-outs
- Watch-outs: built in 1900 — expect roof / HVAC / electrical / plumbing capex.
Questions for the listing agent
- It's been on market 34 days. Have you received any prior offers? Is the seller open to a 3% concession, seller financing, or rate buy-down credit?
- Can we see the unit-by-unit rent roll, current vacancy, and any below-market leases? What's the average tenancy length?
- What capital expenditures (roof, boiler, parking lot, exteriors) have been made in the last 5 years, and what's planned in the next 2?
- Built in 1900 — when were the roof, HVAC, electrical panel, plumbing, and water heater last replaced?
- Is there a deadline driving the sale (1031 exchange, divorce, estate, relocation)? That informs how much negotiation room exists.
- What's the average days-on-market for RENTAL listings here right now (not sales)? A rising rental-DOM trend means longer vacancies and softer asking-rent achievability than the comps imply.
- What's the recent tenant-quality profile in this submarket — average credit score on applications, eviction rate, late-payment / NSF rate, and stable-employment percentage? A property-management company in the area should have these aggregated.
- How much new apartment / multifamily construction is in the pipeline within 1–3 miles? Heavy new supply (>2% of stock underway) typically softens rents 12–24 months out; light construction supports rent growth.
Investment metrics
- 1% rule
- 1.16% ✓
- Cap rate
- 9.12%
- Cash-on-cash
- 10.11%
- DSCR
- 1.45
- GRM
- 7.2
CMA / ARV
No comps found within radius.
Projected returns pro-forma
-3.0% appreciation · 6.26% rent growth · sell at horizon
- IRR
- 2.5%
- Equity multiple
- 1.10×
- Total profit
- $10,580
- Equity at exit
- $57,367
- IRR
- 15.0%
- Equity multiple
- 2.39×
- Total profit
- $150,021
- Equity at exit
- $33,266
Cash invested: $107,730 (down + closing). Projections, not guarantees.
Landlord ↔ Tenant lean methodology
- Overall (STATE)
- 46 Balanced
- State Minnesota
- 46 Balanced · D+2
- County
- — inherits STATE
- City
- — inherits STATE
ZIP-level market 55106
- Rents YoY
- 6.3%
- Active inventory
- 255
- Price-to-rent
- 14.4×
Monthly cashflow live
- Estimated rent
- $4,456 high interval (Pro) →
- Mortgage (P&I)
- −$2,018
- Tax from tax record
- −$435 /mo · $5,218/yr
- Insurance
- −$160
- HOA
- −$0
- Vacancy / Maint / Mgmt
- −$936
- Net cashflow
- $907
Break-even live
2-unit breakdown (identical units grouped — click to expand)
| Units | Beds | Baths | Est. rent |
|---|---|---|---|
| 2× units | 2 | 1 | $4,456 |
| #1 | 2 | 1 | $2,228 |
| #2 | 2 | 1 | $2,228 |
| Total (2 units) | $4,456 | ||
UW: 25.0% down · 7.5% · 30yr · 1.5% tax · 5.0% vac · 8.0% maint · 8.0% mgmt
Financing live
Cash to close
- Down payment
- $96,188
- Closing costs
- $11,542
- Reserves months
- —
- Total cash needed
- —
Loan-product check · same deal, 3 products live
Conventional
25% down · 7.5% · 30yr
- Down + closing
- —
- Monthly P&I
- —
- Monthly cashflow
- —
- DSCR
- —
- Eligible?
- —
Personal DTI + credit; lowest rate.
DSCR
20% down · 8.5% · 30yr
- Down + closing
- —
- Monthly P&I
- —
- Monthly cashflow
- —
- DSCR
- —
- Eligible?
- —
No personal income docs; deal must DSCR.
Hard money
10% down · 12.0% · 12mo
- Down + closing
- —
- Monthly P&I
- —
- Monthly cashflow
- —
- DSCR
- —
- Eligible?
- —
Short-term bridge; refi at stabilization.
Rent comps 5 comps
| Address | Beds | Baths | Sqft | Rent | $/sqft | DOM | Units | Dist |
|---|---|---|---|---|---|---|---|---|
| 250 6th St E St Paul, MN | 2.0 | 1.0–2.0 | 980 | $2,868 | $2.93 | 1d | 16 | 0.95mi |
| 240 5th St E St Paul, MN | 2.0 | 1.0–2.0 | 949 | $2,770 | $2.92 | 2d | 10 | 0.97mi |
| 333 Sibley St Saint Paul, MN | 3.0 | 1.0–2.0 | 1358 | $3,269 | $2.41 | 10d | 10 | 1.04mi |
| 180 E Kellogg Blvd St Paul, MN | 3.0 | 1.0–2.5 | 1436 | $4,595 | $3.20 | 1d | 22 | 1.06mi |
| 111 Kellogg Blvd E Saint Paul, MN | 3.0 | 1.0–2.0 | 1000 | $2,783 | $2.78 | 1d | 20 | 1.21mi |
Listing history 15 events
-
2026-06-18days on market $384,750 Active 34 DOM
-
2026-06-17days on market $384,750 Active 33 DOM
-
2026-06-16days on market $384,750 Active 32 DOM
-
2026-06-15days on market $384,750 Active 31 DOM
-
2026-06-13days on market $384,750 Active 29 DOM
-
2026-06-09days on market $384,750 Active 25 DOM
-
2026-06-08days on market $384,750 Active 24 DOM
-
2026-06-07days on market $384,750 Active 23 DOM
-
2026-06-04days on market $384,750 Active 20 DOM
-
2026-06-03days on market $384,750 Active 19 DOM
-
2026-06-02days on market $384,750 Active 18 DOM
-
2026-06-01days on market $384,750 Active 17 DOM
-
2026-05-31days on market $384,750 Active 16 DOM
-
2026-05-16$384,750 Active 1099-char remark
-
2026-05-15historical $384,750 1099-char remark
ⓘ Source: listings_history table (triggers on properties + properties_extension) + one-shot
backfill from property_details.listing_events for pre-trigger history.
Tax reassessment forecast MN · Partial reset (capped growth)
- Current annual tax
- $5,218 · $435/mo
- Projected year-2 tax
- $5,218 · $435/mo
- Expected delta
- $0/yr ($0/mo · 0.0%)
ⓘ Screening estimate from a state-policy table — verify with the county assessor before closing.
Climate risk First Street
- Flood 1/10 Low FEMA zone X (unshaded) · 0% chance over 30 yrs
- Wildfire 1/10 Low
- Heat 2/10 Low 7 d/yr ≥99°F today · 14 d/yr by 30 yrs out
- Wind 2/10 Low
- Air quality 2/10 Low 1 unhealthy d/yr today · 1 by 30 yrs out
Nearby sold comps map
Loading sold comps map…
Walkable amenities ~0.75 mi
Loading nearby amenities…
Taxation est. · year 1
- Rental income
- $53,472
- − Mortgage interest
- −$21,552
- − Property taxes
- −$5,218
- − Insurance
- −$1,924
- − Repairs & maintenance
- −$4,278
- − Management
- −$4,278
- − Depreciation
- −$11,193
- Taxable income
- $5,030
- Est. tax owed @ 24.0%
- −$1,207
- After-tax cash flow
- $9,682/yr
For passive investors: Depreciation is non-cash, so a rental often shows a tax loss while cash-flowing — sheltering income. Rental losses are passive: they offset passive income freely, and up to $25,000/yr can offset ordinary (W-2) income if you actively participate and your MAGI is under $100k (phasing out to $0 by $150k); unused losses carry forward. On sale, claimed depreciation is recaptured at up to 25%, and gains may owe capital-gains tax (a 1031 exchange can defer both). Figures are a year-1 estimate at your 24.0% rate — not tax advice; consult a CPA.
Schools (NCES district)
- District
- St. Paul Public School District
- NCES district ID
- 2733840
- Math proficiency
- 21% ▼ -11.00%
- Reading proficiency
- 33% ▼ -7.00%
- Median HH income
- $48,316
- Composite
- 23.51/100
- National rank
- #7868
- State rank
- #270 of 301 in MN
Livability — St. Paul
No livability data for this city. (Only ~50 U.S. cities are tracked.)
Census & demographics
- Census place
- St. Paul, MN
- County
- Ramsey County · 542,837 people
- City population
- 280,599
- Metro
- Minneapolis-St. Paul-Bloomington, MN-WI
- Population (ZIP)
- 56,708
- Household income
- $70,187
- Rent vs Own
- Severe rent burden
- 2046.0
Population outlook (Ramsey County) Hauer SSP2
- Today (2025)
- 603,431 people
- By 2030
- 636,459 · +5.5%
- By 2040
- 700,596 · +16.1%
- By 2050
- 765,819 · +26.9%
- By 2075
- 929,297 · +54.0%
- By 2100
- 1,053,924 · +74.7%
Race, ethnicity, and origin ACS 2023
- Neighborhood character
- Highly diverse neighborhood (Simpson 0.75)
- Race & ethnicity
- Asian 34% White 32% Black 15% Hispanic / Latino 11% Two or more races 10%
- Hispanic origin (detail)
- Mexican 8%
- Common ancestry
- Portuguese 4% Lithuanian 2% Romanian 2%
- Foreign-born
- 25% · Canada, Philippines, Vietnam
- Languages at home
- 59% English-only · Other Asian/Pacific 27% Spanish 9% French/Haitian/Cajun 1%
Political lean MEDSL · Ramsey
- 2024 margin
- Solid D (+43.3) · D 70.5% · R 27.2% · Other 2.3%
- 2008→2024 swing
- +9.4pp toward D · 2008: 33.9pp · 2024: 43.3pp
- All cycles
- 2024: D+43.3 2020: D+45.4 2016: D+39.4 2012: D+35.3 2008: D+33.9
Not yet ingested
- Civics
- —
Market trends
- HPI YoY
- ▼ -239.48%
- Current HPI
- 288.7205
- Rent YoY
- ▲ 6.26%
- Metro
- Minneapolis-St. Paul-Bloomington, MN-WI
- State GDP YoY
- ▲ 2.41%
- F500 in state
- 34
Industry mix (Fortune 500 HQ in MN)
| Industry | F500 HQs | Revenue |
|---|---|---|
| Healthcare | 2 | $407B |
|
||
| Retail | 2 | $150B |
|
||
| Consumer Goods | 2 | $32B |
|
||
| Industrial Machinery | 2 | $6B |
|
||
| Agriculture | 1 | $40B |
|
||
| Healthcare / Medical Devices | 1 | $32B |
|
||
Price history
+0.0% since first listed2 events — show timeline
- 2026-05-16 Listed $384,750 NORTHSTARMLS as Distributed by MLS Grid
- 2026-05-15 Coming Soon $384,750 NORTHSTARMLS as Distributed by MLS Grid
Property tax history
+6.9%/yrLatest (2025): $5,218 · +4.9% YoY. Source: county tax records.
Cash-flow waterfall
monthlySold comps — $/sqft
last 12 mo · ≤1 miLoading sold comps…