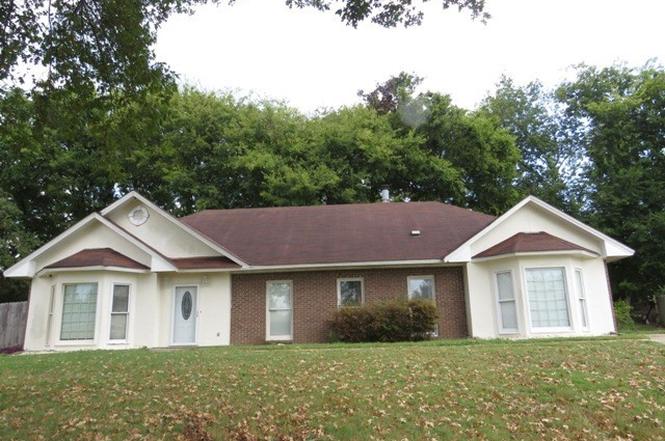
6329 Old Pond Rd · Montgomery, AL
Flood risk 1/10 · Minimal
- FEMA flood zone
- X (unshaded)
- Chance of flooding over 30 yrs
- 0.0%
- Est. flood insurance / yr
- $507 – $1,088
Fire risk 3/10 · Minor
- Est. fire insurance / yr
- $916 – $1,700
Heat risk 7/10 · Major
- Hot days now (above 108°F)
- 7 days/yr
- Hot days in 30 yrs
- 20 days/yr
Wind risk 8/10 · Major
- Chance of severe wind over 30 yrs
- 80.0%
Air-quality risk 4/10 · Minor
- Unhealthy air days now
- 4 days/yr
- Unhealthy air days in 30 yrs
- 5 days/yr
Risk factors via First Street. Map © Google.
Why this score? — see what drove the B- grade
The composite is a weighted blend of 9 inputs, each scored 0–100. Each bar is that input's sub-score; the figure is the points it added to the 100-point composite (weight × sub-score).
- Cash flow +26.9/30.0
- ARV discount +15.0/15.0
- DSCR +9.3/10.0
- 1% rule +7.1/10.0
- Rent growth +3.2/5.0
- Livability +3.2/5.0
- Condition / age +2.5/5.0
- Schools +1.7/10.0
- Appreciation +0.0/10.0
$144,900
🖨 Deal sheet 📄 Offer letter ✓ Due diligence
Listing remarks MLS
Spacious home, approx. 1916 square feet per appraiser, features a three bedroom split plan with lots of bay windows. Large great room has a vaulted ceiling, built-in bookcases and a fireplace with gas logs. Cheerful kitchen has a breakfast nook with a bay window, recessed lighting, built-in desk and a pantry. There is also a separate dining room. Master suite has walk-in closet, garden tub plus separate shower. Roof only two years old and central heat and air new in 2006. Mature trees, patio, easily kept yard, detached storage and located on a cul-de-sac.
Key facts
- Built-in bookcases
- Vaulted ceiling
- Bay windows
Tags
Neighborhood map
What this means for you Summary
Snapshot
- This is a 3-bed/2.0-bath single-family listed at $145k.
Deal economics
- At list price, monthly cash flow is $402 ($5k/yr) — positive.
- The deal already cash-flows at list — no discount required.
- Meets the 1% rule at list price ($2k rent vs $145k).
- Recommended offer: $128k (12.0% below list) — sets the bar for market timing.
- Cap rate 9.6% vs local median 6.0% in Montgomery — top-decile yield for the area; either an underpriced asset or a hidden risk that comps aren't pricing in. Stress-test before assuming the spread holds.
Location & tenants
- Location reads 65/100 on livability (#138 in AL) — a middle-class / working-renter tenant base. Strengths: cost of living A+, housing A+; Watch: schools C-, employment D, crime F.
- Montgomery County (urban): math 9% / reading 31% proficiency, ranked #106 of 129 in AL (top 82%) — low school quality limits family demand, transient renter base, plan for 1-2y turnover; 70% free/reduced lunch — lower-income household profile, screen leases tightly.
- Market conditions: Rents rising (+3.0%/yr); 407 active listings in the ZIP; 15 comparable units currently listed for rent nearby; rentals at typical pace (median 21d on market — plan ~3-4 weeks tenant-placement turnaround); 460 units permitted in Montgomery County in 2024 (37 in 5+ unit buildings).
Forward outlook
- Local home prices are declining (-3.0%/yr); year-one equity from $1k of loan paydown is wiped out by about $4k of value loss. Plan a longer hold.
- Montgomery County population projected to shrink 8% by 2050 — rents likely to lag national; underwrite the cash flow, not the appreciation.
- At projected returns (-3.0% appreciation + 3.0% rent growth), your $41k cash investment doubles in ~10 years — after that, you're playing with house money.
Negotiation context
- It's been on market 161 days — a 12% lower offer ($128k) is reasonable based on typical stale-listing flexibility.
- 5 sale attempts since 20y ago; this cycle's ask has dropped $55k (28%) from the opening price — seller is motivated, your offer sets the floor, not the list.
Risks & watch-outs
- Climate carrying-cost: severe wind risk, 80% chance of damaging wind over 30y; extreme-heat days projected 7→20/yr by 2055 (HVAC capex compounding) — expect insurance premiums to compound above CPI over the hold.
Questions for the listing agent
- It's been on market 161 days. Have you received any prior offers? Is the seller open to a 12% concession, seller financing, or rate buy-down credit?
- Why hasn't it sold? Are there any deal-killer items the seller is aware of (foundation, flood, title, zoning, code violations)?
- Is there a deadline driving the sale (1031 exchange, divorce, estate, relocation)? That informs how much negotiation room exists.
- Crime grade is F in this area — have there been break-ins, vandalism, or insurance claims at this property in the last 3 years? What carrier currently insures it and at what premium?
- What's the average days-on-market for RENTAL listings here right now (not sales)? A rising rental-DOM trend means longer vacancies and softer asking-rent achievability than the comps imply.
- What's the recent tenant-quality profile in this submarket — average credit score on applications, eviction rate, late-payment / NSF rate, and stable-employment percentage? A property-management company in the area should have these aggregated.
- How much new for-sale + rental construction is in the pipeline within 1–3 miles? Heavy new supply typically softens prices + rents 12–24 months out; constrained supply supports both.
Investment metrics
- 1% rule
- 1.21% ✓
- Cap rate
- 9.62%
- Cash-on-cash
- 11.88%
- DSCR
- 1.53
- GRM
- 6.9
CMA / ARV
- ARV (on-the-fly)
- $212,332
- Comps found
- 12
Show comp detail 12 sales within ~0.75 mi
| Address | Dist | Beds/Ba | Sqft | Sold | Price | $/sf | Match |
|---|---|---|---|---|---|---|---|
| 6329 Old Pond Rd | 0.00mi | 3/2.0 | 1,916 (-2%) | 0mo | $144,900 | $76 | 97 |
| 6204 Stowers Pl | 0.19mi | 4/2.0 (+1) | 1,930 (-1%) | 7mo | $211,000 | $109 | 79 |
| 2209 Cherry Creek Ct | 0.22mi | 3/2.0 | 1,809 (-7%) | 4mo | $267,941 | $148 | 74 |
| 1924 Still Oaks Dr | 0.15mi | 4/2.5 (+1) | 2,068 (+6%) | 3mo | $200,500 | $97 | 73 |
| 6113 Helga Pl | 0.22mi | 4/2.0 (+1) | 1,816 (-7%) | 5mo | $130,000 | $72 | 69 |
| 6415 Philadelphia Hl | 0.43mi | 3/3.5 | 2,020 (+4%) | 2mo | $375,000 | $186 | 66 |
| 6217 John Dunn Ct W | 0.19mi | 3/2.0 | 1,689 (-13%) | 5mo | $207,000 | $123 | 65 |
| 1849 Woodmere Lp Loop | 0.62mi | 3/2.0 | 1,823 (-6%) | 3mo | $196,500 | $108 | 58 |
| 6212 Willow Glen Dr | 0.26mi | 4/2.5 (+1) | 2,184 (+12%) | 3mo | $159,000 | $73 | 58 |
| 6017 Woodrun Ct | 0.55mi | 3/2.0 | 1,800 (-8%) | 8mo | $208,000 | $116 | 54 |
| 6105 Dunwoody Ct | 0.67mi | 4/2.0 (+1) | 1,888 (-3%) | 6mo | $215,000 | $114 | 54 |
| 6725 Greenbrook Dr | 0.74mi | 3/2.5 | 1,800 (-8%) | 8mo | $168,000 | $93 | 44 |
Match score weights: distance 35% · size 25% · config 20% · recency 20%. Top-matched comps best support the ARV.
Projected returns pro-forma
-3.0% appreciation · 2.99% rent growth · sell at horizon
- IRR
- 1.4%
- Equity multiple
- 1.05×
- Total profit
- $2,107
- Equity at exit
- $21,605
- IRR
- 11.0%
- Equity multiple
- 1.86×
- Total profit
- $34,778
- Equity at exit
- $12,528
Cash invested: $40,572 (down + closing). Projections, not guarantees.
Landlord ↔ Tenant lean methodology
- Overall (STATE)
- 90 Strongly Landlord-Friendly
- State Alabama
- 90 Strongly Landlord-Friendly · R+15
- County
- — inherits STATE
- City
- — inherits STATE
ZIP-level market 36117
- Home prices YoY
- -20.0%
- Rents YoY
- 3.0%
- Active inventory
- 407
- Price-to-rent
- 6.9×
Monthly cashflow live
- Estimated rent
- $1,756 high interval (Pro) →
- Mortgage (P&I)
- −$760
- Tax from tax record
- −$165 /mo · $1,981/yr
- Insurance
- −$60
- HOA
- −$0
- Vacancy / Maint / Mgmt
- −$369
- Net cashflow
- $402
Break-even live
UW: 25.0% down · 7.5% · 30yr · 1.5% tax · 5.0% vac · 8.0% maint · 8.0% mgmt
Financing live
Cash to close
- Down payment
- $36,225
- Closing costs
- $4,347
- Reserves months
- —
- Total cash needed
- —
Loan-product check · same deal, 3 products live
Conventional
25% down · 7.5% · 30yr
- Down + closing
- —
- Monthly P&I
- —
- Monthly cashflow
- —
- DSCR
- —
- Eligible?
- —
Personal DTI + credit; lowest rate.
DSCR
20% down · 8.5% · 30yr
- Down + closing
- —
- Monthly P&I
- —
- Monthly cashflow
- —
- DSCR
- —
- Eligible?
- —
No personal income docs; deal must DSCR.
Hard money
10% down · 12.0% · 12mo
- Down + closing
- —
- Monthly P&I
- —
- Monthly cashflow
- —
- DSCR
- —
- Eligible?
- —
Short-term bridge; refi at stabilization.
Rent comps 15 comps
| Address | Beds | Baths | Sqft | Rent | $/sqft | DOM | Units | Dist |
|---|---|---|---|---|---|---|---|---|
| 1857 Still Oaks Dr Montgomery, AL | 4.0 | 2.0 | 1791 | $1,850 | $1.03 | 21d | 1 | 0.10mi |
| 6225 Whitewater Ct Montgomery, AL | 3.0 | 2.0 | 1581 | $1,600 | $1.01 | 21d | 1 | 0.36mi |
| 6025 Oldcastle Pl Montgomery, AL | 3.0 | 2.0 | 1350 | $1,775 | $1.31 | 43d | 1 | 0.40mi |
| 1612 Woodmere Loop Montgomery, AL | 3.0 | 1.5 | 1425 | $1,775 | $1.25 | 43d | 1 | 0.46mi |
| 1944 Woodrun Dr Montgomery, AL | 3.0 | 2.0 | 1689 | $1,595 | $0.94 | 13d | 1 | 0.51mi |
| 6037 Monticello Dr Montgomery, AL | 1.0–2.0 | 1.0–2.0 | 974 | $1,025 | $1.05 | 13d | 3 | 0.91mi |
| 7104 Fair Oaks Ct Montgomery, AL | 3.0 | 2.0 | 1656 | $1,881 | $1.14 | 43d | 1 | 1.07mi |
| 7406 Mill Ridge Ct Montgomery, AL | 3.0 | 2.0 | 1785 | $2,250 | $1.26 | 44d | 1 | 1.08mi |
| 2495 Meadow Ridge Ln Montgomery, AL | 1.0–3.0 | 1.0–2.0 | 1205 | $1,199 | $1.00 | 13d | 14 | 1.12mi |
| 3201 Watchman Dr Montgomery, AL | 1.0–3.0 | 1.0–2.0 | 1054 | $1,644 | $1.56 | 13d | 10 | 1.14mi |
| 1530 Laurelwood Ln Montgomery, AL | 3.0 | 2.0 | 2274 | $2,295 | $1.01 | 13d | 1 | 1.15mi |
| 6509 Enfield Mews Unit 1471753P Montgomery, AL | 4.0 | 2.0 | 1969 | $4,686 | $2.38 | 13d | 1 | 1.29mi |
| 6536 Monmouth Mews Unit 1533650P Montgomery, AL | 3.0 | 2.0 | 1894 | $4,714 | $2.49 | 21d | 1 | 1.33mi |
| 500 Eastdale Rd S Montgomery, AL | 1.0–3.0 | 1.0–2.5 | 1042 | $900 | $0.86 | 21d | 20 | 1.38mi |
| 2014 Rexford Rd Montgomery, AL | 3.0 | 2.0 | 1596 | $1,150 | $0.72 | 43d | 1 | 1.47mi |
Listing history 11 events
-
2026-04-22status Pending
-
2026-03-30price $144,900
-
2026-02-24price $159,900
-
2026-01-20price $174,900
-
2025-12-16price $189,900
-
2025-11-12$199,900 Active
-
2007-06-11soldstatus $152,000 561-char remark
Show marketing remark (561 chars)
Spacious home, approx. 1916 square feet per appraiser, features a three bedroom split plan with lots of bay windows. Large great room has a vaulted ceiling, built-in bookcases and a fireplace with gas logs. Cheerful kitchen has a breakfast nook with a bay window, recessed lighting, built-in desk and a pantry. There is also a separate dining room. Master suite has walk-in closet, garden tub plus separate shower. Roof only two years old and central heat and air new in 2006. Mature trees, patio, easily kept yard, detached storage and located on a cul-de-sac.
-
2007-04-26$159,900 561-char remark
Show marketing remark (561 chars)
Spacious home, approx. 1916 square feet per appraiser, features a three bedroom split plan with lots of bay windows. Large great room has a vaulted ceiling, built-in bookcases and a fireplace with gas logs. Cheerful kitchen has a breakfast nook with a bay window, recessed lighting, built-in desk and a pantry. There is also a separate dining room. Master suite has walk-in closet, garden tub plus separate shower. Roof only two years old and central heat and air new in 2006. Mature trees, patio, easily kept yard, detached storage and located on a cul-de-sac.
-
2006-12-12$159,900
-
2006-10-17$174,900
-
2006-06-14$174,900
ⓘ Source: listings_history table (triggers on properties + properties_extension) + one-shot
backfill from property_details.listing_events for pre-trigger history.
Tax reassessment forecast AL · Resets to sale price
- Current annual tax
- $1,981 · $165/mo
- Projected year-2 tax
- $1,981 · $165/mo
- Expected delta
- $0/yr ($0/mo · 0.0%)
ⓘ Screening estimate from a state-policy table — verify with the county assessor before closing.
Climate risk First Street
- Flood 1/10 Low FEMA zone X (unshaded) · 0% chance over 30 yrs
- Wildfire 3/10 Moderate
- Heat 7/10 Severe 7 d/yr ≥108°F today · 20 d/yr by 30 yrs out
- Wind 8/10 Severe 80% chance of damaging wind over 30 yrs
- Air quality 4/10 Moderate 4 unhealthy d/yr today · 5 by 30 yrs out
Nearby sold comps map
Loading sold comps map…
Walkable amenities ~0.75 mi
Loading nearby amenities…
Taxation est. · year 1
- Rental income
- $21,069
- − Mortgage interest
- −$8,117
- − Property taxes
- −$1,981
- − Insurance
- −$724
- − Repairs & maintenance
- −$1,686
- − Management
- −$1,686
- − Depreciation
- −$4,215
- Taxable income
- $2,661
- Est. tax owed @ 24.0%
- −$639
- After-tax cash flow
- $4,182/yr
For passive investors: Depreciation is non-cash, so a rental often shows a tax loss while cash-flowing — sheltering income. Rental losses are passive: they offset passive income freely, and up to $25,000/yr can offset ordinary (W-2) income if you actively participate and your MAGI is under $100k (phasing out to $0 by $150k); unused losses carry forward. On sale, claimed depreciation is recaptured at up to 25%, and gains may owe capital-gains tax (a 1031 exchange can defer both). Figures are a year-1 estimate at your 24.0% rate — not tax advice; consult a CPA.
Schools (NCES district)
- District
- Montgomery County
- NCES district ID
- 0102430
- Math proficiency
- 9% ▼ -21.00%
- Reading proficiency
- 31% ▼ -1.00%
- Median HH income
- $43,902
- Composite
- 17.24/100
- National rank
- #9093
- State rank
- #106 of 129 in AL
Livability — Montgomery
- Score
- 65/100
- State rank
- #138
- US rank
- #13416
Category grades
Schools grade is shown separately in the Schools card above.
Census & demographics
- Census place
- Montgomery, AL
- County
- Montgomery County · 190,016 people
- City population
- 175,913
- Metro
- Montgomery, AL
- Population (ZIP)
- 53,172
- Household income
- $74,720
- Rent vs Own
- Severe rent burden
- 1742.0
Population outlook (Montgomery County) Hauer SSP2
- Today (2025)
- 224,008 people
- By 2030
- 221,460 · -1.1%
- By 2040
- 214,179 · -4.4%
- By 2050
- 204,912 · -8.5%
- By 2075
- 177,821 · -20.6%
- By 2100
- 145,134 · -35.2%
Race, ethnicity, and origin ACS 2023
- Neighborhood character
- Diverse neighborhood (Simpson 0.60)
- Race & ethnicity
- Black 53% White 34% Asian 8% Two or more races 3% Hispanic / Latino 3%
- Common ancestry
- Italian 1% Slovak 1% Lithuanian 1%
- Foreign-born
- 9% · South Korea, Canada, China
- Languages at home
- 90% English-only · Korean 4% Spanish 3% Other Indo-European 1%
Political lean MEDSL · Montgomery
- 2024 margin
- Solid D (+30.7) · D 64.8% · R 34.1% · Other 1.1%
- 2008→2024 swing
- +11.5pp toward D · 2008: 19.2pp · 2024: 30.7pp
- All cycles
- 2024: D+30.7 2020: D+31.5 2016: D+26.2 2012: D+24.3 2008: D+19.2
Not yet ingested
- Civics
- —
Market trends
- HPI YoY
- ▼ -37.24%
- Current HPI
- 148.7728
- Rent YoY
- ▲ 2.99%
- Metro
- Montgomery, AL
- State GDP YoY
- ▲ 2.94%
- F500 in state
- 4
Industry mix (Fortune 500 HQ in AL)
| Industry | F500 HQs | Revenue |
|---|---|---|
| Financial Services | 1 | $8B |
|
||
| Healthcare | 1 | $5B |
|
||
Price history
-17.2% since first listed11 events — show timeline
- 2026-04-22 Pending — MAAR
- 2026-03-30 Price Changed $144,900 MAAR
- 2026-02-24 Price Changed $159,900 MAAR
- 2026-01-20 Price Changed $174,900 MAAR
- 2025-12-16 Price Changed $189,900 MAAR
- 2025-11-12 Listed $199,900 MAAR
- 2007-06-11 Sold (MLS) $152,000 MAAR
- 2007-04-26 Listed $159,900 MAAR
- 2006-12-12 Listed $159,900 MAAR
- 2006-10-17 Listed $174,900 MAAR
- 2006-06-14 Listed $174,900 MAAR
Property tax history
+6.5%/yrLatest (2025): $1,981 · +1.3% YoY. Source: county tax records.
Cash-flow waterfall
monthlySold comps — $/sqft
last 12 mo · ≤1 miLoading sold comps…