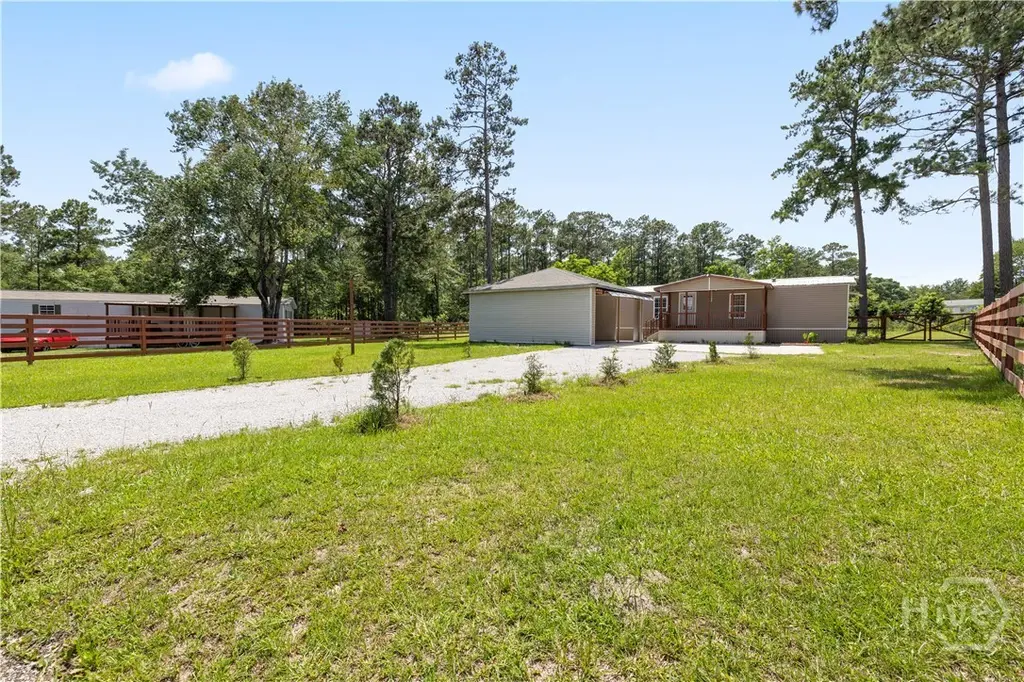
116 Shari Dr · Springfield, GA
Flood risk 1/10 · Minimal
- FEMA flood zone
- X (unshaded)
- Chance of flooding over 30 yrs
- 0.0%
- Est. flood insurance / yr
- $507 – $1,088
Fire risk 6/10 · Moderate
- Est. fire insurance / yr
- $963 – $1,789
Heat risk 8/10 · Major
- Hot days now (above 110°F)
- 7 days/yr
- Hot days in 30 yrs
- 18 days/yr
Wind risk 8/10 · Major
- Chance of severe wind over 30 yrs
- 96.0%
Air-quality risk 2/10 · Minimal
- Unhealthy air days now
- 2 days/yr
- Unhealthy air days in 30 yrs
- 2 days/yr
Risk factors via First Street. Map © Google.
Why this score? — see what drove the C- grade
The composite is a weighted blend of 9 inputs, each scored 0–100. Each bar is that input's sub-score; the figure is the points it added to the 100-point composite (weight × sub-score).
- Cash flow +22.9/30.0
- DSCR +7.4/10.0
- 1% rule +5.0/10.0
- Schools +4.3/10.0
- Livability +3.5/5.0
- Rent growth +2.5/5.0
- Condition / age +2.5/5.0
- ARV discount +2.4/15.0
- Appreciation +0.0/10.0
$209,900
🖨 Deal sheet 📄 Offer letter ✓ Due diligence
Listing remarks MLS
Move in Ready 3 bedroom 2 bath split floor plan mobile home on a large lot (.69 Acre) in Effingham County. From the front porch to the back deck, you will find a living room with vaulted ceilings, kitchen with a breakfast bar and a built-in hutch, master bathroom with double sinks, garden tub, and a walk-in closet. All appliances stay including the washer and dryer. You can own it cheaper than rent! Schedule your appointment today!!
Key facts
- Walk-in closet
- Ensuite bath
- Built-in hutch
Tags
Property features AI
Exterior
- Utilities: Public water; Septic tank
- Home design: Single-story mobile home
- Construction: Aluminum siding
- Exterior features: Lot approximately 0.69 acres; Zoning: AR-2
Interior
- Kitchen: Microwave; Oven; Range; Dishwasher
- Bathrooms: 2 full bathrooms; Accessible full bath
- Heating & cooling: Central heating (electric); Central air conditioning (electric)
- Interior features: Breakfast bar; Double vanity; Vaulted ceilings
- Laundry & utility: Washer hookup in laundry room; Washer; Dryer; Electric water heater
Neighborhood map
What this means for you Summary
Snapshot
- This is a 3-bed/2.0-bath manufactured listed at $210k.
Deal economics
- At list price, monthly cash flow is $371 ($4k/yr) — positive.
- The deal already cash-flows at list — no discount required.
- Meets the 1% rule at list price ($2k rent vs $210k).
- Cap rate 8.4% vs local median 4.2% in Springfield — top-decile yield for the area; either an underpriced asset or a hidden risk that comps aren't pricing in. Stress-test before assuming the spread holds.
Location & tenants
- Location reads 69/100 on livability (#116 in GA) — a middle-class / working-renter tenant base. Strengths: cost of living A+, housing A+, crime A; Watch: employment C-, schools D-, amenities F.
- Effingham County (rural): math 49% / reading 48% proficiency, ranked #16 of 174 in GA (top 9%) — families likely to look elsewhere, expect single-tenant / working-renter base with shorter leases.
- Market conditions: 399 active listings in the ZIP; 1 comparable units currently listed for rent nearby; solid renter incomes; 836 units permitted in Effingham County in 2024 (46 in 5+ unit buildings).
Forward outlook
- Local home prices are declining (-3.0%/yr); year-one equity from $1k of loan paydown is wiped out by about $6k of value loss. Plan a longer hold.
- Effingham County population projected at +33% by 2050 — long-run rental-demand tailwind backs the buy-and-hold thesis.
Negotiation context
- Only 6 days on market — expect competitive offers; lowballing is unlikely to land.
- 3 sale attempts since 3y ago with the ask held roughly flat each time — persistent listings suggest the price (not the market) is what's stuck; bring a comps-based counter.
- Current owner paid $115k; list at $210k implies a 83% gain — meaningful room to come down on a strong offer.
Risks & watch-outs
- Climate carrying-cost: severe wind risk, 96% chance of damaging wind over 30y; major wildfire risk; extreme-heat days projected 7→18/yr by 2055 (HVAC capex compounding) — expect insurance premiums to compound above CPI over the hold.
Questions for the listing agent
- Is there a deadline driving the sale (1031 exchange, divorce, estate, relocation)? That informs how much negotiation room exists.
- Schools are D-rated, which usually means shorter tenancies and higher turnover. Who's the typical renter profile here, and what's been the actual vacancy rate?
- What's the average days-on-market for RENTAL listings here right now (not sales)? A rising rental-DOM trend means longer vacancies and softer asking-rent achievability than the comps imply.
- What's the recent tenant-quality profile in this submarket — average credit score on applications, eviction rate, late-payment / NSF rate, and stable-employment percentage? A property-management company in the area should have these aggregated.
- How much new for-sale + rental construction is in the pipeline within 1–3 miles? Heavy new supply typically softens prices + rents 12–24 months out; constrained supply supports both.
Investment metrics
- 1% rule
- 1.00% ✓
- Cap rate
- 8.41%
- Cash-on-cash
- 7.57%
- DSCR
- 1.34
- GRM
- 8.3
CMA / ARV
- ARV (on-the-fly)
- $188,480
- Comps found
- 5
Show comp detail 5 sales within ~0.75 mi
| Address | Dist | Beds/Ba | Sqft | Sold | Price | $/sf | Match |
|---|---|---|---|---|---|---|---|
| 114 Shari Dr | 0.02mi | 3/2.0 | 1,216 (0%) | 5mo | $172,400 | $142 | 95 |
| 120 Shari Dr | 0.05mi | 3/2.0 | 1,216 (0%) | 15mo | $188,000 | $155 | 85 |
| 110 Shari Dr | 0.07mi | 3/2.0 | 1,280 (+5%) | 5mo | $170,000 | $133 | 84 |
| 115 Shari Dr | 0.06mi | 2/2.0 (-1) | 1,216 (0%) | 18mo | $219,500 | $181 | 78 |
| 269 Hutcheson Ln | 0.62mi | 3/2.0 | 1,152 (-5%) | 10mo | $220,000 | $191 | 54 |
Match score weights: distance 35% · size 25% · config 20% · recency 20%. Top-matched comps best support the ARV.
Projected returns pro-forma
-3.0% appreciation · 3.0% rent growth · sell at horizon
- IRR
- -4.8%
- Equity multiple
- 0.82×
- Total profit
- $-10,472
- Equity at exit
- $31,297
- IRR
- 4.9%
- Equity multiple
- 1.36×
- Total profit
- $21,016
- Equity at exit
- $18,148
Cash invested: $58,772 (down + closing). Projections, not guarantees.
Landlord ↔ Tenant lean methodology
- Overall (STATE)
- 90 Strongly Landlord-Friendly
- State Georgia
- 90 Strongly Landlord-Friendly · R+3
- County
- — inherits STATE
- City
- — inherits STATE
ZIP-level market 31312
- Home prices YoY
- -26.6%
- Active inventory
- 399
- Price-to-rent
- 8.3×
Monthly cashflow live
- Estimated rent
- $2,108 medium interval (Pro) →
- Mortgage (P&I)
- −$1,101
- Tax from tax record
- −$107 /mo · $1,282/yr
- Insurance
- −$87
- HOA
- −$0
- Vacancy / Maint / Mgmt
- −$443
- Net cashflow
- $371
Break-even live
UW: 25.0% down · 7.5% · 30yr · 1.5% tax · 5.0% vac · 8.0% maint · 8.0% mgmt
Financing live
Cash to close
- Down payment
- $52,475
- Closing costs
- $6,297
- Reserves months
- —
- Total cash needed
- —
Loan-product check · same deal, 3 products live
Conventional
25% down · 7.5% · 30yr
- Down + closing
- —
- Monthly P&I
- —
- Monthly cashflow
- —
- DSCR
- —
- Eligible?
- —
Personal DTI + credit; lowest rate.
DSCR
20% down · 8.5% · 30yr
- Down + closing
- —
- Monthly P&I
- —
- Monthly cashflow
- —
- DSCR
- —
- Eligible?
- —
No personal income docs; deal must DSCR.
Hard money
10% down · 12.0% · 12mo
- Down + closing
- —
- Monthly P&I
- —
- Monthly cashflow
- —
- DSCR
- —
- Eligible?
- —
Short-term bridge; refi at stabilization.
Rent comps 1 comps
| Address | Beds | Baths | Sqft | Rent | $/sqft | DOM | Units | Dist |
|---|---|---|---|---|---|---|---|---|
| 109 Eagle Dr Springfield, GA | 3.0 | 2.0 | 1456 | $1,675 | $1.15 | 23d | 1 | 1.23mi |
Listing history 6 events
-
2026-06-18days on market $209,900 Active 6 DOM
-
2026-06-17days on market $209,900 Active 5 DOM
-
2026-06-16days on market $209,900 Active 4 DOM
-
2026-06-15days on market $209,900 Active 3 DOM
-
2026-06-13remarks 699-char remark
-
2026-06-13$209,900 Active 1 DOM
ⓘ Source: listings_history table (triggers on properties + properties_extension) + one-shot
backfill from property_details.listing_events for pre-trigger history.
Tax reassessment forecast GA · Resets to sale price
- Current annual tax
- $1,282 · $107/mo
- Projected year-2 tax
- $1,931 · $161/mo
- Expected delta
- +$649/yr (+$54/mo · 50.6%)
ⓘ Screening estimate from a state-policy table — verify with the county assessor before closing.
Climate risk First Street
- Flood 1/10 Low FEMA zone X (unshaded) · 0% chance over 30 yrs
- Wildfire 6/10 Major
- Heat 8/10 Severe 7 d/yr ≥110°F today · 18 d/yr by 30 yrs out
- Wind 8/10 Severe 96% chance of damaging wind over 30 yrs
- Air quality 2/10 Low 2 unhealthy d/yr today · 2 by 30 yrs out
Nearby sold comps map
Loading sold comps map…
Walkable amenities ~0.75 mi
Loading nearby amenities…
Taxation est. · year 1
- Rental income
- $25,301
- − Mortgage interest
- −$11,758
- − Property taxes
- −$1,282
- − Insurance
- −$1,050
- − Repairs & maintenance
- −$2,024
- − Management
- −$2,024
- − Depreciation
- −$6,106
- Taxable income
- $1,057
- Est. tax owed @ 24.0%
- −$254
- After-tax cash flow
- $4,194/yr
For passive investors: Depreciation is non-cash, so a rental often shows a tax loss while cash-flowing — sheltering income. Rental losses are passive: they offset passive income freely, and up to $25,000/yr can offset ordinary (W-2) income if you actively participate and your MAGI is under $100k (phasing out to $0 by $150k); unused losses carry forward. On sale, claimed depreciation is recaptured at up to 25%, and gains may owe capital-gains tax (a 1031 exchange can defer both). Figures are a year-1 estimate at your 24.0% rate — not tax advice; consult a CPA.
Schools (NCES district)
- District
- Effingham County
- NCES district ID
- 1301980
- Math proficiency
- 49% ▼ -6.00%
- Reading proficiency
- 48% ▼ -5.00%
- Median HH income
- $60,503
- Composite
- 42.56/100
- National rank
- #3195
- State rank
- #16 of 174 in GA
Livability — Springfield
- Score
- 69/100
- State rank
- #116
- US rank
- #8573
Category grades
Schools grade is shown separately in the Schools card above.
Census & demographics
- County
- Effingham County · 68,439 people
- Metro
- Savannah, GA
- Population (ZIP)
- 25,991
- Household income
- $101,750
- Rent vs Own
- Severe rent burden
- 97.0
Population outlook (Effingham County) Hauer SSP2
- Today (2025)
- 67,399 people
- By 2030
- 72,297 · +7.3%
- By 2040
- 81,602 · +21.1%
- By 2050
- 89,494 · +32.8%
- By 2075
- 105,976 · +57.2%
- By 2100
- 111,943 · +66.1%
Race, ethnicity, and origin ACS 2023
- Neighborhood character
- Predominantly White (75%)
- Race & ethnicity
- White 75% Black 11% Two or more races 9% Hispanic / Latino 7%
- Hispanic origin (detail)
- Mexican 3% Puerto Rican 2% Cuban 1%
- Common ancestry
- Slovak 2% Italian 2% Lithuanian 1%
- Foreign-born
- 3% · Canada
- Languages at home
- 96% English-only · Spanish 2%
Political lean MEDSL · Effingham
- 2024 margin
- Solid R (+49.1) · D 25.2% · R 74.3%
- 2008→2024 swing
- +1.6pp toward D · 2008: -50.7pp · 2024: -49.1pp
- All cycles
- 2024: R+49.1 2020: R+49.5 2016: R+55.6 2012: R+51.2 2008: R+50.7
Not yet ingested
- Civics
- —
Market trends
- HPI YoY
- ▼ -74.77%
- Current HPI
- 205.9899
- Rent YoY
- —
- Metro
- Savannah, GA
- State GDP YoY
- ▲ 2.66%
- F500 in state
- 28
Industry mix (Fortune 500 HQ in GA)
| Industry | F500 HQs | Revenue |
|---|---|---|
| Paper / Packaging | 2 | $29B |
|
||
| Retail | 1 | $160B |
|
||
| Transportation / Logistics | 1 | $91B |
|
||
| Airlines | 1 | $62B |
|
||
| Consumer Goods | 1 | $47B |
|
||
| Utilities | 1 | $25B |
|
||
Price history
+1539.8% since first listed8 events — show timeline
- 2026-06-10 Listed $209,900 Hive MLS
- 2024-01-05 Sold (Public Records) $115,000 Public Records
- 2023-12-29 Sold (MLS) $115,000 Hive MLS
- 2023-12-29 Sold (MLS) $115,000 GAMLS
- 2023-12-21 Pending — GAMLS
- 2023-12-03 Listed $129,900 Hive MLS
- 2023-12-03 Listed $129,900 GAMLS
- 1997-08-21 Sold (Public Records) $12,800 Public Records
Property tax history
+5.9%/yrLatest (2025): $1,282 · +118.2% YoY. Source: county tax records.
Cash-flow waterfall
monthlySold comps — $/sqft
last 12 mo · ≤1 miLoading sold comps…