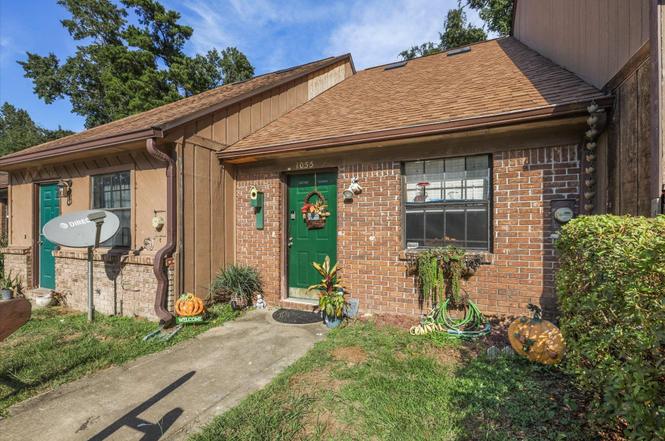
1055 Ocala Rd · Tallahassee, FL
Flood risk 1/10 · Minimal
- FEMA flood zone
- X (unshaded)
- Chance of flooding over 30 yrs
- 0.0%
- Est. flood insurance / yr
- $507 – $1,088
Fire risk 1/10 · Minimal
- Est. fire insurance / yr
- $947 – $1,759
Heat risk 8/10 · Major
- Hot days now (above 108°F)
- 7 days/yr
- Hot days in 30 yrs
- 20 days/yr
Wind risk 9/10 · Severe
- Chance of severe wind over 30 yrs
- 99.0%
Air-quality risk 5/10 · Moderate
- Unhealthy air days now
- 7 days/yr
- Unhealthy air days in 30 yrs
- 7 days/yr
Risk factors via First Street. Map © Google.
Why this score? — see what drove the F grade
The composite is a weighted blend of 9 inputs, each scored 0–100. Each bar is that input's sub-score; the figure is the points it added to the 100-point composite (weight × sub-score).
- Cash flow +11.4/30.0
- Schools +4.3/10.0
- Livability +4.3/5.0
- Rent growth +3.7/5.0
- DSCR +3.3/10.0
- 1% rule +2.8/10.0
- Condition / age +2.5/5.0
- ARV discount +1.4/15.0
- Appreciation +0.0/10.0
$159,000
🖨 Deal sheet 📄 Offer letter ✓ Due diligence
Listing remarks MLS
2/2 close to campus; shopping and restaurants. Vaulted Ceilings; ceramic tile; open floor plan. Patio and wood deck. Currently tenant occupied. Perfect for investors!
Key facts
- Private bedrooms
- Convenient access
- Open living area
Tags
Property features AI
Finance
- Other: Property is for sale
- HOA & community: Monthly association fee of $495; Association covers common areas, grounds maintenance, and trash
Exterior
- Parking: Parking space(s)
- Utilities: Public sewer
- Home design: Brick construction
- Construction: Brick construction
- Exterior features: Paved, publicly maintained road
Interior
- Kitchen: Microwave; Oven; Range; Refrigerator
- Bedrooms: Bedroom 2: 10x12
- Flooring: Laminate flooring; Tile flooring
- Bathrooms: 2 full bathrooms
- Heating & cooling: Central heating (electric); Central air conditioning (electric); Ceiling fans
- Interior features: High ceilings; Central vacuum; Primary bedroom on main floor
Neighborhood map
What this means for you Summary
Snapshot
- This is a 2-bed/2.0-bath townhouse listed at $159k.
Deal economics
- At list price, monthly cash flow is $-55 ($-659/yr) — negative.
- To cash-flow at today's rent, offer at most $149k (6.1% below list).
- To meet the 1% rule (rent ≥ 1% of price), the offer needs to be $124k (22.3% below list).
- Recommended offer: $124k (22.3% below list) — sets the bar for 1% rule.
- Cap rate 5.9% vs local median 4.2% in Tallahassee — top-decile yield for the area; either an underpriced asset or a hidden risk that comps aren't pricing in. Stress-test before assuming the spread holds.
Location & tenants
- Location reads 86/100 on livability (#19 in FL, #429 nationally) — a professional / high-income tenant draw. Strengths: amenities A+, commute A+, health & safety A+; Watch: employment D.
- Leon (urban): math 48% / reading 53% proficiency, ranked #33 of 73 in FL (top 45%) — acceptable for families but not a draw, mixed tenant base, ~2y average lease.
- Market conditions: Rents rising fast (+4.7%/yr); 142 active listings in the ZIP; 40 comparable units currently listed for rent nearby; rentals at typical pace (median 21d on market — plan ~3-4 weeks tenant-placement turnaround); lower-income renter base — watch delinquency; 1,765 units permitted in Leon County in 2024 (975 in 5+ unit buildings).
- At $1,236/mo this rent would consume 46% of the median local household income ($32k/yr) (locally 6995% of renters already pay >50% of income on rent) — very limited rent-growth headroom before tenants either downsize or default.
Forward outlook
- Local home prices are declining (-3.0%/yr); year-one equity from $1k of loan paydown is wiped out by about $5k of value loss. Plan a longer hold.
- Leon County population projected at +23% by 2050 — long-run rental-demand tailwind backs the buy-and-hold thesis.
Negotiation context
- It's been on market 140 days — a 12% lower offer ($140k) is reasonable based on typical stale-listing flexibility.
- 3 sale attempts since 4y ago with the ask held roughly flat each time — persistent listings suggest the price (not the market) is what's stuck; bring a comps-based counter.
- Current owner paid $120k; 33% above their basis — modest negotiation headroom, anchor on the comps not their cost.
Risks & watch-outs
- Climate carrying-cost: severe wind risk, 99% chance of damaging wind over 30y; extreme-heat days projected 7→20/yr by 2055 (HVAC capex compounding) — expect insurance premiums to compound above CPI over the hold.
Questions for the listing agent
- What do current leases actually rent for vs. the listed asking? Can we see a recent rent roll and the last 12 months of T-12 income?
- It's been on market 140 days. Have you received any prior offers? Is the seller open to a 22% concession, seller financing, or rate buy-down credit?
- What does the HOA fee cover, when was the last increase, and are there any pending special assessments or reserve-fund shortfalls?
- Why hasn't it sold? Are there any deal-killer items the seller is aware of (foundation, flood, title, zoning, code violations)?
- Is there a deadline driving the sale (1031 exchange, divorce, estate, relocation)? That informs how much negotiation room exists.
- Schools are B-rated — typically a magnet for longer-tenancy family renters. What's the average tenant stay here, and is there a school-zone premium baked into asking?
- The area grade is low — what's the realistic commute time and amenity access for the typical tenant pool here? Any planned neighborhood developments (good or bad) we should know about?
- What's the average days-on-market for RENTAL listings here right now (not sales)? A rising rental-DOM trend means longer vacancies and softer asking-rent achievability than the comps imply.
- What's the recent tenant-quality profile in this submarket — average credit score on applications, eviction rate, late-payment / NSF rate, and stable-employment percentage? A property-management company in the area should have these aggregated.
- How much new for-sale + rental construction is in the pipeline within 1–3 miles? Heavy new supply typically softens prices + rents 12–24 months out; constrained supply supports both.
Investment metrics
- 1% rule
- 0.78% ✗
- Cap rate
- 5.88%
- Cash-on-cash
- -1.48%
- DSCR
- 0.93
- GRM
- 10.7
CMA / ARV
- ARV (on-the-fly)
- $140,128
- Comps found
- 12
Show comp detail 12 sales within ~0.75 mi
| Address | Dist | Beds/Ba | Sqft | Sold | Price | $/sf | Match |
|---|---|---|---|---|---|---|---|
| 1097 Ocala Rd #32 | 0.10mi | 2/2.0 | 928 (0%) | 2mo | $118,000 | $127 | 94 |
| 1127 Ocala Rd | 0.03mi | 2/2.0 | 928 (0%) | 6mo | $140,000 | $151 | 93 |
| 1214 High Rd | 0.22mi | 2/2.0 | 928 (0%) | 3mo | $157,000 | $169 | 88 |
| 1108 Greentree Ct Unit M | 0.29mi | 2/2.0 | 888 (-4%) | 1mo | $123,000 | $139 | 78 |
| 754 Gold Nugget Trl | 0.30mi | 2/2.0 | 1,050 (+13%) | 1mo | $149,000 | $142 | 63 |
| 765 Gold Nugget Trl | 0.30mi | 2/2.0 | 1,050 (+13%) | 1mo | $150,000 | $143 | 63 |
| 2285 Green Timbers Trl Unit A | 0.53mi | 2/1.5 | 987 (+6%) | 1mo | $145,000 | $147 | 62 |
| 2312 Timber Oaks Ln #57 | 0.61mi | 2/2.0 | 984 (+6%) | 1mo | $175,900 | $179 | 60 |
| 755 Gold Nugget Trl | 0.31mi | 2/2.0 | 1,050 (+13%) | 4mo | $149,000 | $142 | 60 |
| 2313 Green Timbers Trl Unit B | 0.56mi | 2/1.5 | 987 (+6%) | 6mo | $169,000 | $171 | 57 |
| 741 White Dr #32 | 0.64mi | 2/2.0 | 984 (+6%) | 4mo | $163,000 | $166 | 57 |
| 741 White Dr | 0.64mi | 2/2.0 | 984 (+6%) | 6mo | $175,000 | $178 | 55 |
Match score weights: distance 35% · size 25% · config 20% · recency 20%. Top-matched comps best support the ARV.
Projected returns pro-forma
-3.0% appreciation · 4.69% rent growth · sell at horizon
- IRR
- -17.0%
- Equity multiple
- 0.39×
- Total profit
- $-27,151
- Equity at exit
- $23,707
- IRR
- -6.3%
- Equity multiple
- 0.57×
- Total profit
- $-19,167
- Equity at exit
- $13,747
Cash invested: $44,520 (down + closing). Projections, not guarantees.
Landlord ↔ Tenant lean methodology
- Overall (STATE)
- 87 Strongly Landlord-Friendly
- State Florida
- 87 Strongly Landlord-Friendly · R+3
- County
- — inherits STATE
- City
- — inherits STATE
ZIP-level market 32304
- Home prices YoY
- -21.2%
- Rents YoY
- 4.7%
- Active inventory
- 142
- Price-to-rent
- 10.7×
Monthly cashflow live
- Estimated rent
- $1,236 high interval (Pro) →
- Mortgage (P&I)
- −$834
- Tax from tax record
- −$90 /mo · $1,082/yr
- Insurance
- −$66
- HOA
- −$41
- Vacancy / Maint / Mgmt
- −$260
- Net cashflow
- $-55
Break-even live
UW: 25.0% down · 7.5% · 30yr · 1.5% tax · 5.0% vac · 8.0% maint · 8.0% mgmt
Financing live
Cash to close
- Down payment
- $39,750
- Closing costs
- $4,770
- Reserves months
- —
- Total cash needed
- —
Loan-product check · same deal, 3 products live
Conventional
25% down · 7.5% · 30yr
- Down + closing
- —
- Monthly P&I
- —
- Monthly cashflow
- —
- DSCR
- —
- Eligible?
- —
Personal DTI + credit; lowest rate.
DSCR
20% down · 8.5% · 30yr
- Down + closing
- —
- Monthly P&I
- —
- Monthly cashflow
- —
- DSCR
- —
- Eligible?
- —
No personal income docs; deal must DSCR.
Hard money
10% down · 12.0% · 12mo
- Down + closing
- —
- Monthly P&I
- —
- Monthly cashflow
- —
- DSCR
- —
- Eligible?
- —
Short-term bridge; refi at stabilization.
Rent comps 40 comps
| Address | Beds | Baths | Sqft | Rent | $/sqft | DOM | Units | Dist |
|---|---|---|---|---|---|---|---|---|
| 2020 Continental Ave Tallahassee, FL | 1.0–2.0 | 1.0–1.5 | 850 | $1,300 | $1.53 | 21d | 3 | 0.16mi |
| 2060 Continental Ave Tallahassee, FL | 1.0–3.0 | 1.0–2.5 | 1121 | $1,052 | $0.94 | 13d | 26 | 0.16mi |
| 1001 Ocala Rd Tallahassee, FL | 4.0 | 1.0–2.0 | 899 | $584 | $0.65 | 21d | 6 | 0.20mi |
| 1111 High Rd Tallahassee, FL | 2.0–3.0 | 2.0 | 1000 | $1,409 | $1.41 | 13d | 11 | 0.26mi |
| 1303 Ocala Rd Tallahassee, FL | 1.0–4.0 | 1.0–2.0 | 1121 | $1,320 | $1.18 | 13d | 48 | 0.28mi |
| 1108 Greentree Ct Tallahassee, FL | 2.0 | 2.0 | 888 | $1,275 | $1.44 | 21d | 1 | 0.30mi |
| 1360 Ocala Rd Tallahassee, FL | 2.0 | 1.0 | 800 | $1,000 | $1.25 | 21d | 1 | 0.38mi |
| 1380 Ocala Rd Tallahassee, FL | 1.0 | 1.0 | 700 | $975 | $1.39 | 21d | 1 | 0.45mi |
| 1410 Nylic St Unit B Tallahassee, FL | 2.0 | 1.0 | 550 | $900 | $1.64 | 13d | 1 | 0.63mi |
| 810 Wadsworth St Tallahassee, FL | 1.0 | 1.0 | 600 | $1,123 | $1.87 | 13d | 2 | 0.65mi |
| 2350 Horne Ave Unit 2 Tallahassee, FL | 2.0 | 2.0 | 800 | $995 | $1.24 | 21d | 1 | 0.67mi |
| 2353 W Mission Rd Tallahassee, FL | 2.0–3.0 | 2.0–2.5 | 1012 | $1,250 | $1.23 | 13d | 11 | 0.68mi |
| 2349 Horne Ave Unit C Tallahassee, FL | 2.0 | 1.0 | 680 | $1,100 | $1.62 | 13d | 1 | 0.68mi |
| 1812 W Tharpe St Unit D Tallahassee, FL | 1.0 | 1.0 | 650 | $950 | $1.46 | 21d | 1 | 0.69mi |
| 322 Conradi St Tallahassee, FL | 3.0 | 2.0 | 1100 | $1,950 | $1.77 | 21d | 4 | 0.75mi |
| 836 Richmond St Unit 10 Tallahassee, FL | 1.0 | 1.0 | 540 | $875 | $1.62 | 13d | 1 | 0.79mi |
| 836 Richmond St Unit 10 Tallahassee, FL | 1.0 | 1.0 | 540 | $875 | $1.62 | 21d | 1 | 0.79mi |
| 1325 W Tharpe St Tallahassee, FL | 1.0–3.0 | 1.0–4.0 | 937 | $1,511 | $1.61 | 13d | 21 | 0.83mi |
| 214 White Dr Unit F Tallahassee, FL | 1.0 | 1.0 | 656 | $1,200 | $1.83 | 21d | 1 | 0.92mi |
| 205 White Dr Tallahassee, FL | 1.0–4.0 | 1.0–4.0 | 1155 | $637 | $0.55 | 21d | 1 | 0.92mi |
| 218 White Dr Tallahassee, FL | 1.0 | 1.0 | 660 | $995 | $1.51 | 21d | 1 | 0.94mi |
| 2202 W Pensacola St Tallahassee, FL | 1.0–3.0 | 1.0 | 950 | $1,224 | $1.29 | 21d | 3 | 0.99mi |
| 2259 Parrot Ln Tallahassee, FL | 2.0 | 2.0 | 992 | $1,275 | $1.29 | 21d | 1 | 1.01mi |
| 2327 Parrot Ln Tallahassee, FL | 3.0 | 2.0 | 1088 | $1,300 | $1.19 | 21d | 1 | 1.04mi |
| 220 Atkinson Dr Unit D Tallahassee, FL | 2.0 | 1.0 | 928 | $1,100 | $1.19 | 21d | 1 | 1.06mi |
| 916 N Woodward Ave #1 Tallahassee, FL | 2.0 | 1.0 | 794 | $1,000 | $1.26 | 13d | 1 | 1.06mi |
| 2614 W Tennessee St Tallahassee, FL | 1.0–4.0 | 1.0–4.0 | 1270 | $1,159 | $0.91 | 21d | 14 | 1.10mi |
| 2616 Mission Rd Tallahassee, FL | 1.0–2.0 | 1.0 | 750 | $1,195 | $1.59 | 13d | 12 | 1.10mi |
| 1854 Belle Vue Way Tallahassee, FL | 2.0–4.0 | 1.0–2.0 | 1100 | $1,235 | $1.12 | 21d | 1 | 1.10mi |
| 301 S Lipona Rd #24 Tallahassee, FL | 2.0 | 1.5 | 896 | $1,350 | $1.51 | 21d | 1 | 1.13mi |
| 316 Ausley Rd Tallahassee, FL | 1.0–4.0 | 1.0–2.0 | 750 | $798 | $1.06 | 13d | 8 | 1.17mi |
| 317 Mabry St Tallahassee, FL | 2.0 | 1.0 | 808 | $898 | $1.11 | 21d | 1 | 1.20mi |
| 394 Prince St Unit 394-PRI Tallahassee, FL | 1.0 | 1.0 | 600 | $1,250 | $2.08 | 21d | 1 | 1.31mi |
| 2350 Wanda Way Tallahassee, FL | 2.0–3.0 | 1.0 | 861 | $1,200 | $1.39 | 21d | 1 | 1.32mi |
| 103 Cactus St Tallahassee, FL | 2.0–4.0 | 1.0–2.0 | 1000 | $1,195 | $1.20 | 13d | 3 | 1.32mi |
| 2301 Old Bainbridge Rd Tallahassee, FL | 2.0–3.0 | 1.0–2.0 | 1084 | $1,200 | $1.11 | 21d | 1 | 1.36mi |
| 1818 Sylvan Ct Unit D Tallahassee, FL | 2.0 | 1.0 | 850 | $1,200 | $1.41 | 13d | 1 | 1.41mi |
| 2309 Old Bainbridge Rd Tallahassee, FL | 1.0–2.0 | 1.0–2.0 | 798 | $1,420 | $1.78 | 13d | 10 | 1.41mi |
| 2401 Atlas Rd Unit B Tallahassee, FL | 2.0 | 1.0 | 900 | $1,100 | $1.22 | 21d | 1 | 1.43mi |
| 2125 Jackson Bluff Rd Tallahassee, FL | 1.0–3.0 | 1.0–2.0 | 975 | $1,172 | $1.20 | 21d | 4 | 1.44mi |
HOA detail
- Monthly dues
- $41 · $492/yr
Listing history 28 events
-
2026-06-18days on market $159,000 Active 140 DOM
-
2026-06-17days on market $159,000 Active 139 DOM
-
2026-06-16days on market $159,000 Active 138 DOM
-
2026-06-15days on market $159,000 Active 137 DOM
-
2026-06-14days on market $159,000 Active 135 DOM
-
2026-06-10days on market $159,000 Active 132 DOM
-
2026-06-09days on market $159,000 Active 131 DOM
-
2026-06-08days on market $159,000 Active 130 DOM
-
2026-06-07days on market $159,000 Active 129 DOM
-
2026-06-05days on market $159,000 Active 126 DOM
-
2026-06-03days on market $159,000 Active 125 DOM
-
2026-06-02days on market $159,000 Active 124 DOM
-
2026-06-01days on market $159,000 Active 123 DOM
-
2026-05-31days on market $159,000 Active 122 DOM
-
2026-05-30days on market $159,000 Active 121 DOM
-
2026-01-29$159,000 Active
-
2025-11-17historical
-
2025-09-12$159,000 Active
-
2022-09-23soldstatus $119,900 Closed 166-char remark
Show marketing remark (166 chars)
2/2 close to campus; shopping and restaurants. Vaulted Ceilings; ceramic tile; open floor plan. Patio and wood deck. Currently tenant occupied. Perfect for investors!
-
2022-09-23soldstatus $119,900
Show marketing remark (166 chars)
2/2 close to campus; shopping and restaurants. Vaulted Ceilings; ceramic tile; open floor plan. Patio and wood deck. Currently tenant occupied. Perfect for investors!
-
2022-08-29historical Active Under Contract 166-char remark
Show marketing remark (166 chars)
2/2 close to campus; shopping and restaurants. Vaulted Ceilings; ceramic tile; open floor plan. Patio and wood deck. Currently tenant occupied. Perfect for investors!
-
2022-08-18$119,900 Active 166-char remark
Show marketing remark (166 chars)
2/2 close to campus; shopping and restaurants. Vaulted Ceilings; ceramic tile; open floor plan. Patio and wood deck. Currently tenant occupied. Perfect for investors!
-
2008-08-15soldstatus $105,000
-
2005-06-16soldstatus $89,900
-
2003-09-02soldstatus $69,500
-
1997-12-08soldstatus $50,000
-
1997-11-05soldstatus $50,000
-
1993-04-01soldstatus $53,550
ⓘ Source: listings_history table (triggers on properties + properties_extension) + one-shot
backfill from property_details.listing_events for pre-trigger history.
Tax reassessment forecast FL · Resets to sale price
- Current annual tax
- $1,082 · $90/mo
- Projected year-2 tax
- $1,320 · $110/mo
- Expected delta
- +$238/yr (+$20/mo · 22.0%)
ⓘ Screening estimate from a state-policy table — verify with the county assessor before closing.
Climate risk First Street
- Flood 1/10 Low FEMA zone X (unshaded) · 0% chance over 30 yrs
- Wildfire 1/10 Low
- Heat 8/10 Severe 7 d/yr ≥108°F today · 20 d/yr by 30 yrs out
- Wind 9/10 Extreme 99% chance of damaging wind over 30 yrs
- Air quality 5/10 Major 7 unhealthy d/yr today · 7 by 30 yrs out
Nearby sold comps map
Loading sold comps map…
Walkable amenities ~0.75 mi
Loading nearby amenities…
Taxation est. · year 1
- Rental income
- $14,830
- − Mortgage interest
- −$8,906
- − Property taxes
- −$1,082
- − Insurance
- −$795
- − Repairs & maintenance
- −$1,186
- − Management
- −$1,186
- − HOA
- −$492
- − Depreciation
- −$4,625
- Taxable loss
- −$3,444
- Est. tax savings @ 24.0%
- +$827
- After-tax cash flow
- $167/yr
For passive investors: Depreciation is non-cash, so a rental often shows a tax loss while cash-flowing — sheltering income. Rental losses are passive: they offset passive income freely, and up to $25,000/yr can offset ordinary (W-2) income if you actively participate and your MAGI is under $100k (phasing out to $0 by $150k); unused losses carry forward. On sale, claimed depreciation is recaptured at up to 25%, and gains may owe capital-gains tax (a 1031 exchange can defer both). Figures are a year-1 estimate at your 24.0% rate — not tax advice; consult a CPA.
Schools (NCES district)
- District
- Leon
- NCES district ID
- 1201110
- Math proficiency
- 48% ▼ -13.00%
- Reading proficiency
- 53% ▼ -5.00%
- Median HH income
- $46,339
- Composite
- 42.84/100
- National rank
- #3131
- State rank
- #33 of 73 in FL
Livability — Tallahassee
- Score
- 86/100
- State rank
- #19
- US rank
- #429
Category grades
Schools grade is shown separately in the Schools card above.
Census & demographics
- Census place
- Tallahassee, FL
- County
- Leon County · 294,472 people
- City population
- 294,472
- Metro
- Tallahassee, FL
- Population (ZIP)
- 51,673
- Household income
- $32,348
- Rent vs Own
- Severe rent burden
- 6995.0
Population outlook (Leon County) Hauer SSP2
- Today (2025)
- 315,507 people
- By 2030
- 330,677 · +4.8%
- By 2040
- 358,465 · +13.6%
- By 2050
- 386,804 · +22.6%
- By 2075
- 465,480 · +47.5%
- By 2100
- 519,959 · +64.8%
Race, ethnicity, and origin ACS 2023
- Neighborhood character
- Diverse neighborhood (Simpson 0.65)
- Race & ethnicity
- White 45% Black 36% Hispanic / Latino 10% Two or more races 7% Asian 4%
- Hispanic origin (detail)
- Mexican 2% Puerto Rican 2% Cuban 2%
- Common ancestry
- Romanian 2% Lithuanian 1% Italian 1%
- Foreign-born
- 8% · Canada, China
- Languages at home
- 86% English-only · Spanish 7% Other Indo-European 2% French/Haitian/Cajun 1%
Political lean MEDSL · Leon
- 2024 margin
- Strong D (+21.8) · D 60.3% · R 38.5% · Other 1.2%
- 2008→2024 swing
- -2.5pp toward R · 2008: 24.3pp · 2024: 21.8pp
- All cycles
- 2024: D+21.8 2020: D+28.3 2016: D+25.1 2012: D+23.6 2008: D+24.3
Not yet ingested
- Civics
- —
Market trends
- HPI YoY
- ▼ -72.04%
- Current HPI
- 267.8426
- Rent YoY
- ▲ 4.69%
- Metro
- Tallahassee, FL
- State GDP YoY
- ▲ 3.28%
- F500 in state
- 36
Industry mix (Fortune 500 HQ in FL)
| Industry | F500 HQs | Revenue |
|---|---|---|
| Industrial Technology | 2 | $29B |
|
||
| Insurance | 2 | $17B |
|
||
| Retail | 1 | $60B |
|
||
| Technology Distribution | 1 | $58B |
|
||
| Homebuilding | 1 | $35B |
|
||
| Technology Manufacturing | 1 | $35B |
|
||
Price history
+196.9% since first listed13 events — show timeline
- 2026-01-29 Listed $159,000 CATRS
- 2025-11-17 Listing Removed — CATRS
- 2025-09-12 Listed $159,000 CATRS
- 2022-09-23 Sold (Public Records) $119,900 Public Records
- 2022-09-23 Sold (MLS) $119,900 CATRS
- 2022-08-29 Contingent — CATRS
- 2022-08-18 Listed $119,900 CATRS
- 2008-08-15 Sold (Public Records) $105,000 Public Records
- 2005-06-16 Sold (Public Records) $89,900 Public Records
- 2003-09-02 Sold (Public Records) $69,500 Public Records
- 1997-12-08 Sold (Public Records) $50,000 Public Records
- 1997-11-05 Sold (Public Records) $50,000 Public Records
- 1993-04-01 Sold (Public Records) $53,550 Public Records
Property tax history
+7.1%/yrLatest (2025): $1,082 · +4.0% YoY. Source: county tax records.
Cash-flow waterfall
monthlySold comps — $/sqft
last 12 mo · ≤1 miLoading sold comps…