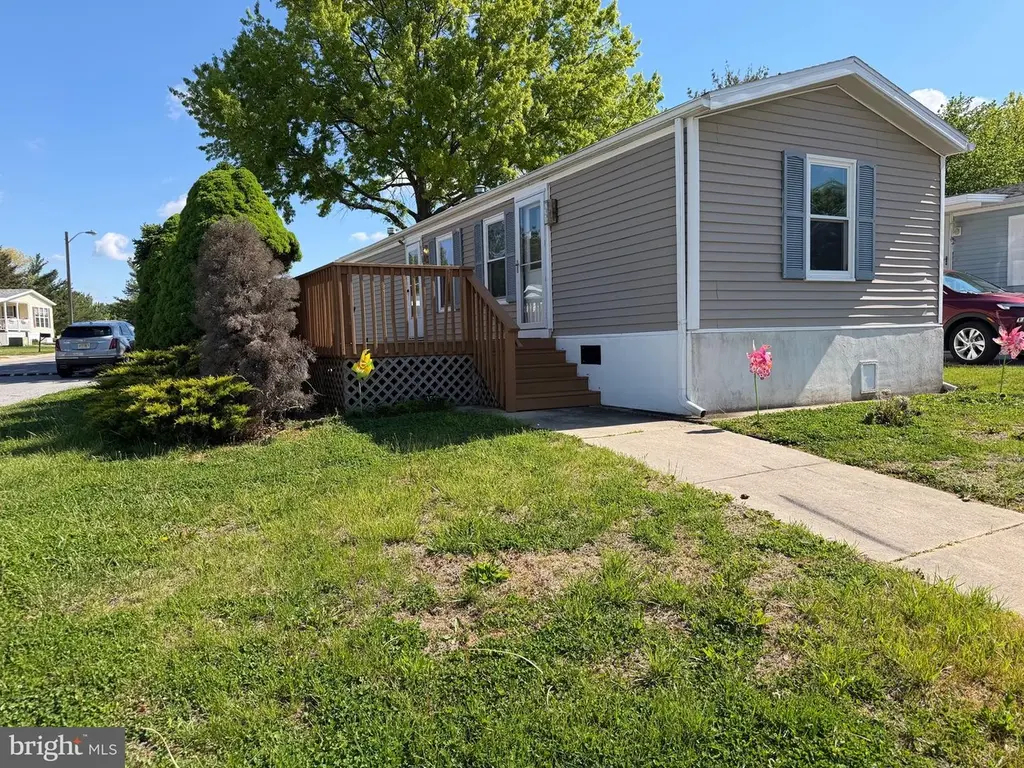
156 Mockingbird Ln · Sewell, NJ
Flood risk No data
- FEMA flood zone
- —
- Chance of flooding over 30 yrs
- —
- Est. flood insurance / yr
- —
Fire risk No data
- Est. fire insurance / yr
- —
Heat risk No data
- Hot days now (above threshold)
- —
- Hot days in 30 yrs
- —
Wind risk No data
- Chance of severe wind over 30 yrs
- —
Air-quality risk No data
- Unhealthy air days now
- —
- Unhealthy air days in 30 yrs
- —
Risk factors via First Street. Map © Google.
Why this score? — see what drove the C+ grade
The composite is a weighted blend of 9 inputs, each scored 0–100. Each bar is that input's sub-score; the figure is the points it added to the 100-point composite (weight × sub-score).
- Cash flow +23.7/30.0
- 1% rule +10.0/10.0
- DSCR +7.6/10.0
- ARV discount +6.2/15.0
- Condition / age +3.8/5.0
- Schools +3.7/10.0
- Rent growth +2.5/5.0
- Livability +2.5/5.0
- Appreciation +0.0/10.0
$74,900
🖨 Deal sheet (PDF) 📄 Offer letter ✓ Due diligence
Listing remarks
MANTUA MANUFACTURED HOME! This great manufactured home in Cedar Grove Park (55+ community) shows 2 BR/1 BA. This home has an open floor plan with cathedral ceilings, providing a spacious feel. Enter into a nice sized LR with a ceiling fan, providing year round comfort for you. Notice a pretty chair rail accent on the LR wall. Cable hook-up is available in your LR. Your adjacent KIT shows NEW machine hardwood flooring, with a gas stove, dual corner sink and the functional breakfast bar for meals on the go! The Laundry facility is just off of your KIT. Your full BA boasts a convenient walk-in shower and NEW machine hardwood flooring; storage available in the cabinet sink. Two nice sized BRs w
Key facts
- Parking
- Built 1992
- Listed 42 days
Property features AI
Finance
- Other: Property manager present
- Financial info: Land lease has 99 years remaining
- HOA & community: Monthly land lease / HOA fee: $750
Exterior
- Parking: Concrete driveway with parking for 1 vehicle
- Utilities: Public water; Public sewer
- Home design: Manufactured single-wide home; Pitched shingle roof; Entry level on main floor; Located in a 55+ senior community (senior age requirement: 55); Land lease community
- Construction: Vinyl siding; Block foundation; Single-wide manufactured construction
- Exterior features: Corner lot; Cleared lot; Front yard; Shed; Above-grade structure
Interior
- Kitchen: Eat-in kitchen; Gas range/oven; Refrigerator; Exhaust fan
- Bedrooms: Two bedrooms on the main level
- Flooring: Engineered wood
- Bathrooms: One full bathroom (main level)
- Heating & cooling: Forced air heating (natural gas); Central air conditioning; Ceiling fan(s); Electric hot water
- Interior features: Traditional floor plan; Chair railings; Stall shower; Ceiling fan(s); Entry-level bedroom
- Laundry & utility: Washer in unit (main floor)
Neighborhood map
What this means for you Summary
Snapshot
- This is a 2-bed/1.0-bath single-family listed at $75k. Condition is rated good.
Deal economics
- At list price, monthly cash flow is $143 ($2k/yr) — positive.
- The deal already cash-flows at list — no discount required.
- Meets the 1% rule at list price ($2k rent vs $75k).
- Recommended offer: $73k (3.0% below list) — sets the bar for market timing.
- Cap rate 8.6% vs local median 4.3% in Sewell — top-decile yield for the area; either an underpriced asset or a hidden risk that comps aren't pricing in. Stress-test before assuming the spread holds.
Location & tenants
- Location reads: area grade C — affects rentability + tenant quality, not the cash-flow math above.
- Mantua Township School District (suburban): math 27% / reading 53% proficiency, ranked #210 of 472 in NJ (top 44%) — families likely to look elsewhere, expect single-tenant / working-renter base with shorter leases; only 12% free/reduced lunch — higher-income household profile.
- Market conditions: 64 active listings in the ZIP; solid renter incomes; 1,047 units permitted in Gloucester County in 2024 (183 in 5+ unit buildings).
Forward outlook
- Local home prices are declining (-3.0%/yr); year-one equity from $518 of loan paydown is wiped out by about $2k of value loss. Plan a longer hold.
- Gloucester County population projected to shrink 5% by 2050 — rents likely to lag national; underwrite the cash flow, not the appreciation.
Negotiation context
- It's been on market 43 days — a 3% lower offer ($73k) is reasonable based on typical stale-listing flexibility.
Risks & watch-outs
- Watch-outs: HOA is 42% of rent.
Questions for the listing agent
- It's been on market 43 days. Have you received any prior offers? Is the seller open to a 3% concession, seller financing, or rate buy-down credit?
- What does the HOA fee cover, when was the last increase, and are there any pending special assessments or reserve-fund shortfalls?
- Is there a deadline driving the sale (1031 exchange, divorce, estate, relocation)? That informs how much negotiation room exists.
- What's the average days-on-market for RENTAL listings here right now (not sales)? A rising rental-DOM trend means longer vacancies and softer asking-rent achievability than the comps imply.
- What's the recent tenant-quality profile in this submarket — average credit score on applications, eviction rate, late-payment / NSF rate, and stable-employment percentage? A property-management company in the area should have these aggregated.
- How much new for-sale + rental construction is in the pipeline within 1–3 miles? Heavy new supply typically softens prices + rents 12–24 months out; constrained supply supports both.
Investment metrics
- 1% rule
- 2.38% ✓
- Cap rate
- 8.58%
- Cash-on-cash
- 8.18%
- DSCR
- 1.36
- GRM
- 3.5
CMA / ARV
- ARV (on-the-fly)
- $72,800
- Comps found
- 1
Show comp detail 1 sale within ~0.75 mi
| Address | Dist | Beds/Ba | Sqft | Sold | Price | $/sf | Match |
|---|---|---|---|---|---|---|---|
| 465 Berkley Rd | 0.37mi | 1/1.0 (-1) | 672 (+3%) | 6mo | $75,000 | $112 | 67 |
Match score weights: distance 35% · size 25% · config 20% · recency 20%. Top-matched comps best support the ARV.
Projected returns pro-forma
-3.0% appreciation · 3.0% rent growth · sell at horizon
- IRR
- -3.2%
- Equity multiple
- 0.88×
- Total profit
- $-2,538
- Equity at exit
- $11,168
- IRR
- 7.1%
- Equity multiple
- 1.55×
- Total profit
- $11,503
- Equity at exit
- $6,476
Cash invested: $20,972 (down + closing). Projections, not guarantees.
Landlord ↔ Tenant lean methodology
- Overall (STATE)
- 21 Tenant-Leaning
- State New Jersey
- 21 Tenant-Leaning · D+6
- County
- — inherits STATE
- City
- — inherits STATE
ZIP-level market 08051
- Home prices YoY
- -23.3%
- Active inventory
- 64
- Price-to-rent
- 3.5×
Monthly cashflow live
- Estimated rent
- $1,786 medium interval (Pro) →
- Mortgage (P&I)
- −$393
- Tax est. 1.5%
- −$94 /mo · $1,124/yr
- Insurance
- −$31
- HOA
- −$750
- Vacancy / Maint / Mgmt
- −$375
- Net cashflow
- $143
Break-even live
Sensitivity live
| Price | -10% $195 | -5% $169 | +0% $143 | +5% $117 | +10% $91 |
|---|---|---|---|---|---|
| Rent | -10% $2 | -5% $73 | +0% $143 | +5% $214 | +10% $284 |
| Rate | -1.0pp $181 | -0.5pp $162 | base $143 | +0.5pp $124 | +1.0pp $104 |
UW: 25.0% down · 7.5% · 30yr · 1.5% tax · 5.0% vac · 8.0% maint · 8.0% mgmt
Financing live
Cash to close
- Down payment
- $18,725
- Closing costs
- $2,247
- Reserves months
- —
- Total cash needed
- —
Loan-product check · same deal, 3 products live
Conventional
25% down · 7.5% · 30yr
- Down + closing
- —
- Monthly P&I
- —
- Monthly cashflow
- —
- DSCR
- —
- Eligible?
- —
Personal DTI + credit; lowest rate.
DSCR
20% down · 8.5% · 30yr
- Down + closing
- —
- Monthly P&I
- —
- Monthly cashflow
- —
- DSCR
- —
- Eligible?
- —
No personal income docs; deal must DSCR.
Hard money
10% down · 12.0% · 12mo
- Down + closing
- —
- Monthly P&I
- —
- Monthly cashflow
- —
- DSCR
- —
- Eligible?
- —
Short-term bridge; refi at stabilization.
HOA detail
- Monthly dues
- $750 · $9,000/yr
- Likely covers
- gascable
Listing history 17 events
-
2026-06-21days on market $74,900 Active 43 DOM
-
2026-06-18days on market $74,900 Active 40 DOM
-
2026-06-17days on market $74,900 Active 39 DOM
-
2026-06-16days on market $74,900 Active 38 DOM
-
2026-06-15days on market $74,900 Active 37 DOM
-
2026-06-13days on market $74,900 Active 35 DOM
-
2026-06-13days on market $74,900 Active 34 DOM
-
2026-06-09days on market $74,900 Active 31 DOM
-
2026-06-08days on market $74,900 Active 30 DOM
-
2026-06-07days on market $74,900 Active 29 DOM
-
2026-06-04days on market $74,900 Active 26 DOM
-
2026-06-03days on market $74,900 Active 25 DOM
-
2026-06-02days on market $74,900 Active 24 DOM
-
2026-06-01days on market $74,900 Active 23 DOM
-
2026-05-31days on market $74,900 Active 22 DOM
-
2026-05-10$74,900 Active
-
2026-05-03historical $74,900
ⓘ Source: listings_history table (triggers on properties + properties_extension) + one-shot
backfill from property_details.listing_events for pre-trigger history.
Nearby sold comps map
Loading sold comps map…
Walkable amenities ~0.75 mi
Loading nearby amenities…
Taxation est. · year 1
- Rental income
- $21,428
- − Mortgage interest
- −$4,196
- − Property taxes
- −$1,124
- − Insurance
- −$374
- − Repairs & maintenance
- −$1,714
- − Management
- −$1,714
- − HOA
- −$9,000
- − Depreciation
- −$2,179
- Taxable income
- $1,127
- Est. tax owed @ 24.0%
- −$270
- After-tax cash flow
- $1,446/yr
For passive investors: Depreciation is non-cash, so a rental often shows a tax loss while cash-flowing — sheltering income. Rental losses are passive: they offset passive income freely, and up to $25,000/yr can offset ordinary (W-2) income if you actively participate and your MAGI is under $100k (phasing out to $0 by $150k); unused losses carry forward. On sale, claimed depreciation is recaptured at up to 25%, and gains may owe capital-gains tax (a 1031 exchange can defer both). Figures are a year-1 estimate at your 24.0% rate — not tax advice; consult a CPA.
Condition & rehab AI · 12 photos
This well-maintained manufactured home in a 55+ community offers a good condition with minor cosmetic updates to enhance its resale and rental value.
Value-add opportunities
- Both Painting interior walls and ceiling — Fresh paint enhances curb appeal and interior aesthetics
- Both Upgrading kitchen appliances — Modern appliances improve functionality and appeal
- Both Landscaping improvements — Enhances curb appeal and adds value
- Both New flooring in living room — Fresh flooring improves aesthetics and functionality
Renovation cost estimate screening
Value-add ROI direction
- Both Painting interior walls and ceiling — Fresh paint enhances curb appeal and interior aesthetics ↑
- Both Upgrading kitchen appliances — Modern appliances improve functionality and appeal ↑
- Both Landscaping improvements — Enhances curb appeal and adds value ↑
- Both New flooring in living room — Fresh flooring improves aesthetics and functionality ↑
ⓘ Cost ranges are severity-bucket heuristics (US national rule-of-thumb). Get contractor quotes + a written scope before underwriting a rehab budget.
Schools (NCES district)
- District
- Mantua Township School District
- NCES district ID
- 3409600
- Math proficiency
- 27% ▼ -26.00%
- Reading proficiency
- 53% ▼ -18.00%
- Median HH income
- $81,565
- Composite
- 37.41/100
- National rank
- #4422
- State rank
- #210 of 472 in NJ
Livability — Sewell
No livability data for this city. (Only ~50 U.S. cities are tracked.)
Census & demographics
- County
- Gloucester County · 160,422 people
- City population
- 38,159
- Metro
- Philadelphia-Camden-Wilmington, PA-NJ-DE-MD
- Population (ZIP)
- 12,474
- Household income
- $92,071
- Rent vs Own
- Severe rent burden
- 155.0
Population outlook (Gloucester County) Hauer SSP2
- Today (2025)
- 298,895 people
- By 2030
- 299,031 · +0.0%
- By 2040
- 294,020 · -1.6%
- By 2050
- 284,188 · -4.9%
- By 2075
- 260,720 · -12.8%
- By 2100
- 229,565 · -23.2%
Race, ethnicity, and origin ACS 2023
- Neighborhood character
- Predominantly White (85%)
- Race & ethnicity
- White 85% Black 6% Hispanic / Latino 4% Two or more races 3% Asian 2%
- Common ancestry
- Romanian 6% Slovak 3% Lithuanian 1%
- Foreign-born
- 4% · Canada
- Languages at home
- 92% English-only · Spanish 3% Tagalog/Filipino 2% Other Indo-European 1%
Political lean MEDSL · Gloucester
- 2024 margin
- Toss-up / Even · D 47.8% · R 50.6% · Other 1.6%
- 2008→2024 swing
- -15.0pp toward R · 2008: 12.2pp · 2024: -2.8pp
- All cycles
- 2024: R+2.8 2020: D+1.9 2016: R+0.4 2012: D+10.5 2008: D+12.2
Not yet ingested
- Civics
- —
Market trends
- HPI YoY
- ▼ -90.45%
- Current HPI
- 297.7611
- Rent YoY
- —
- Metro
- Philadelphia-Camden-Wilmington, PA-NJ-DE-MD
- State GDP YoY
- ▲ 2.05%
- F500 in state
- 34
Industry mix (Fortune 500 HQ in NJ)
| Industry | F500 HQs | Revenue |
|---|---|---|
| Consumer Goods | 3 | $31B |
|
||
| Pharmaceuticals | 2 | $153B |
|
||
| Technology | 2 | $21B |
|
||
| Insurance | 2 | $20B |
|
||
| Healthcare | 2 | $19B |
|
||
| Financial Services | 1 | $70B |
|
||
Price history
+0.0% since first listed2 events — show timeline
- 2026-05-10 Listed $74,900 BRIGHT MLS
- 2026-05-03 Coming Soon $74,900 BRIGHT MLS
Cash-flow waterfall
monthlySold comps — $/sqft
last 12 mo · ≤1 miLoading sold comps…