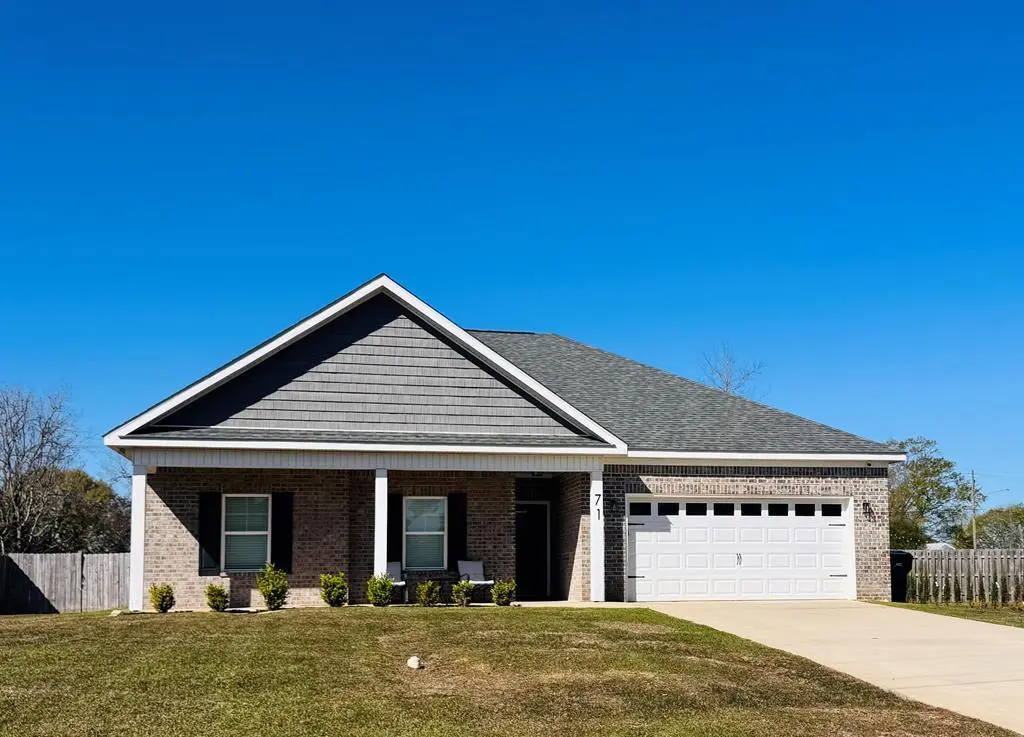
71 June Dr · Midland City, AL
Flood risk 1/10 · Minimal
- FEMA flood zone
- X (unshaded)
- Chance of flooding over 30 yrs
- 0.0%
- Est. flood insurance / yr
- $507 – $1,088
Fire risk 3/10 · Minor
- Est. fire insurance / yr
- $916 – $1,700
Heat risk 8/10 · Major
- Hot days now (above 106°F)
- 7 days/yr
- Hot days in 30 yrs
- 21 days/yr
Wind risk 8/10 · Major
- Chance of severe wind over 30 yrs
- 99.0%
Air-quality risk 2/10 · Minimal
- Unhealthy air days now
- 0 days/yr
- Unhealthy air days in 30 yrs
- 1 days/yr
Risk factors via First Street. Map © Google.
Why this score? — see what drove the D+ grade
The composite is a weighted blend of 9 inputs, each scored 0–100. Each bar is that input's sub-score; the figure is the points it added to the 100-point composite (weight × sub-score).
- Cash flow +17.0/30.0
- Appreciation +10.0/10.0
- DSCR +5.3/10.0
- 1% rule +3.4/10.0
- Schools +3.4/10.0
- Livability +3.2/5.0
- Rent growth +2.5/5.0
- Condition / age +2.5/5.0
- ARV discount +0.4/15.0
$299,000
🖨 Deal sheet 📄 Offer letter ✓ Due diligence
Listing remarks
Newer 4-bedroom home, no HOA, privacy fence, 2-car garage, and possible USDA 100% financing just minutes from Dothan, Alabama. Welcome to 71 June Drive in Midland City! This newer 2022-built, one-level home offers the space, finishes, and location buyers are looking for. Featuring 4 bedrooms, 2 bathrooms, approximately 1,897 sq. ft. , and a 2-car attached garage, this home has a comfortable great floor plan designed for everyday living. Inside, you will love the open-concept layout, tray ceilings, recessed lighting, and luxury vinyl plank flooring through the main living areas. The kitchen is the heart of the home with quartz countertops, a large island, stainless-steel appliances, pantry s
Key facts
- Quartz countertops
- Privacy fence
- Large island
Tags
Property features AI
Exterior
- Parking: 2 total parking spaces; 2 covered parking spaces; 2-car garage
- Utilities: Public water; Public sewer
- Home design: Single family residence; One level
- Construction: Brick construction
- Exterior features: Covered patio/porch; Lot approximately 0.36 acres; Lot dimensions about 82.8' x 194'
Interior
- Kitchen: Dishwasher; Oven; Range; Range hood; Refrigerator
- Bedrooms: Bedrooms located on main level
- Flooring: Carpet; Tile; Vinyl
- Bathrooms: 2 full bathrooms
- Interior features: Ceiling fans; Entrance foyer; Double pane windows
- Laundry & utility: Inside laundry
Neighborhood map
What this means for you Summary
Snapshot
- This is a 4-bed/2.0-bath single-family listed at $299k.
Deal economics
- At list price, monthly cash flow is $200 ($2k/yr) — positive.
- The deal already cash-flows at list — no discount required.
- To meet the 1% rule (rent ≥ 1% of price), the offer needs to be $250k (16.4% below list).
- Recommended offer: $250k (16.4% below list) — sets the bar for 1% rule.
Location & tenants
- Location reads 65/100 on livability (#143 in AL) — a middle-class / working-renter tenant base. Strengths: crime A+, cost of living A+, health & safety A+; Watch: amenities F, commute F, employment F.
- Dale County (rural): math 31% / reading 50% proficiency, ranked #26 of 129 in AL (top 20%) — families likely to look elsewhere, expect single-tenant / working-renter base with shorter leases.
- Zoned schools: Midland City Elementary School (math 22% / reading 47%, grade F, #296 of 627 statewide, top 49%, 453 students, 79% FRL); South Dale Middle School (math 18% / reading 44%, grade F, #118 of 257 statewide, top 46%, 426 students, 78% FRL); Dale County High School (math 12% / reading 22%, grade F, #195 of 305 statewide, top 68%, 417 students, 73% FRL) — zoned schools average 77% FRL vs 52% district-wide (25 pts higher); higher-poverty schools than district average — tighter screening recommended.
- Zoned-school proficiency averages 28% at this address vs 40% district-wide (-13 pts) — the specific schools serving this property underperform the Dale County average; the district grade overstates school quality for this exact location.
- Market conditions: 75 active listings in the ZIP; 1 comparable units currently listed for rent nearby; 38 units permitted in Dale County in 2024 (0 in 5+ unit buildings).
Forward outlook
- In year one you build about $32k of equity ($2k loan paydown + $30k appreciation (10.0% local appreciation)).
- Dale County population projected at -20% by 2050 — secular population decline; favor cash flow + early exit over multi-decade hold.
- At projected returns (10.0% appreciation + 3.0% rent growth), your $84k cash investment doubles in ~3 years — after that, you're playing with house money.
- By year 2, paydown + projected appreciation supports a ~$51k cash-out refi (75% LTV) — recoverable capital for the next deal without selling this one.
Negotiation context
- Only 14 days on market — expect competitive offers; lowballing is unlikely to land.
- 6 sale attempts since 4y ago with the ask held roughly flat each time — persistent listings suggest the price (not the market) is what's stuck; bring a comps-based counter.
- Current owner paid $252k; 19% above their basis — modest negotiation headroom, anchor on the comps not their cost.
Risks & watch-outs
- Climate carrying-cost: severe wind risk, 99% chance of damaging wind over 30y; extreme-heat days projected 7→21/yr by 2055 (HVAC capex compounding) — expect insurance premiums to compound above CPI over the hold.
Questions for the listing agent
- Is there a deadline driving the sale (1031 exchange, divorce, estate, relocation)? That informs how much negotiation room exists.
- Schools are D-rated, which usually means shorter tenancies and higher turnover. Who's the typical renter profile here, and what's been the actual vacancy rate?
- The area grade is low — what's the realistic commute time and amenity access for the typical tenant pool here? Any planned neighborhood developments (good or bad) we should know about?
- What's the average days-on-market for RENTAL listings here right now (not sales)? A rising rental-DOM trend means longer vacancies and softer asking-rent achievability than the comps imply.
- What's the recent tenant-quality profile in this submarket — average credit score on applications, eviction rate, late-payment / NSF rate, and stable-employment percentage? A property-management company in the area should have these aggregated.
- How much new for-sale + rental construction is in the pipeline within 1–3 miles? Heavy new supply typically softens prices + rents 12–24 months out; constrained supply supports both.
Investment metrics
- 1% rule
- 0.84% ✗
- Cap rate
- 7.10%
- Cash-on-cash
- 2.86%
- DSCR
- 1.13
- GRM
- 10.0
CMA / ARV
- ARV (median comp)
- $258,265
- List price
- $299,000
- Delta
- 18.06%
- Verdict
- OVERPRICED
- Comps
- 20 within 1.0 mi
Show comp detail 4 sales within ~0.75 mi
| Address | Dist | Beds/Ba | Sqft | Sold | Price | $/sf | Match |
|---|---|---|---|---|---|---|---|
| 88 June Dr | 0.04mi | 4/2.0 | 1,929 (+2%) | 0mo | $305,000 | $158 | 95 |
| 168 June Dr | 0.10mi | 3/2.0 (-1) | 1,640 (-14%) | 19mo | $259,900 | $158 | 52 |
| 221 Rosa Ln | 0.14mi | 3/2.0 (-1) | 1,636 (-14%) | 22mo | $279,500 | $171 | 47 |
| 55 4th St | 0.68mi | 3/2.0 (-1) | 1,940 (+2%) | 21mo | $225,000 | $116 | 42 |
Match score weights: distance 35% · size 25% · config 20% · recency 20%. Top-matched comps best support the ARV.
Projected returns pro-forma
10.0% appreciation · 3.0% rent growth · sell at horizon
- IRR
- 26.3%
- Equity multiple
- 3.10×
- Total profit
- $175,432
- Equity at exit
- $269,363
- IRR
- 23.1%
- Equity multiple
- 7.05×
- Total profit
- $506,328
- Equity at exit
- $580,891
Cash invested: $83,720 (down + closing). Projections, not guarantees.
Landlord ↔ Tenant lean methodology
- Overall (STATE)
- 90 Strongly Landlord-Friendly
- State Alabama
- 90 Strongly Landlord-Friendly · R+15
- County
- — inherits STATE
- City
- — inherits STATE
ZIP-level market 36350
- Home prices YoY
- 8.0%
- Active inventory
- 75
- Price-to-rent
- 10.0×
Monthly cashflow live
- Estimated rent
- $2,500 medium interval (Pro) →
- Mortgage (P&I)
- −$1,568
- Tax from tax record
- −$83 /mo · $991/yr
- Insurance
- −$125
- HOA
- −$0
- Vacancy / Maint / Mgmt
- −$525
- Net cashflow
- $200
Break-even live
UW: 25.0% down · 7.5% · 30yr · 1.5% tax · 5.0% vac · 8.0% maint · 8.0% mgmt
Financing live
Cash to close
- Down payment
- $74,750
- Closing costs
- $8,970
- Reserves months
- —
- Total cash needed
- —
Loan-product check · same deal, 3 products live
Conventional
25% down · 7.5% · 30yr
- Down + closing
- —
- Monthly P&I
- —
- Monthly cashflow
- —
- DSCR
- —
- Eligible?
- —
Personal DTI + credit; lowest rate.
DSCR
20% down · 8.5% · 30yr
- Down + closing
- —
- Monthly P&I
- —
- Monthly cashflow
- —
- DSCR
- —
- Eligible?
- —
No personal income docs; deal must DSCR.
Hard money
10% down · 12.0% · 12mo
- Down + closing
- —
- Monthly P&I
- —
- Monthly cashflow
- —
- DSCR
- —
- Eligible?
- —
Short-term bridge; refi at stabilization.
Rent comps 1 comps
| Address | Beds | Baths | Sqft | Rent | $/sqft | DOM | Units | Dist |
|---|---|---|---|---|---|---|---|---|
| 312 Joe Walding Dr Midland City, AL | 3.0 | 2.0 | 1238 | $2,500 | $2.02 | 43d | 1 | 0.64mi |
Listing history 21 events
-
2026-06-19days on market $299,000 Active 14 DOM
-
2026-06-18days on market $299,000 Active 13 DOM
-
2026-06-17days on market $299,000 Active 12 DOM
-
2026-06-16days on market $299,000 Active 11 DOM
-
2026-06-15days on market $299,000 Active 10 DOM
-
2026-06-14days on market $299,000 Active 8 DOM
-
2026-06-12days on market $299,000 Active 7 DOM
-
2026-06-09days on market $299,000 Active 4 DOM
-
2026-06-08days on market $299,000 Active 3 DOM
-
2026-06-07pricedays on market $299,000 Active 2 DOM
-
2026-06-02days on market $304,900 Active 56 DOM
-
2026-06-01days on market $304,900 Active 55 DOM
-
2026-05-31days on market $304,900 Active 54 DOM
-
2026-05-30days on market $304,900 Active 53 DOM
-
2026-04-09price $304,900
-
2026-04-07$304,900 Active 1443-char remark
-
2026-04-03$304,900 Active
-
2026-03-19$309,990 Active
-
2026-03-19$30,990 Active
-
2022-11-29soldstatus $251,900 Closed
-
2022-05-31$251,900
ⓘ Source: listings_history table (triggers on properties + properties_extension) + one-shot
backfill from property_details.listing_events for pre-trigger history.
Tax reassessment forecast AL · Resets to sale price
- Current annual tax
- $991 · $83/mo
- Projected year-2 tax
- $1,226 · $102/mo
- Expected delta
- +$235/yr (+$20/mo · 23.8%)
ⓘ Screening estimate from a state-policy table — verify with the county assessor before closing.
Climate risk First Street
- Flood 1/10 Low FEMA zone X (unshaded) · 0% chance over 30 yrs
- Wildfire 3/10 Moderate
- Heat 8/10 Severe 7 d/yr ≥106°F today · 21 d/yr by 30 yrs out
- Wind 8/10 Severe 99% chance of damaging wind over 30 yrs
- Air quality 2/10 Low 0 unhealthy d/yr today · 1 by 30 yrs out
Nearby sold comps map
Loading sold comps map…
Walkable amenities ~0.75 mi
Loading nearby amenities…
Taxation est. · year 1
- Rental income
- $30,000
- − Mortgage interest
- −$16,749
- − Property taxes
- −$991
- − Insurance
- −$1,495
- − Repairs & maintenance
- −$2,400
- − Management
- −$2,400
- − Depreciation
- −$8,698
- Taxable loss
- −$2,732
- Est. tax savings @ 24.0%
- +$656
- After-tax cash flow
- $3,054/yr
For passive investors: Depreciation is non-cash, so a rental often shows a tax loss while cash-flowing — sheltering income. Rental losses are passive: they offset passive income freely, and up to $25,000/yr can offset ordinary (W-2) income if you actively participate and your MAGI is under $100k (phasing out to $0 by $150k); unused losses carry forward. On sale, claimed depreciation is recaptured at up to 25%, and gains may owe capital-gains tax (a 1031 exchange can defer both). Figures are a year-1 estimate at your 24.0% rate — not tax advice; consult a CPA.
Schools (NCES district)
- District
- Dale County
- NCES district ID
- 0101050
- Math proficiency
- 31% ▼ -29.00%
- Reading proficiency
- 50% ▼ -3.00%
- Median HH income
- $42,949
- Composite
- 34.16/100
- National rank
- #5277
- State rank
- #26 of 129 in AL
Livability — Midland City
- Score
- 65/100
- State rank
- #143
- US rank
- #13549
Category grades
Schools grade is shown separately in the Schools card above.
Census & demographics
- Census place
- Midland City, AL
- Population (ZIP)
- 7,675
Population outlook (Dale County) Hauer SSP2
- Today (2025)
- 46,805 people
- By 2030
- 45,176 · -3.5%
- By 2040
- 41,523 · -11.3%
- By 2050
- 37,575 · -19.7%
- By 2075
- 28,931 · -38.2%
- By 2100
- 22,172 · -52.6%
Race, ethnicity, and origin ACS 2023
- Neighborhood character
- Predominantly White (69%)
- Race & ethnicity
- White 69% Black 23% Hispanic / Latino 5% Two or more races 3%
- Common ancestry
- Italian 2% Slovak 2% Romanian 1%
- Foreign-born
- 2% · Canada
- Languages at home
- 96% English-only · Spanish 4%
Political lean MEDSL · Dale
- 2024 margin
- Solid R (+52.3) · D 23.5% · R 75.8%
- 2008→2024 swing
- -7.7pp toward R · 2008: -44.6pp · 2024: -52.3pp
- All cycles
- 2024: R+52.3 2020: R+46.3 2016: R+50.4 2012: R+42.2 2008: R+44.6
Not yet ingested
- Civics
- —
Market trends
- HPI YoY
- ▲ 16.34%
- Current HPI
- 219.7326
- Rent YoY
- —
- Metro
- —
- State GDP YoY
- ▲ 2.94%
- F500 in state
- 4
Industry mix (Fortune 500 HQ in AL)
| Industry | F500 HQs | Revenue |
|---|---|---|
| Financial Services | 1 | $8B |
|
||
| Healthcare | 1 | $5B |
|
||
Price history
+18.7% since first listed8 events — show timeline
- 2026-06-06 Listed $299,000 SAMLS
- 2026-04-09 Price Changed $304,900 SAMLS
- 2026-04-07 Listed $304,900 SAMLS
- 2026-04-03 Listed $304,900 WBR
- 2026-03-19 Listed $30,990 SAMLS
- 2026-03-19 Listed $309,990 SAMLS
- 2022-11-29 Sold (MLS) $251,900 SAMLS
- 2022-05-31 Listed $251,900 SAMLS
Property tax history
+61.7%/yrLatest (2025): $991 · +6.2% YoY. Source: county tax records.
Cash-flow waterfall
monthlySold comps — $/sqft
last 12 mo · ≤1 miLoading sold comps…