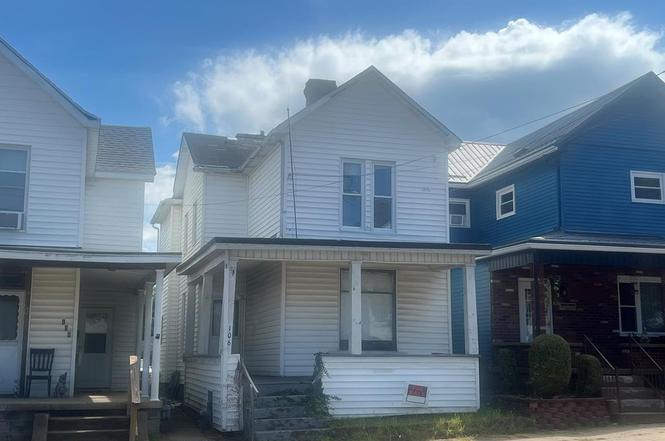
106 Jefferson Ave · Moundsville, WV
Flood risk 4/10 · Minor
- FEMA flood zone
- X (unshaded)
- Chance of flooding over 30 yrs
- 0.23%
- Est. flood insurance / yr
- $473 – $860
Fire risk 1/10 · Minimal
- Est. fire insurance / yr
- $787 – $1,461
Heat risk 4/10 · Minor
- Hot days now (above 99°F)
- 7 days/yr
- Hot days in 30 yrs
- 20 days/yr
Wind risk 1/10 · Minimal
- Chance of severe wind over 30 yrs
- —
Air-quality risk 2/10 · Minimal
- Unhealthy air days now
- 1 days/yr
- Unhealthy air days in 30 yrs
- 3 days/yr
Risk factors via First Street. Map © Google.
Why this score? — see what drove the B- grade
The composite is a weighted blend of 9 inputs, each scored 0–100. Each bar is that input's sub-score; the figure is the points it added to the 100-point composite (weight × sub-score).
- Cash flow +30.0/30.0
- 1% rule +10.0/10.0
- DSCR +10.0/10.0
- ARV discount +7.5/15.0
- Livability +3.3/5.0
- Schools +2.7/10.0
- Rent growth +2.5/5.0
- Condition / age +2.5/5.0
- Appreciation +0.0/10.0
$54,995
🖨 Deal sheet 📄 Offer letter ✓ Due diligence
Listing remarks
Investor Alert! Located on Jefferson Ave. , the Main Street of Moundsville, this early 1900s home is within walking distance to shops and businesses. Featuring 3 bedrooms (one captured) and a flexible layout, there's potential to create a first-floor master suite. A great opportunity for investors to restore and add value in a prime location. Selling as-is
Key facts
- Prime location
- 2,614 sq ft lot
- Built 1900
Tags
Property features AI
Exterior
- Parking: Gravel parking
- Utilities: Public water; Public sewer
- Home design: Single family residence (traditional); 2 stories
- Construction: Vinyl siding; Shingle roof
- Exterior features: Patio; Porch; Gravel parking
Interior
- Kitchen: Range; Refrigerator; Electric water heater
- Bedrooms: 5 total rooms (includes bedrooms and living spaces)
- Bathrooms: 1 full bathroom; 1 half bathroom
- Heating & cooling: Natural gas heating
- Interior features: Two fireplaces; Full basement
- Laundry & utility: Washer; Dryer
Neighborhood map
What this means for you Summary
Snapshot
- This is a 3-bed/1.0-bath single-family listed at $55k.
Deal economics
- At list price, monthly cash flow is $419 ($5k/yr) — positive.
- The deal already cash-flows at list — no discount required.
- Meets the 1% rule at list price ($997 rent vs $55k).
- Recommended offer: $48k (12.0% below list) — sets the bar for market timing.
- Cap rate 15.4% vs local median 4.7% in Moundsville — top-decile yield for the area; either an underpriced asset or a hidden risk that comps aren't pricing in. Stress-test before assuming the spread holds.
Location & tenants
- Location reads 66/100 on livability (#105 in WV) — a middle-class / working-renter tenant base. Strengths: cost of living A+, housing A-, health & safety A-; Watch: schools D+, amenities F, commute F.
- Marshall County Schools (suburban): math 28% / reading 36% proficiency, ranked #21 of 55 in WV (top 38%) — families likely to look elsewhere, expect single-tenant / working-renter base with shorter leases.
- Market conditions: 78 active listings in the ZIP; 6 units permitted in Marshall County in 2024 (0 in 5+ unit buildings).
Forward outlook
- Local home prices are declining (-3.0%/yr); year-one equity from $380 of loan paydown is wiped out by about $2k of value loss. Plan a longer hold.
- Marshall County population projected at -19% by 2050 — secular population decline; favor cash flow + early exit over multi-decade hold.
- At projected returns (-3.0% appreciation + 3.0% rent growth), your $15k cash investment doubles in ~4 years — after that, you're playing with house money.
Negotiation context
- It's been on market 257 days — a 12% lower offer ($48k) is reasonable based on typical stale-listing flexibility.
- 2 sale attempts; this cycle's ask has dropped $10k (15%) from the opening price — seller is motivated, your offer sets the floor, not the list.
Risks & watch-outs
- Watch-outs: built in 1900 — expect roof / HVAC / electrical / plumbing capex.
Questions for the listing agent
- It's been on market 257 days. Have you received any prior offers? Is the seller open to a 12% concession, seller financing, or rate buy-down credit?
- Built in 1900 — when were the roof, HVAC, electrical panel, plumbing, and water heater last replaced?
- Why hasn't it sold? Are there any deal-killer items the seller is aware of (foundation, flood, title, zoning, code violations)?
- Is there a deadline driving the sale (1031 exchange, divorce, estate, relocation)? That informs how much negotiation room exists.
- Schools are D-rated, which usually means shorter tenancies and higher turnover. Who's the typical renter profile here, and what's been the actual vacancy rate?
- What's the average days-on-market for RENTAL listings here right now (not sales)? A rising rental-DOM trend means longer vacancies and softer asking-rent achievability than the comps imply.
- What's the recent tenant-quality profile in this submarket — average credit score on applications, eviction rate, late-payment / NSF rate, and stable-employment percentage? A property-management company in the area should have these aggregated.
- How much new for-sale + rental construction is in the pipeline within 1–3 miles? Heavy new supply typically softens prices + rents 12–24 months out; constrained supply supports both.
Investment metrics
- 1% rule
- 1.81% ✓
- Cap rate
- 15.43%
- Cash-on-cash
- 32.63%
- DSCR
- 2.45
- GRM
- 4.6
CMA / ARV
- ARV (on-the-fly)
- $131,320
- Comps found
- 12
Show comp detail 12 sales within ~0.75 mi
| Address | Dist | Beds/Ba | Sqft | Sold | Price | $/sf | Match |
|---|---|---|---|---|---|---|---|
| 117 Ash Ave | 0.30mi | 3/1.5 | 1,392 (+4%) | 3mo | $106,000 | $76 | 75 |
| 524 9th St | 0.55mi | 3/1.0 | 1,374 (+2%) | 3mo | $41,500 | $30 | 67 |
| 1502 8th St | 0.60mi | 3/1.0 | 1,385 (+3%) | 2mo | $101,000 | $73 | 64 |
| 2018 Jackson St | 0.69mi | 3/1.0 | 1,296 (-3%) | 1mo | $193,000 | $149 | 62 |
| 105 Cypress Ave | 0.40mi | 3/1.5 | 1,496 (+12%) | 3mo | $165,000 | $110 | 58 |
| 18 Hickory Ave | 0.53mi | 2/2.0 (-1) | 1,300 (-3%) | 6mo | $145,000 | $112 | 56 |
| 54 Linden Ave | 0.59mi | 3/2.5 | 1,250 (-7%) | 0mo | $170,000 | $136 | 55 |
| 1404 9th St | 0.59mi | 2/1.5 (-1) | 1,260 (-6%) | 1mo | $128,500 | $102 | 55 |
| 1417 3rd St | 0.43mi | 2/1.5 (-1) | 1,512 (+13%) | 2mo | $125,000 | $83 | 50 |
| 1705 Virginia St | 0.49mi | 3/1.5 | 1,521 (+14%) | 3mo | $80,000 | $53 | 50 |
| 2104 First St | 0.66mi | 3/2.0 | 1,514 (+13%) | 3mo | $148,000 | $98 | 41 |
| 2009 Center St | 0.64mi | 2/1.0 (-1) | 1,172 (-12%) | 6mo | $99,000 | $84 | 40 |
Match score weights: distance 35% · size 25% · config 20% · recency 20%. Top-matched comps best support the ARV.
Projected returns pro-forma
-3.0% appreciation · 3.0% rent growth · sell at horizon
- IRR
- 27.7%
- Equity multiple
- 2.15×
- Total profit
- $17,765
- Equity at exit
- $8,200
- IRR
- 35.2%
- Equity multiple
- 4.24×
- Total profit
- $49,841
- Equity at exit
- $4,755
Cash invested: $15,399 (down + closing). Projections, not guarantees.
Landlord ↔ Tenant lean methodology
- Overall (STATE)
- 83 Strongly Landlord-Friendly
- State West Virginia
- 83 Strongly Landlord-Friendly · R+22
- County
- — inherits STATE
- City
- — inherits STATE
ZIP-level market 26041
- Home prices YoY
- -24.8%
- Active inventory
- 78
- Price-to-rent
- 4.6×
Monthly cashflow live
- Estimated rent
- $997 medium interval (Pro) →
- Mortgage (P&I)
- −$288
- Tax from tax record
- −$58 /mo · $691/yr
- Insurance
- −$23
- HOA
- −$0
- Vacancy / Maint / Mgmt
- −$209
- Net cashflow
- $419
Break-even live
UW: 25.0% down · 7.5% · 30yr · 1.5% tax · 5.0% vac · 8.0% maint · 8.0% mgmt
Financing live
Cash to close
- Down payment
- $13,749
- Closing costs
- $1,650
- Reserves months
- —
- Total cash needed
- —
Loan-product check · same deal, 3 products live
Conventional
25% down · 7.5% · 30yr
- Down + closing
- —
- Monthly P&I
- —
- Monthly cashflow
- —
- DSCR
- —
- Eligible?
- —
Personal DTI + credit; lowest rate.
DSCR
20% down · 8.5% · 30yr
- Down + closing
- —
- Monthly P&I
- —
- Monthly cashflow
- —
- DSCR
- —
- Eligible?
- —
No personal income docs; deal must DSCR.
Hard money
10% down · 12.0% · 12mo
- Down + closing
- —
- Monthly P&I
- —
- Monthly cashflow
- —
- DSCR
- —
- Eligible?
- —
Short-term bridge; refi at stabilization.
Listing history 21 events
-
2026-06-19days on market $54,995 Active 257 DOM
-
2026-06-18days on market $54,995 Active 256 DOM
-
2026-06-17days on market $54,995 Active 255 DOM
-
2026-06-16days on market $54,995 Active 254 DOM
-
2026-06-15days on market $54,995 Active 253 DOM
-
2026-06-14days on market $54,995 Active 251 DOM
-
2026-06-12days on market $54,995 Active 250 DOM
-
2026-06-09days on market $54,995 Active 247 DOM
-
2026-06-08days on market $54,995 Active 246 DOM
-
2026-06-07days on market $54,995 Active 245 DOM
-
2026-06-02days on market $54,995 Active 240 DOM
-
2026-06-01days on market $54,995 Active 239 DOM
-
2026-05-31days on market $54,995 Active 238 DOM
-
2026-05-30days on market $54,995 Active 237 DOM
-
2026-05-23price $54,995
-
2026-03-11status Active
-
2026-02-01historical
-
2026-01-05price $57,500
-
2025-10-30price $59,900
-
2025-10-16price $62,500
-
2025-08-28$65,000 Active
ⓘ Source: listings_history table (triggers on properties + properties_extension) + one-shot
backfill from property_details.listing_events for pre-trigger history.
Tax reassessment forecast WV · Resets to sale price
- Current annual tax
- $691 · $58/mo
- Projected year-2 tax
- $691 · $58/mo
- Expected delta
- $0/yr ($0/mo · 0.0%)
ⓘ Screening estimate from a state-policy table — verify with the county assessor before closing.
Climate risk First Street
- Flood 4/10 Moderate FEMA zone X (unshaded) · 23% chance over 30 yrs
- Wildfire 1/10 Low
- Heat 4/10 Moderate 7 d/yr ≥99°F today · 20 d/yr by 30 yrs out
- Wind 1/10 Low
- Air quality 2/10 Low 1 unhealthy d/yr today · 3 by 30 yrs out
Nearby sold comps map
Loading sold comps map…
Walkable amenities ~0.75 mi
Loading nearby amenities…
Taxation est. · year 1
- Rental income
- $11,964
- − Mortgage interest
- −$3,081
- − Property taxes
- −$691
- − Insurance
- −$275
- − Repairs & maintenance
- −$957
- − Management
- −$957
- − Depreciation
- −$1,600
- Taxable income
- $4,403
- Est. tax owed @ 24.0%
- −$1,057
- After-tax cash flow
- $3,968/yr
For passive investors: Depreciation is non-cash, so a rental often shows a tax loss while cash-flowing — sheltering income. Rental losses are passive: they offset passive income freely, and up to $25,000/yr can offset ordinary (W-2) income if you actively participate and your MAGI is under $100k (phasing out to $0 by $150k); unused losses carry forward. On sale, claimed depreciation is recaptured at up to 25%, and gains may owe capital-gains tax (a 1031 exchange can defer both). Figures are a year-1 estimate at your 24.0% rate — not tax advice; consult a CPA.
Schools (NCES district)
- District
- Marshall County Schools
- NCES district ID
- 5400750
- Math proficiency
- 28% ▼ -6.00%
- Reading proficiency
- 36% ▼ -4.00%
- Median HH income
- $40,289
- Composite
- 26.91/100
- National rank
- #7086
- State rank
- #21 of 55 in WV
Livability — Moundsville
- Score
- 66/100
- State rank
- #105
- US rank
- #11553
Category grades
Schools grade is shown separately in the Schools card above.
Census & demographics
- Census place
- Moundsville, WV
- County
- Marshall · 16,750 people
- Metro
- Wheeling, WV-OH
- Population (ZIP)
- 15,706
- Household income
- $55,545
- Rent vs Own
- Severe rent burden
- 7.4
Population outlook (Marshall County) Hauer SSP2
- Today (2025)
- 30,387 people
- By 2030
- 29,242 · -3.8%
- By 2040
- 26,806 · -11.8%
- By 2050
- 24,627 · -19.0%
- By 2075
- 19,846 · -34.7%
- By 2100
- 15,169 · -50.1%
Race, ethnicity, and origin ACS 2023
- Neighborhood character
- Predominantly White (94%)
- Race & ethnicity
- White 94% Two or more races 3% Hispanic / Latino 1%
- Common ancestry
- Romanian 4% Iranian 2% Italian 1%
- Foreign-born
- 1% · Canada
- Languages at home
- 98% English-only · Spanish 1% German/W. Germanic 1%
Political lean MEDSL · Marshall
- 2024 margin
- Solid R (+50.0) · D 24.1% · R 74.1% · Other 1.8%
- 2008→2024 swing
- -37.5pp toward R · 2008: -12.6pp · 2024: -50.0pp
- All cycles
- 2024: R+50.0 2020: R+49.6 2016: R+51.0 2012: R+28.6 2008: R+12.6
Not yet ingested
- Civics
- —
Market trends
- HPI YoY
- ▼ -50.71%
- Current HPI
- 153.9522
- Rent YoY
- —
- Metro
- —
- State GDP YoY
- —
- F500 in state
- 0
Price history
-15.4% since first listed7 events — show timeline
- 2026-05-23 Price Changed $54,995 WBOR
- 2026-03-11 Relisted — WBOR
- 2026-02-01 Delisted — WBOR
- 2026-01-05 Price Changed $57,500 WBOR
- 2025-10-30 Price Changed $59,900 WBOR
- 2025-10-16 Price Changed $62,500 WBOR
- 2025-08-28 Listed $65,000 WBOR
Property tax history
+1.8%/yrLatest (2025): $691 · +2.8% YoY. Source: county tax records.
Cash-flow waterfall
monthlySold comps — $/sqft
last 12 mo · ≤1 miLoading sold comps…