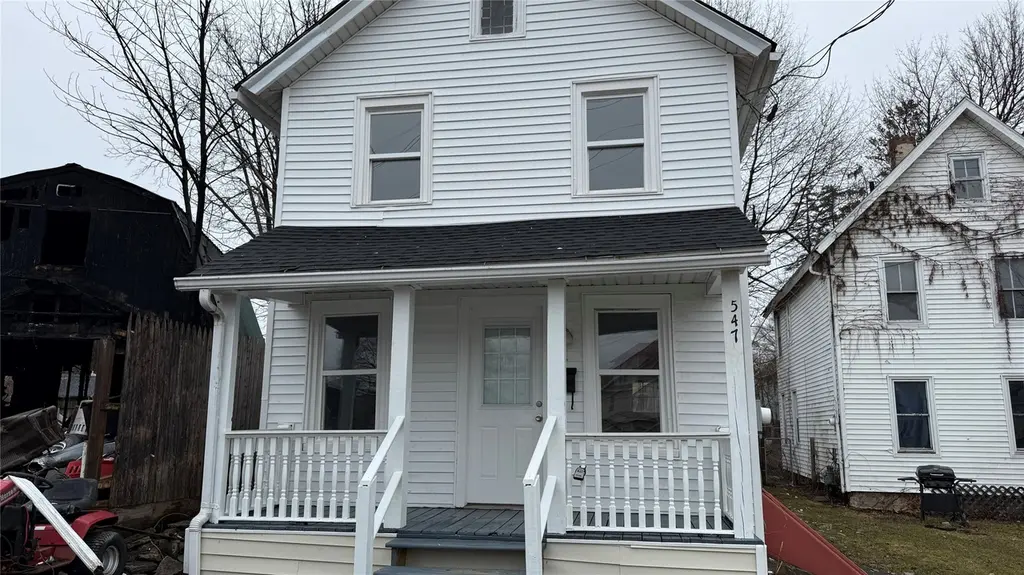
547 State St · Binghamton, NY
Flood risk 5/10 · Moderate
- FEMA flood zone
- X
- Chance of flooding over 30 yrs
- 0.27%
- Est. flood insurance / yr
- $473 – $860
Fire risk 1/10 · Minimal
- Est. fire insurance / yr
- $691 – $1,283
Heat risk 3/10 · Minor
- Hot days now (above 94°F)
- 8 days/yr
- Hot days in 30 yrs
- 17 days/yr
Wind risk 2/10 · Minimal
- Chance of severe wind over 30 yrs
- 1.0%
Air-quality risk 2/10 · Minimal
- Unhealthy air days now
- 0 days/yr
- Unhealthy air days in 30 yrs
- 1 days/yr
Risk factors via First Street. Map © Google.
Why this score? — see what drove the C+ grade
The composite is a weighted blend of 9 inputs, each scored 0–100. Each bar is that input's sub-score; the figure is the points it added to the 100-point composite (weight × sub-score).
- Cash flow +25.7/30.0
- ARV discount +11.3/15.0
- DSCR +8.6/10.0
- 1% rule +7.1/10.0
- Livability +3.9/5.0
- Schools +3.0/10.0
- Rent growth +2.5/5.0
- Condition / age +2.5/5.0
- Appreciation +0.0/10.0
$107,000
🖨 Deal sheet 📄 Offer letter ✓ Due diligence
Listing remarks MLS
Welcome to this single-family home conveniently located in Binghamton, close to downtown, shopping, restaurants, and major roadways. This home has been updated throughout offering a clean and move-in-ready interior. Some updates include fresh paint throughout, new flooring, an updated kitchen, an updated bathroom, and many more! New siding adds to the exterior appeal and provides low-maintenance durability. This home also features a large back deck, providing a great space for relaxing or outdoor gatherings. A solid opportunity for an owner-occupant or investor looking for an updated home in a central location. Call your favorite agent today to set up a time to come see it in person!
Key facts
- Large back deck
- New siding
- Updated kitchen
Tags
Neighborhood map
What this means for you Summary
Snapshot
- This is a 2-bed/1.0-bath single-family listed at $107k.
Deal economics
- At list price, monthly cash flow is $255 ($3k/yr) — positive.
- The deal already cash-flows at list — no discount required.
- Meets the 1% rule at list price ($1k rent vs $107k).
- Recommended offer: $101k (6.0% below list) — sets the bar for market timing.
- Cap rate 9.2% vs local median 6.4% in Binghamton — top-decile yield for the area; either an underpriced asset or a hidden risk that comps aren't pricing in. Stress-test before assuming the spread holds.
Location & tenants
- Location reads 78/100 on livability (#174 in NY, #2,710 nationally) — a middle-class / working-renter tenant base. Strengths: amenities A+, commute A+, cost of living A+; Watch: schools D, crime F, employment F.
- Binghamton City School District (urban): math 30% / reading 44% proficiency, ranked #557 of 590 in NY (top 94%) — families likely to look elsewhere, expect single-tenant / working-renter base with shorter leases; 61% free/reduced lunch — lower-income household profile, screen leases tightly.
- Market conditions: 92 active listings in the ZIP; 28 comparable units currently listed for rent nearby; rentals lingering (median 44d on market — plan ~5-8 weeks vacancy on turnover, expect pricing pressure); 57% of comp listings sitting > 30 days — soft ceiling on asking rent; 340 units permitted in Broome County in 2024 (269 in 5+ unit buildings).
Forward outlook
- Local home prices are declining (-3.0%/yr); year-one equity from $740 of loan paydown is wiped out by about $3k of value loss. Plan a longer hold.
- Broome County population projected at -13% by 2050 — secular population decline; favor cash flow + early exit over multi-decade hold.
Negotiation context
- It's been on market 81 days — a 6% lower offer ($101k) is reasonable based on typical stale-listing flexibility.
- 2 sale attempts with the ask held roughly flat each time — persistent listings suggest the price (not the market) is what's stuck; bring a comps-based counter.
- Current owner paid $20k; list at $107k implies a 435% gain — meaningful room to come down on a strong offer.
Risks & watch-outs
- Watch-outs: built in 1910 — expect roof / HVAC / electrical / plumbing capex.
- Climate carrying-cost: moderate flood risk — expect insurance premiums to compound above CPI over the hold.
Questions for the listing agent
- It's been on market 81 days. Have you received any prior offers? Is the seller open to a 6% concession, seller financing, or rate buy-down credit?
- Built in 1910 — when were the roof, HVAC, electrical panel, plumbing, and water heater last replaced?
- Why hasn't it sold? Are there any deal-killer items the seller is aware of (foundation, flood, title, zoning, code violations)?
- Is there a deadline driving the sale (1031 exchange, divorce, estate, relocation)? That informs how much negotiation room exists.
- Schools are D-rated, which usually means shorter tenancies and higher turnover. Who's the typical renter profile here, and what's been the actual vacancy rate?
- Crime grade is F in this area — have there been break-ins, vandalism, or insurance claims at this property in the last 3 years? What carrier currently insures it and at what premium?
- What's the average days-on-market for RENTAL listings here right now (not sales)? A rising rental-DOM trend means longer vacancies and softer asking-rent achievability than the comps imply.
- What's the recent tenant-quality profile in this submarket — average credit score on applications, eviction rate, late-payment / NSF rate, and stable-employment percentage? A property-management company in the area should have these aggregated.
- How much new for-sale + rental construction is in the pipeline within 1–3 miles? Heavy new supply typically softens prices + rents 12–24 months out; constrained supply supports both.
Investment metrics
- 1% rule
- 1.21% ✓
- Cap rate
- 9.16%
- Cash-on-cash
- 10.23%
- DSCR
- 1.46
- GRM
- 6.9
CMA / ARV
- ARV (median comp)
- $116,903
- List price
- $107,000
- Delta
- -8.47%
- Verdict
- FAIR
- Comps
- 20 within 1.0 mi
Show comp detail 6 sales within ~0.75 mi
| Address | Dist | Beds/Ba | Sqft | Sold | Price | $/sf | Match |
|---|---|---|---|---|---|---|---|
| 23 Yager St St | 0.33mi | 3/1.0 (+1) | 1,212 (+5%) | 1mo | $125,000 | $103 | 70 |
| 530 Chenango St | 0.43mi | 3/1.0 (+1) | 1,176 (+2%) | 8mo | $117,000 | $99 | 64 |
| 7 Emmett St | 0.46mi | 2/1.0 | 1,224 (+6%) | 5mo | $90,000 | $74 | 64 |
| 162 Prospect Ave | 0.54mi | 2/1.5 | 1,240 (+8%) | 13mo | $102,000 | $82 | 49 |
| 124 Robinson St | 0.55mi | 3/1.0 (+1) | 1,296 (+12%) | 14mo | $105,000 | $81 | 37 |
| 20 Franklin St | 0.65mi | 3/1.5 (+1) | 1,320 (+15%) | 9mo | $100,000 | $76 | 31 |
Match score weights: distance 35% · size 25% · config 20% · recency 20%. Top-matched comps best support the ARV.
Projected returns pro-forma
-3.0% appreciation · 3.0% rent growth · sell at horizon
- IRR
- -0.9%
- Equity multiple
- 0.97×
- Total profit
- $-1,029
- Equity at exit
- $15,954
- IRR
- 8.8%
- Equity multiple
- 1.67×
- Total profit
- $20,215
- Equity at exit
- $9,251
Cash invested: $29,960 (down + closing). Projections, not guarantees.
Landlord ↔ Tenant lean methodology
- Overall (STATE)
- 15 Strongly Tenant-Friendly
- State New York
- 15 Strongly Tenant-Friendly · D+10
- County
- — inherits STATE
- City
- — inherits STATE
ZIP-level market 13901
- Home prices YoY
- -5.1%
- Active inventory
- 92
- Price-to-rent
- 6.9×
Monthly cashflow live
- Estimated rent
- $1,300 high interval (Pro) →
- Mortgage (P&I)
- −$561
- Tax from tax record
- −$166 /mo · $1,988/yr
- Insurance
- −$45
- HOA
- −$0
- Vacancy / Maint / Mgmt
- −$273
- Net cashflow
- $255
Break-even live
UW: 25.0% down · 7.5% · 30yr · 1.5% tax · 5.0% vac · 8.0% maint · 8.0% mgmt
Financing live
Cash to close
- Down payment
- $26,750
- Closing costs
- $3,210
- Reserves months
- —
- Total cash needed
- —
Loan-product check · same deal, 3 products live
Conventional
25% down · 7.5% · 30yr
- Down + closing
- —
- Monthly P&I
- —
- Monthly cashflow
- —
- DSCR
- —
- Eligible?
- —
Personal DTI + credit; lowest rate.
DSCR
20% down · 8.5% · 30yr
- Down + closing
- —
- Monthly P&I
- —
- Monthly cashflow
- —
- DSCR
- —
- Eligible?
- —
No personal income docs; deal must DSCR.
Hard money
10% down · 12.0% · 12mo
- Down + closing
- —
- Monthly P&I
- —
- Monthly cashflow
- —
- DSCR
- —
- Eligible?
- —
Short-term bridge; refi at stabilization.
Rent comps 28 comps
| Address | Beds | Baths | Sqft | Rent | $/sqft | DOM | Units | Dist |
|---|---|---|---|---|---|---|---|---|
| 1 Sturges St #2 Binghamton, NY | 2.0 | 1.0 | 800 | $1,200 | $1.50 | 13d | 1 | 0.20mi |
| 528 Chenango St Unit 1 Binghamton, NY | 3.0 | 1.0 | 1250 | $1,500 | $1.20 | 13d | 1 | 0.40mi |
| 14 Dennison Ave Unit 2 Binghamton, NY | 2.0 | 1.0 | 1100 | $1,150 | $1.05 | 43d | 1 | 0.46mi |
| 274 Chenango St Unit 1 Binghamton, NY | 1.0 | 1.0 | 850 | $1,200 | $1.41 | 43d | 1 | 0.49mi |
| 26 Doubleday St Binghamton, NY | 2.0 | 1.0 | 1000 | $1,350 | $1.35 | 43d | 1 | 0.50mi |
| 26 Doubleday St #2 Binghamton, NY | 2.0 | 1.0 | 850 | $1,400 | $1.65 | 44d | 1 | 0.50mi |
| 147 E Frederick St Binghamton, NY | 2.0 | 1.0 | 800 | $1,200 | $1.50 | 13d | 1 | 0.65mi |
| 8 Roosevelt Ave Unit 2 Binghamton, NY | 3.0 | 1.0 | 1400 | $1,500 | $1.07 | 43d | 1 | 0.72mi |
| 8 Roosevelt Ave Binghamton, NY | 3.0 | 1.0 | 1400 | $1,450 | $1.04 | 21d | 1 | 0.72mi |
| 198 Court St Unit 10 Binghamton, NY | 2.0 | 1.0 | 700 | $1,200 | $1.71 | 21d | 1 | 0.89mi |
| 198 Court St Unit 6 Binghamton, NY | 2.0 | 1.0 | 700 | $1,350 | $1.93 | 21d | 1 | 0.89mi |
| 33 Fayette St Unit 22 Binghamton, NY | 2.0 | 1.0 | 1350 | $1,100 | $0.81 | 13d | 1 | 0.94mi |
| 28 Lydia St Unit 1-R Binghamton, NY | 2.0 | 1.0 | 770 | $1,200 | $1.56 | 44d | 1 | 1.00mi |
| 27 Tompkins St Unit 9 Binghamton, NY | 2.0 | 1.0 | 950 | $950 | $1.00 | 43d | 1 | 1.00mi |
| 27 Tompkins St Unit 10 Binghamton, NY | 2.0 | 1.0 | 950 | $1,050 | $1.11 | 21d | 1 | 1.00mi |
| 37 Bigelow St Unit 1 Binghamton, NY | 3.0 | 1.5 | 854 | $1,500 | $1.76 | 13d | 1 | 1.09mi |
| 167 Oak St Unit 1 Binghamton, NY | 2.0 | 1.0 | 923 | $1,300 | $1.41 | 43d | 1 | 1.11mi |
| 159 Washington St Binghamton, NY | 1.0 | 1.0 | 725 | $1,372 | $1.89 | 43d | 4 | 1.14mi |
| 38 Carroll St Unit 21 Binghamton, NY | 1.0 | 1.0 | 800 | $1,050 | $1.31 | 43d | 1 | 1.15mi |
| 81 State St Unit 2 Binghamton, NY | 2.0 | 2.0 | 800 | $1,000 | $1.25 | 43d | 1 | 1.20mi |
| 80 State St Unit A 6 Loft Binghamton, NY | 1.0 | 1.0 | 800 | $1,200 | $1.50 | 43d | 1 | 1.21mi |
| 80 State St Unit A 3-1 3 Bed Binghamton, NY | 3.0 | 3.0 | 900 | $900 | $1.00 | 43d | 1 | 1.21mi |
| 4 Erie St Unit 2 Binghamton, NY | 3.0 | 1.0 | 1075 | $1,200 | $1.12 | 43d | 1 | 1.27mi |
| 231 Conklin Ave #2 Binghamton, NY | 3.0 | 1.0 | 700 | $1,350 | $1.93 | 43d | 1 | 1.28mi |
| 171 Chapin St Unit 3rd FL Binghamton, NY | 2.0 | 1.0 | 1135 | $1,500 | $1.32 | 43d | 1 | 1.31mi |
| 46 North St Unit 4 Binghamton, NY | 2.0 | 1.0 | 1000 | $1,600 | $1.60 | 13d | 1 | 1.39mi |
| 86 Conklin Ave Binghamton, NY | 3.0 | 1.0 | 1316 | $1,600 | $1.22 | 13d | 1 | 1.44mi |
| 50 Front St Binghamton, NY | 1.0 | 1.0 | 1092 | $2,450 | $2.24 | 13d | 8 | 1.50mi |
Listing history 8 events
-
2026-06-01days on market $107,000 Active 81 DOM
-
2026-05-31days on market $107,000 Active 80 DOM
-
2026-05-30days on market $107,000 Active 79 DOM
-
2026-04-21price $107,000 693-char remark
Show marketing remark (693 chars)
Welcome to this single-family home conveniently located in Binghamton, close to downtown, shopping, restaurants, and major roadways. This home has been updated throughout offering a clean and move-in-ready interior. Some updates include fresh paint throughout, new flooring, an updated kitchen, an updated bathroom, and many more! New siding adds to the exterior appeal and provides low-maintenance durability. This home also features a large back deck, providing a great space for relaxing or outdoor gatherings. A solid opportunity for an owner-occupant or investor looking for an updated home in a central location. Call your favorite agent today to set up a time to come see it in person!
-
2026-03-12$110,000 Active 693-char remark
Show marketing remark (693 chars)
Welcome to this single-family home conveniently located in Binghamton, close to downtown, shopping, restaurants, and major roadways. This home has been updated throughout offering a clean and move-in-ready interior. Some updates include fresh paint throughout, new flooring, an updated kitchen, an updated bathroom, and many more! New siding adds to the exterior appeal and provides low-maintenance durability. This home also features a large back deck, providing a great space for relaxing or outdoor gatherings. A solid opportunity for an owner-occupant or investor looking for an updated home in a central location. Call your favorite agent today to set up a time to come see it in person!
-
2026-01-15price $129,000
-
2025-12-20$139,000 Active
-
2008-05-09soldstatus $20,000
ⓘ Source: listings_history table (triggers on properties + properties_extension) + one-shot
backfill from property_details.listing_events for pre-trigger history.
Tax reassessment forecast NY · Partial reset (capped growth)
- Current annual tax
- $1,988 · $166/mo
- Projected year-2 tax
- $1,988 · $166/mo
- Expected delta
- $0/yr ($0/mo · 0.0%)
ⓘ Screening estimate from a state-policy table — verify with the county assessor before closing.
Climate risk First Street
- Flood 5/10 Major FEMA zone X · 27% chance over 30 yrs
- Wildfire 1/10 Low
- Heat 3/10 Moderate 8 d/yr ≥94°F today · 17 d/yr by 30 yrs out
- Wind 2/10 Low 100% chance of damaging wind over 30 yrs
- Air quality 2/10 Low 0 unhealthy d/yr today · 1 by 30 yrs out
Nearby sold comps map
Loading sold comps map…
Walkable amenities ~0.75 mi
Loading nearby amenities…
Taxation est. · year 1
- Rental income
- $15,598
- − Mortgage interest
- −$5,994
- − Property taxes
- −$1,988
- − Insurance
- −$535
- − Repairs & maintenance
- −$1,248
- − Management
- −$1,248
- − Depreciation
- −$3,113
- Taxable income
- $1,473
- Est. tax owed @ 24.0%
- −$353
- After-tax cash flow
- $2,712/yr
For passive investors: Depreciation is non-cash, so a rental often shows a tax loss while cash-flowing — sheltering income. Rental losses are passive: they offset passive income freely, and up to $25,000/yr can offset ordinary (W-2) income if you actively participate and your MAGI is under $100k (phasing out to $0 by $150k); unused losses carry forward. On sale, claimed depreciation is recaptured at up to 25%, and gains may owe capital-gains tax (a 1031 exchange can defer both). Figures are a year-1 estimate at your 24.0% rate — not tax advice; consult a CPA.
Schools (NCES district)
- District
- Binghamton City School District
- NCES district ID
- 3604870
- Math proficiency
- 30% ▬ 0.00%
- Reading proficiency
- 44% ▲ 15.00%
- Median HH income
- $30,475
- Composite
- 30.09/100
- National rank
- #6342
- State rank
- #557 of 590 in NY
Livability — Binghamton
- Score
- 78/100
- State rank
- #174
- US rank
- #2710
Category grades
Schools grade is shown separately in the Schools card above.
Census & demographics
- Census place
- Binghamton, NY
- County
- Broome County · 126,805 people
- City population
- 65,170
- Metro
- Binghamton, NY
- Population (ZIP)
- 19,613
- Household income
- $55,523
- Rent vs Own
- Severe rent burden
- 1230.0
Population outlook (Broome County) Hauer SSP2
- Today (2025)
- 187,989 people
- By 2030
- 183,066 · -2.6%
- By 2040
- 172,228 · -8.4%
- By 2050
- 163,161 · -13.2%
- By 2075
- 153,641 · -18.3%
- By 2100
- 140,851 · -25.1%
Race, ethnicity, and origin ACS 2023
- Neighborhood character
- Predominantly White (80%)
- Race & ethnicity
- White 80% Two or more races 7% Hispanic / Latino 7% Black 5% Asian 2%
- Hispanic origin (detail)
- Puerto Rican 3%
- Common ancestry
- Romanian 6% Lithuanian 1% Italian 1%
- Foreign-born
- 5% · Canada, Jamaica
- Languages at home
- 93% English-only · Spanish 3% Russian/Polish/Slavic 1% Other Indo-European 1%
Political lean MEDSL · Broome
- 2024 margin
- Toss-up / Even · D 50.2% · R 49.8%
- 2008→2024 swing
- -7.6pp toward R · 2008: 8.0pp · 2024: 0.4pp
- All cycles
- 2024: D+0.4 2020: D+3.5 2016: R+3.7 2012: D+4.6 2008: D+8.0
Not yet ingested
- Civics
- —
Market trends
- HPI YoY
- ▼ -16.13%
- Current HPI
- 300.7692
- Rent YoY
- —
- Metro
- Binghamton, NY
- State GDP YoY
- ▲ 2.60%
- F500 in state
- 92
Industry mix (Fortune 500 HQ in NY)
| Industry | F500 HQs | Revenue |
|---|---|---|
| Financial Services | 10 | $950B |
|
||
| Consumer Goods | 9 | $162B |
|
||
| Insurance | 4 | $225B |
|
||
| Telecommunications | 2 | $144B |
|
||
| Pharmaceuticals | 2 | $112B |
|
||
| Media / Entertainment | 2 | $69B |
|
||
Price history
+435.0% since first listed5 events — show timeline
- 2026-04-21 Price Changed $107,000 GBAOR
- 2026-03-12 Listed $110,000 GBAOR
- 2026-01-15 Price Changed $129,000 GBAOR
- 2025-12-20 Listed $139,000 GBAOR
- 2008-05-09 Sold (Public Records) $20,000 Public Records
Property tax history
+10.8%/yrLatest (2025): $1,988 · +0.9% YoY. Source: county tax records.
Cash-flow waterfall
monthlySold comps — $/sqft
last 12 mo · ≤1 miLoading sold comps…