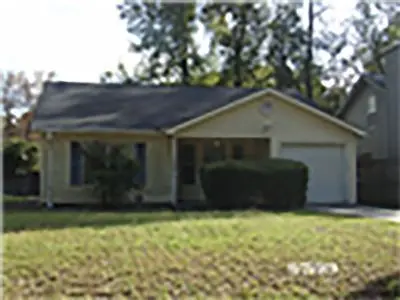
7350 Leghorn St · Savannah, GA
Flood risk 1/10 · Minimal
- FEMA flood zone
- X (unshaded)
- Chance of flooding over 30 yrs
- 0.0%
- Est. flood insurance / yr
- $507 – $1,088
Fire risk 4/10 · Minor
- Est. fire insurance / yr
- $963 – $1,789
Heat risk 10/10 · Severe
- Hot days now (above 106°F)
- 7 days/yr
- Hot days in 30 yrs
- 19 days/yr
Wind risk 9/10 · Severe
- Chance of severe wind over 30 yrs
- 99.0%
Air-quality risk 2/10 · Minimal
- Unhealthy air days now
- 2 days/yr
- Unhealthy air days in 30 yrs
- 2 days/yr
Risk factors via First Street. Map © Google.
Why this score? — see what drove the D grade
The composite is a weighted blend of 9 inputs, each scored 0–100. Each bar is that input's sub-score; the figure is the points it added to the 100-point composite (weight × sub-score).
- Cash flow +13.9/30.0
- ARV discount +10.0/15.0
- Livability +4.3/5.0
- DSCR +4.2/10.0
- 1% rule +3.6/10.0
- Rent growth +2.5/5.0
- Condition / age +2.5/5.0
- Schools +2.0/10.0
- Appreciation +0.0/10.0
$260,000
🖨 Deal sheet 📄 Offer letter ✓ Due diligence
Listing remarks
$260,000 & acirc; & euro; & ldquo; For Sale By Owner | Buyer & acirc; & euro; & trade; s agents welcome 7350 Leghorn Street, Savannah, GA 31406 3 beds | 2 baths | 1,239 sq ft | 4,791 sq ft lot Charming single-story home priced to sell! This well-maintained 3-bedroom, 2-bathroom home offers 1,239 sq ft of living space with a smart, functional layout perfect for families, first-time buyers, or anyone looking to downsize. Features include central A/C and heating, an attached garage, and a spacious backyard & acirc; & euro; & rdquo; all set on a 4,791 sq ft lot in a quiet, established neighborhood. Highlights: Single-story floor plan Central A/C and
Key facts
- Built 1994
- Listed 23 days
Neighborhood map
What this means for you Summary
Snapshot
- This is a 3-bed/2.0-bath single-family listed at $260k.
Deal economics
- At list price, monthly cash flow is $30 ($357/yr) — positive.
- The deal already cash-flows at list — no discount required.
- To meet the 1% rule (rent ≥ 1% of price), the offer needs to be $225k (13.6% below list).
- Recommended offer: $225k (13.6% below list) — sets the bar for 1% rule.
- Cap rate 6.4% vs local median 4.0% in Savannah — top-decile yield for the area; either an underpriced asset or a hidden risk that comps aren't pricing in. Stress-test before assuming the spread holds.
Location & tenants
- Location reads 86/100 on livability (#1 in GA, #397 nationally) — a professional / high-income tenant draw. Strengths: crime A+, amenities A+, commute A+; Watch: employment D, schools F.
- Savannah-Chatham County (urban): math 20% / reading 26% proficiency, ranked #134 of 174 in GA (top 77%) — low school quality limits family demand, transient renter base, plan for 1-2y turnover.
- Market conditions: Rents flat; 176 active listings in the ZIP; 12 comparable units currently listed for rent nearby; rentals at typical pace (median 23d on market — plan ~3-4 weeks tenant-placement turnaround); 2,694 units permitted in Chatham County in 2024 (973 in 5+ unit buildings).
- This rent runs 40% of the median local income ($67k/yr) — at the standard rent-burdened threshold; future hikes will face affordability resistance.
Forward outlook
- Local home prices are declining (-3.0%/yr); year-one equity from $2k of loan paydown is wiped out by about $8k of value loss. Plan a longer hold.
- Chatham County population projected at +33% by 2050 — long-run rental-demand tailwind backs the buy-and-hold thesis.
Negotiation context
- It's been on market 23 days — a 2% lower offer ($256k) is reasonable based on typical stale-listing flexibility.
- Current owner paid $65k; list at $260k implies a 300% gain — meaningful room to come down on a strong offer.
Risks & watch-outs
- Climate carrying-cost: severe wind risk, 99% chance of damaging wind over 30y; extreme-heat days projected 7→19/yr by 2055 (HVAC capex compounding) — expect insurance premiums to compound above CPI over the hold.
Questions for the listing agent
- Is there a deadline driving the sale (1031 exchange, divorce, estate, relocation)? That informs how much negotiation room exists.
- Schools are F-rated, which usually means shorter tenancies and higher turnover. Who's the typical renter profile here, and what's been the actual vacancy rate?
- The area grade is low — what's the realistic commute time and amenity access for the typical tenant pool here? Any planned neighborhood developments (good or bad) we should know about?
- What's the average days-on-market for RENTAL listings here right now (not sales)? A rising rental-DOM trend means longer vacancies and softer asking-rent achievability than the comps imply.
- What's the recent tenant-quality profile in this submarket — average credit score on applications, eviction rate, late-payment / NSF rate, and stable-employment percentage? A property-management company in the area should have these aggregated.
- How much new for-sale + rental construction is in the pipeline within 1–3 miles? Heavy new supply typically softens prices + rents 12–24 months out; constrained supply supports both.
Investment metrics
- 1% rule
- 0.86% ✗
- Cap rate
- 6.43%
- Cash-on-cash
- 0.49%
- DSCR
- 1.02
- GRM
- 9.6
CMA / ARV
- ARV (on-the-fly)
- $275,058
- Comps found
- 12
Show comp detail 12 sales within ~0.75 mi
| Address | Dist | Beds/Ba | Sqft | Sold | Price | $/sf | Match |
|---|---|---|---|---|---|---|---|
| 7305 Leghorn St | 0.21mi | 3/2.0 | 1,248 (+1%) | 10mo | $270,000 | $216 | 81 |
| 7303 Albert St | 0.22mi | 3/2.0 | 1,228 (-1%) | 10mo | $298,000 | $243 | 80 |
| 7322 Albert St | 0.14mi | 4/2.0 (+1) | 1,295 (+4%) | 2mo | $212,500 | $164 | 79 |
| 7227 Central Ave | 0.19mi | 3/2.0 | 1,331 (+7%) | 9mo | $296,000 | $222 | 72 |
| 7206 Garfield St | 0.46mi | 3/2.0 | 1,274 (+3%) | 3mo | $300,000 | $235 | 71 |
| 11 Gilliam Ave | 0.69mi | 3/2.0 | 1,241 (+0%) | 8mo | $295,000 | $238 | 61 |
| 7014 Key St | 0.68mi | 3/2.0 | 1,290 (+4%) | 5mo | $213,000 | $165 | 57 |
| 6977 Damascus Rd | 0.74mi | 3/2.0 | 1,227 (-1%) | 8mo | $251,638 | $205 | 57 |
| 113 Gilliam Ave | 0.67mi | 2/1.0 (-1) | 1,161 (-6%) | 7mo | $276,000 | $238 | 43 |
| 10 Tara Manor Dr | 0.68mi | 3/2.0 | 1,372 (+11%) | 10mo | $314,000 | $229 | 42 |
| 4 Friar Tuck Dr | 0.69mi | 4/2.0 (+1) | 1,404 (+13%) | 2mo | $289,900 | $206 | 39 |
| 17 Robin Hood Dr | 0.73mi | 3/2.0 | 1,410 (+14%) | 9mo | $239,000 | $170 | 35 |
Match score weights: distance 35% · size 25% · config 20% · recency 20%. Top-matched comps best support the ARV.
Projected returns pro-forma
-3.0% appreciation · 0.04% rent growth · sell at horizon
- IRR
- -18.8%
- Equity multiple
- 0.36×
- Total profit
- $-46,733
- Equity at exit
- $38,767
- IRR
- -18.5%
- Equity multiple
- 0.13×
- Total profit
- $-63,375
- Equity at exit
- $22,480
Cash invested: $72,800 (down + closing). Projections, not guarantees.
Landlord ↔ Tenant lean methodology
- Overall (STATE)
- 90 Strongly Landlord-Friendly
- State Georgia
- 90 Strongly Landlord-Friendly · R+3
- County
- — inherits STATE
- City
- — inherits STATE
ZIP-level market 31406
- Rents YoY
- 0.0%
- Active inventory
- 176
- Price-to-rent
- 9.6×
Monthly cashflow live
- Estimated rent
- $2,246 high interval (Pro) →
- Mortgage (P&I)
- −$1,363
- Tax from tax record
- −$273 /mo · $3,271/yr
- Insurance
- −$108
- HOA
- −$0
- Vacancy / Maint / Mgmt
- −$472
- Net cashflow
- $30
Break-even live
UW: 25.0% down · 7.5% · 30yr · 1.5% tax · 5.0% vac · 8.0% maint · 8.0% mgmt
Financing live
Cash to close
- Down payment
- $65,000
- Closing costs
- $7,800
- Reserves months
- —
- Total cash needed
- —
Loan-product check · same deal, 3 products live
Conventional
25% down · 7.5% · 30yr
- Down + closing
- —
- Monthly P&I
- —
- Monthly cashflow
- —
- DSCR
- —
- Eligible?
- —
Personal DTI + credit; lowest rate.
DSCR
20% down · 8.5% · 30yr
- Down + closing
- —
- Monthly P&I
- —
- Monthly cashflow
- —
- DSCR
- —
- Eligible?
- —
No personal income docs; deal must DSCR.
Hard money
10% down · 12.0% · 12mo
- Down + closing
- —
- Monthly P&I
- —
- Monthly cashflow
- —
- DSCR
- —
- Eligible?
- —
Short-term bridge; refi at stabilization.
Rent comps 12 comps
| Address | Beds | Baths | Sqft | Rent | $/sqft | DOM | Units | Dist |
|---|---|---|---|---|---|---|---|---|
| 7339 Leghorn St Savannah, GA | 3.0 | 2.0 | 1156 | $3,200 | $2.77 | 13d | 1 | 0.08mi |
| 124 Hunt Club Ct Savannah, GA | 3.0 | 2.0 | 1018 | $1,700 | $1.67 | 23d | 1 | 0.26mi |
| 135 Hunt Club Ct Savannah, GA | 2.0 | 1.0 | 874 | $1,350 | $1.54 | 23d | 1 | 0.29mi |
| 141 Hunt Club Ct Savannah, GA | 2.0 | 1.5 | 1024 | $1,600 | $1.56 | 23d | 1 | 0.31mi |
| 8618 Ferguson Ave Savannah, GA | 3.0 | 2.0 | 1150 | $1,800 | $1.57 | 23d | 1 | 0.53mi |
| 8620 Ferguson Ave Savannah, GA | 3.0 | 2.0 | 1150 | $1,800 | $1.57 | 23d | 1 | 0.54mi |
| 200 Varnedoe Dr Savannah, GA | 2.0 | 1.0 | 900 | $1,125 | $1.25 | 23d | 1 | 0.69mi |
| 132 Neva Ave Savannah, GA | 3.0 | 2.0 | 1063 | $1,735 | $1.63 | 23d | 1 | 0.80mi |
| 104 Holcomb St Savannah, GA | 2.0 | 2.0 | 963 | $1,950 | $2.02 | 13d | 1 | 0.91mi |
| 100 Fair Oaks DR Savannah, GA | 1.0–3.0 | 1.0–2.0 | 1144 | $2,470 | $2.16 | 13d | 19 | 0.93mi |
| 7708 Central Ave Savannah, GA | 2.0 | 2.0 | 1095 | $4,000 | $3.65 | 43d | 1 | 0.96mi |
| 15 Government Rd Savannah, GA | 2.0 | 1.5 | 1200 | $3,500 | $2.92 | 43d | 1 | 1.36mi |
Listing history 18 events
-
2026-06-18days on market $260,000 Active 23 DOM
-
2026-06-17days on market $260,000 Active 22 DOM
-
2026-06-16days on market $260,000 Active 21 DOM
-
2026-06-15days on market $260,000 Active 20 DOM
-
2026-06-14days on market $260,000 Active 18 DOM
-
2026-06-13days on market $260,000 Active 17 DOM
-
2026-06-10days on market $260,000 Active 15 DOM
-
2026-06-09days on market $260,000 Active 14 DOM
-
2026-06-08days on market $260,000 Active 13 DOM
-
2026-06-07days on market $260,000 Active 12 DOM
-
2026-06-05days on market $260,000 Active 9 DOM
-
2026-06-03days on market $260,000 Active 8 DOM
-
2026-06-02days on market $260,000 Active 7 DOM
-
2026-06-01days on market $260,000 Active 6 DOM
-
2026-05-31days on market $260,000 Active 5 DOM
-
2026-05-30days on market $260,000 Active 4 DOM
-
2026-05-26$260,000 Active
-
1994-04-30soldstatus $65,000
ⓘ Source: listings_history table (triggers on properties + properties_extension) + one-shot
backfill from property_details.listing_events for pre-trigger history.
Tax reassessment forecast GA · Resets to sale price
- Current annual tax
- $3,271 · $273/mo
- Projected year-2 tax
- $3,271 · $273/mo
- Expected delta
- $0/yr ($0/mo · 0.0%)
ⓘ Screening estimate from a state-policy table — verify with the county assessor before closing.
Climate risk First Street
- Flood 1/10 Low FEMA zone X (unshaded) · 0% chance over 30 yrs
- Wildfire 4/10 Moderate
- Heat 10/10 Extreme 7 d/yr ≥106°F today · 19 d/yr by 30 yrs out
- Wind 9/10 Extreme 99% chance of damaging wind over 30 yrs
- Air quality 2/10 Low 2 unhealthy d/yr today · 2 by 30 yrs out
Nearby sold comps map
Loading sold comps map…
Walkable amenities ~0.75 mi
Loading nearby amenities…
Taxation est. · year 1
- Rental income
- $26,948
- − Mortgage interest
- −$14,564
- − Property taxes
- −$3,271
- − Insurance
- −$1,300
- − Repairs & maintenance
- −$2,156
- − Management
- −$2,156
- − Depreciation
- −$7,564
- Taxable loss
- −$4,062
- Est. tax savings @ 24.0%
- +$975
- After-tax cash flow
- $1,331/yr
For passive investors: Depreciation is non-cash, so a rental often shows a tax loss while cash-flowing — sheltering income. Rental losses are passive: they offset passive income freely, and up to $25,000/yr can offset ordinary (W-2) income if you actively participate and your MAGI is under $100k (phasing out to $0 by $150k); unused losses carry forward. On sale, claimed depreciation is recaptured at up to 25%, and gains may owe capital-gains tax (a 1031 exchange can defer both). Figures are a year-1 estimate at your 24.0% rate — not tax advice; consult a CPA.
Schools (NCES district)
- District
- Savannah-Chatham County
- NCES district ID
- 1301020
- Math proficiency
- 20% ▼ -11.00%
- Reading proficiency
- 26% ▼ -5.00%
- Median HH income
- $47,443
- Composite
- 20.14/100
- National rank
- #8639
- State rank
- #134 of 174 in GA
Livability — Savannah
- Score
- 86/100
- State rank
- #1
- US rank
- #397
Category grades
Schools grade is shown separately in the Schools card above.
Census & demographics
- County
- Chatham County · 271,602 people
- City population
- 216,564
- Metro
- Savannah, GA
- Population (ZIP)
- 34,904
- Household income
- $67,120
- Rent vs Own
- Severe rent burden
- 1453.0
Population outlook (Chatham County) Hauer SSP2
- Today (2025)
- 332,584 people
- By 2030
- 355,508 · +6.9%
- By 2040
- 400,030 · +20.3%
- By 2050
- 443,019 · +33.2%
- By 2075
- 534,579 · +60.7%
- By 2100
- 583,863 · +75.6%
Race, ethnicity, and origin ACS 2023
- Neighborhood character
- Diverse neighborhood (Simpson 0.63)
- Race & ethnicity
- White 47% Black 38% Hispanic / Latino 7% Two or more races 6% Asian 4%
- Hispanic origin (detail)
- Mexican 2% Puerto Rican 2%
- Common ancestry
- Slovak 3% Lithuanian 1% Serbian 1%
- Foreign-born
- 7% · Canada, China, Vietnam
- Languages at home
- 91% English-only · Spanish 4% Chinese 2% Other Asian/Pacific 1%
Political lean MEDSL · Chatham
- 2024 margin
- D (+18.0) · D 58.6% · R 40.6%
- 2008→2024 swing
- +3.6pp toward D · 2008: 14.4pp · 2024: 18.0pp
- All cycles
- 2024: D+18.0 2020: D+18.8 2016: D+14.5 2012: D+12.0 2008: D+14.4
Not yet ingested
- Civics
- —
Market trends
- HPI YoY
- ▼ -240.18%
- Current HPI
- 280.3587
- Rent YoY
- ▬ 0.04%
- Metro
- Savannah, GA
- State GDP YoY
- ▲ 2.66%
- F500 in state
- 28
Industry mix (Fortune 500 HQ in GA)
| Industry | F500 HQs | Revenue |
|---|---|---|
| Paper / Packaging | 2 | $29B |
|
||
| Retail | 1 | $160B |
|
||
| Transportation / Logistics | 1 | $91B |
|
||
| Airlines | 1 | $62B |
|
||
| Consumer Goods | 1 | $47B |
|
||
| Utilities | 1 | $25B |
|
||
Price history
+300.0% since first listed2 events — show timeline
- 2026-05-26 Listed $260,000 FSBO.com
- 1994-04-30 Sold (Public Records) $65,000 Public Records
Property tax history
+10.7%/yrLatest (2025): $3,271 · -2.4% YoY. Source: county tax records.
Cash-flow waterfall
monthlySold comps — $/sqft
last 12 mo · ≤1 miLoading sold comps…