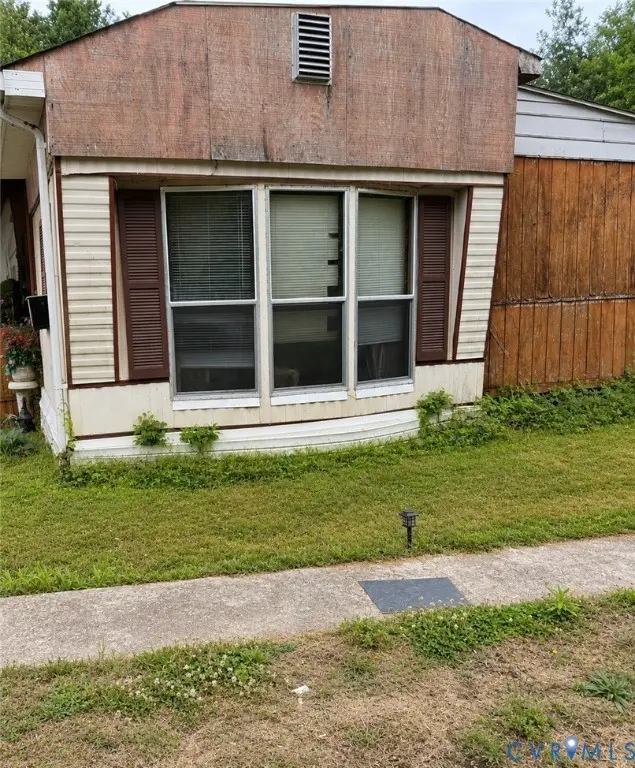
117 Mill Creek Rd · Burkeville, VA
Flood risk 1/10 · Minimal
- FEMA flood zone
- X (unshaded)
- Chance of flooding over 30 yrs
- 0.0%
- Est. flood insurance / yr
- $507 – $1,088
Fire risk 3/10 · Minor
- Est. fire insurance / yr
- $666 – $1,236
Heat risk 6/10 · Moderate
- Hot days now (above 104°F)
- 7 days/yr
- Hot days in 30 yrs
- 17 days/yr
Wind risk 4/10 · Minor
- Chance of severe wind over 30 yrs
- 14.0%
Air-quality risk 1/10 · Minimal
- Unhealthy air days now
- 0 days/yr
- Unhealthy air days in 30 yrs
- 0 days/yr
Risk factors via First Street. Map © Google.
Why this score? — see what drove the A- grade
The composite is a weighted blend of 9 inputs, each scored 0–100. Each bar is that input's sub-score; the figure is the points it added to the 100-point composite (weight × sub-score).
- Cash flow +30.0/30.0
- ARV discount +15.0/15.0
- 1% rule +10.0/10.0
- DSCR +10.0/10.0
- Appreciation +6.6/10.0
- Schools +3.0/10.0
- Livability +2.9/5.0
- Rent growth +2.5/5.0
- Condition / age +2.5/5.0
$56,000
🖨 Deal sheet 📄 Offer letter ✓ Due diligence
Listing remarks MLS
Singlewide mobile home with large addition. 3 bedrooms, 2 full baths, large den, shop, two car carport. Great investment property!
Key facts
- 1.86 acre lot
- Built 1972
- Listed 27 days
Property features AI
Exterior
- Utilities: Public water; Septic sewer; Electric service
- Home design: Single-story home; To be built
- Construction: Vinyl siding and wood siding exterior; Composition roof; About 1,008 square feet above-grade finished area
- Exterior features: Approximately 1.86-acre lot; Public water; Septic tank
Interior
- Bathrooms: 2 full bathrooms
- Heating & cooling: Electric heating; Window unit(s) for cooling
- Interior features: 6 total rooms; Resale condition
Neighborhood map
What this means for you Summary
Snapshot
- This is a 3-bed/1.0-bath single-family listed at $56k.
Deal economics
- At list price, monthly cash flow is $407 ($5k/yr) — positive.
- The deal already cash-flows at list — no discount required.
- Meets the 1% rule at list price ($945 rent vs $56k).
- Recommended offer: $55k (1.5% below list) — sets the bar for market timing.
Location & tenants
- Location reads 57/100 on livability (#497 in VA) — a working-class tenant base; expect higher turnover. Strengths: cost of living A+; Watch: crime C-, schools F, amenities F.
- Prince Edward County Public School District (town): math 25% / reading 48% proficiency, ranked #126 of 131 in VA (top 96%) — families likely to look elsewhere, expect single-tenant / working-renter base with shorter leases; 65% free/reduced lunch — lower-income household profile, screen leases tightly.
- Market conditions: 26 active listings in the ZIP; 65 units permitted in Prince Edward County in 2024 (5 in 5+ unit buildings).
Forward outlook
- In year one you build about $2k of equity ($387 loan paydown + $2k appreciation (3.2% local appreciation)).
- Prince Edward County population projected to shrink 9% by 2050 — rents likely to lag national; underwrite the cash flow, not the appreciation.
- At projected returns (3.2% appreciation + 3.0% rent growth), your $16k cash investment doubles in ~3 years — after that, you're playing with house money.
Negotiation context
- It's been on market 27 days — a 2% lower offer ($55k) is reasonable based on typical stale-listing flexibility.
- Current owner paid $31k; list at $56k implies a 81% gain — meaningful room to come down on a strong offer.
Risks & watch-outs
- Climate carrying-cost: extreme-heat days projected 7→17/yr by 2055 (HVAC capex compounding) — expect insurance premiums to compound above CPI over the hold.
Questions for the listing agent
- Built in 1972 — when were the roof, HVAC, electrical panel, plumbing, and water heater last replaced?
- Is there a deadline driving the sale (1031 exchange, divorce, estate, relocation)? That informs how much negotiation room exists.
- Schools are F-rated, which usually means shorter tenancies and higher turnover. Who's the typical renter profile here, and what's been the actual vacancy rate?
- What's the average days-on-market for RENTAL listings here right now (not sales)? A rising rental-DOM trend means longer vacancies and softer asking-rent achievability than the comps imply.
- What's the recent tenant-quality profile in this submarket — average credit score on applications, eviction rate, late-payment / NSF rate, and stable-employment percentage? A property-management company in the area should have these aggregated.
- How much new for-sale + rental construction is in the pipeline within 1–3 miles? Heavy new supply typically softens prices + rents 12–24 months out; constrained supply supports both.
Investment metrics
- 1% rule
- 1.69% ✓
- Cap rate
- 15.01%
- Cash-on-cash
- 31.13%
- DSCR
- 2.39
- GRM
- 4.9
CMA / ARV
- ARV (on-the-fly)
- $71,568
- Comps found
- 3
Show comp detail 3 sales within ~0.75 mi
| Address | Dist | Beds/Ba | Sqft | Sold | Price | $/sf | Match |
|---|---|---|---|---|---|---|---|
| 6379 Patrick Henry Hwy | 0.33mi | 4/1.0 (+1) | 960 (-5%) | 12mo | $68,000 | $71 | 62 |
| 392 Campbell Crossing Rd | 0.73mi | 3/1.0 | 1,042 (+3%) | 8mo | $195,000 | $187 | 54 |
| 264 Holly Ln | 0.42mi | 2/2.0 (-1) | 910 (-10%) | 16mo | $50,000 | $55 | 42 |
Match score weights: distance 35% · size 25% · config 20% · recency 20%. Top-matched comps best support the ARV.
Projected returns pro-forma
3.16% appreciation · 3.0% rent growth · sell at horizon
- IRR
- 37.2%
- Equity multiple
- 3.11×
- Total profit
- $33,117
- Equity at exit
- $25,689
- IRR
- 37.1%
- Equity multiple
- 6.16×
- Total profit
- $80,985
- Equity at exit
- $39,991
Cash invested: $15,680 (down + closing). Projections, not guarantees.
Landlord ↔ Tenant lean methodology
- Overall (STATE)
- 55 Moderately Landlord-Leaning
- State Virginia
- 55 Moderately Landlord-Leaning · D+2
- County
- — inherits STATE
- City
- — inherits STATE
ZIP-level market 23954
- Home prices YoY
- 2.3%
- Active inventory
- 26
- Price-to-rent
- 4.9×
Monthly cashflow live
- Estimated rent
- $945 medium interval (Pro) →
- Mortgage (P&I)
- −$294
- Tax from tax record
- −$23 /mo · $275/yr
- Insurance
- −$23
- HOA
- −$0
- Vacancy / Maint / Mgmt
- −$198
- Net cashflow
- $407
Break-even live
UW: 25.0% down · 7.5% · 30yr · 1.5% tax · 5.0% vac · 8.0% maint · 8.0% mgmt
Financing live
Cash to close
- Down payment
- $14,000
- Closing costs
- $1,680
- Reserves months
- —
- Total cash needed
- —
Loan-product check · same deal, 3 products live
Conventional
25% down · 7.5% · 30yr
- Down + closing
- —
- Monthly P&I
- —
- Monthly cashflow
- —
- DSCR
- —
- Eligible?
- —
Personal DTI + credit; lowest rate.
DSCR
20% down · 8.5% · 30yr
- Down + closing
- —
- Monthly P&I
- —
- Monthly cashflow
- —
- DSCR
- —
- Eligible?
- —
No personal income docs; deal must DSCR.
Hard money
10% down · 12.0% · 12mo
- Down + closing
- —
- Monthly P&I
- —
- Monthly cashflow
- —
- DSCR
- —
- Eligible?
- —
Short-term bridge; refi at stabilization.
Listing history 17 events
-
2026-06-18days on market $56,000 Active 27 DOM
-
2026-06-17days on market $56,000 Active 26 DOM
-
2026-06-16days on market $56,000 Active 25 DOM
-
2026-06-15days on market $56,000 Active 24 DOM
-
2026-06-15pricedays on market $56,000 Active 23 DOM
-
2026-06-13days on market $59,000 Active 22 DOM
-
2026-06-12days on market $59,000 Active 21 DOM
-
2026-06-09days on market $59,000 Active 18 DOM
-
2026-06-08days on market $59,000 Active 17 DOM
-
2026-06-08days on market $59,000 Active 16 DOM
-
2026-06-07days on market $59,000 Active 15 DOM
-
2026-06-03days on market $59,000 Active 12 DOM
-
2026-06-02days on market $59,000 Active 11 DOM
-
2026-06-01days on market $59,000 Active 10 DOM
-
2026-05-31days on market $59,000 Active 9 DOM
-
2026-05-22$59,000 Active
-
2014-12-18soldstatus $31,000 130-char remark
Show marketing remark (130 chars)
Singlewide mobile home with large addition. 3 bedrooms, 2 full baths, large den, shop, two car carport. Great investment property!
ⓘ Source: listings_history table (triggers on properties + properties_extension) + one-shot
backfill from property_details.listing_events for pre-trigger history.
Tax reassessment forecast VA · Resets to sale price
- Current annual tax
- $275 · $23/mo
- Projected year-2 tax
- $459 · $38/mo
- Expected delta
- +$184/yr (+$15/mo · 66.9%)
ⓘ Screening estimate from a state-policy table — verify with the county assessor before closing.
Climate risk First Street
- Flood 1/10 Low FEMA zone X (unshaded) · 0% chance over 30 yrs
- Wildfire 3/10 Moderate
- Heat 6/10 Major 7 d/yr ≥104°F today · 17 d/yr by 30 yrs out
- Wind 4/10 Moderate 14% chance of damaging wind over 30 yrs
- Air quality 1/10 Low 0 unhealthy d/yr today · 0 by 30 yrs out
Nearby sold comps map
Loading sold comps map…
Walkable amenities ~0.75 mi
Loading nearby amenities…
Taxation est. · year 1
- Rental income
- $11,342
- − Mortgage interest
- −$3,137
- − Property taxes
- −$275
- − Insurance
- −$280
- − Repairs & maintenance
- −$907
- − Management
- −$907
- − Depreciation
- −$1,629
- Taxable income
- $4,206
- Est. tax owed @ 24.0%
- −$1,010
- After-tax cash flow
- $3,872/yr
For passive investors: Depreciation is non-cash, so a rental often shows a tax loss while cash-flowing — sheltering income. Rental losses are passive: they offset passive income freely, and up to $25,000/yr can offset ordinary (W-2) income if you actively participate and your MAGI is under $100k (phasing out to $0 by $150k); unused losses carry forward. On sale, claimed depreciation is recaptured at up to 25%, and gains may owe capital-gains tax (a 1031 exchange can defer both). Figures are a year-1 estimate at your 24.0% rate — not tax advice; consult a CPA.
Schools (NCES district)
- District
- Prince Edward County Public School District
- NCES district ID
- 5103060
- Math proficiency
- 25% ▼ -37.00%
- Reading proficiency
- 48% ▼ -12.00%
- Median HH income
- $39,482
- Composite
- 30.49/100
- National rank
- #6221
- State rank
- #126 of 131 in VA
Livability — Burkeville
- Score
- 57/100
- State rank
- #497
- US rank
- #22036
Category grades
Schools grade is shown separately in the Schools card above.
Census & demographics
- Population (ZIP)
- 2,364
Population outlook (Prince Edward County) Hauer SSP2
- Today (2025)
- 24,387 people
- By 2030
- 24,161 · -0.9%
- By 2040
- 23,194 · -4.9%
- By 2050
- 22,292 · -8.6%
- By 2075
- 20,854 · -14.5%
- By 2100
- 19,030 · -22.0%
Race, ethnicity, and origin ACS 2023
- Neighborhood character
- Majority Black (59%)
- Race & ethnicity
- Black 59% White 40%
- Common ancestry
- Portuguese 3% Serbian 3% Romanian 2%
- Foreign-born
- 1% · China
- Languages at home
- 98% English-only · Chinese 1% Spanish 1%
Political lean MEDSL · Prince Edward
- 2024 margin
- Toss-up / Even · D 48.2% · R 50.7% · Other 1.1%
- 2008→2024 swing
- -12.5pp toward R · 2008: 9.9pp · 2024: -2.6pp
- All cycles
- 2024: R+2.6 2020: D+5.6 2016: D+5.4 2012: D+12.8 2008: D+9.9
Not yet ingested
- Civics
- —
Market trends
- HPI YoY
- ▲ 3.16%
- Current HPI
- 141.157
- Rent YoY
- —
- Metro
- —
- State GDP YoY
- ▲ 2.40%
- F500 in state
- 50
Industry mix (Fortune 500 HQ in VA)
| Industry | F500 HQs | Revenue |
|---|---|---|
| Aerospace / Defense | 4 | $236B |
|
||
| Technology / Defense | 3 | $32B |
|
||
| Financial Services | 2 | $176B |
|
||
| Utilities | 2 | $27B |
|
||
| Insurance | 2 | $25B |
|
||
| Technology | 2 | $15B |
|
||
Price history
+90.3% since first listed2 events — show timeline
- 2026-05-22 Listed $59,000 CVRMLS
- 2014-12-18 Sold (MLS) $31,000 SCAR
Property tax history
+1.0%/yrLatest (2025): $275 · -8.2% YoY. Source: county tax records.
Cash-flow waterfall
monthlySold comps — $/sqft
last 12 mo · ≤1 miLoading sold comps…