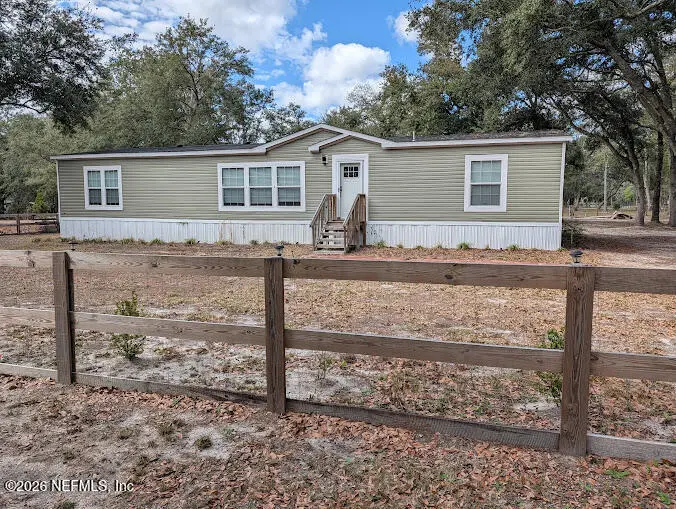
13088 County Road 122 · Sanderson, FL
Flood risk 1/10 · Minimal
- FEMA flood zone
- X (unshaded)
- Chance of flooding over 30 yrs
- 0.0%
- Est. flood insurance / yr
- $507 – $1,088
Fire risk 10/10 · Severe
- Est. fire insurance / yr
- $947 – $1,759
Heat risk 8/10 · Major
- Hot days now (above 108°F)
- 7 days/yr
- Hot days in 30 yrs
- 18 days/yr
Wind risk 9/10 · Severe
- Chance of severe wind over 30 yrs
- 99.0%
Air-quality risk 7/10 · Major
- Unhealthy air days now
- 14 days/yr
- Unhealthy air days in 30 yrs
- 15 days/yr
Risk factors via First Street. Map © Google.
Why this score? — see what drove the D- grade
The composite is a weighted blend of 9 inputs, each scored 0–100. Each bar is that input's sub-score; the figure is the points it added to the 100-point composite (weight × sub-score).
- Cash flow +12.2/30.0
- ARV discount +7.5/15.0
- Schools +4.4/10.0
- DSCR +3.6/10.0
- Rent growth +3.2/5.0
- 1% rule +2.8/10.0
- Livability +2.5/5.0
- Condition / age +2.5/5.0
- Appreciation +0.0/10.0
$259,900
🖨 Deal sheet 📄 Offer letter ✓ Due diligence
Listing remarks
ublic Remarks: Nearly new 2023 Manufactured home on 1.0 Acre This 3-Bedroom 2 Bath home has been completely renovated. New paint throughout. Inside you will find an open concept kitchen with breakfast bar. Kitchen is well appointed with Frigidaire appliances. This home offers a split plan. Primary bedroom includes walk-in closet ensuite with separate shower and a soaking tub. The living area is bathed in natural light. add to the openness. .This inviting home is a true gem. Country living at its finest. Entire property is fenced. Be the first to see and make an offer.
Key facts
- Ensuite
- Open concept kitchen
- Walk-in closet
Tags
Property features AI
Finance
- HOA & community: Not a senior community
Exterior
- Parking: Circular driveway
- Utilities: Septic tank; Cable available; Electricity connected
- Home design: Double wide manufactured home; One story; Faces east; Used as a residential property
- Construction: Vinyl siding; Shingle roof
- Exterior features: Covered rear porch; Full wood fencing; Cleared lot with many trees; Dirt road access
Interior
- Kitchen: Dishwasher; Electric range; Ice maker; Refrigerator; Electric water heater
- Bedrooms: 3 bedrooms
- Flooring: Carpet; Vinyl
- Bathrooms: 2 full bathrooms
- Heating & cooling: Central heating; Central air conditioning
- Interior features: Breakfast bar; Ceiling fan(s); Kitchen island; Open floor plan; Primary bathroom with separate tub and shower; Walk-in closet(s)
- Laundry & utility: Washer hookup; Electric dryer hookup; Utility sink
Neighborhood map
What this means for you Summary
Snapshot
- This is a 3-bed/2.0-bath manufactured listed at $260k.
Deal economics
- At list price, monthly cash flow is $-50 ($-603/yr) — negative.
- To cash-flow at today's rent, offer at most $251k (3.4% below list).
- To meet the 1% rule (rent ≥ 1% of price), the offer needs to be $202k (22.2% below list).
- Recommended offer: $202k (22.2% below list) — sets the bar for 1% rule.
Location & tenants
- Location reads: area grade D — affects rentability + tenant quality, not the cash-flow math above.
- Baker (town): math 53% / reading 49% proficiency, ranked #28 of 73 in FL (top 38%) — acceptable for families but not a draw, mixed tenant base, ~2y average lease.
- Zoned schools: Baker County Middle School (math 47% / reading 42%, grade D, #320 of 571 statewide, top 57%, 1,102 students, 52% FRL); Baker County Senior High School (math 41% / reading 48%, grade F, #237 of 667 statewide, top 36%, 1,425 students, 40% FRL).
- Market conditions: Rents rising (+2.6%/yr); 172 active listings in the ZIP; 99 units permitted in Baker County in 2024 (0 in 5+ unit buildings).
- This rent runs 40% of the median local income ($60k/yr) — at the standard rent-burdened threshold; future hikes will face affordability resistance.
Forward outlook
- Local home prices are declining (-3.0%/yr); year-one equity from $2k of loan paydown is wiped out by about $8k of value loss. Plan a longer hold.
- Baker County population projected to shrink 9% by 2050 — rents likely to lag national; underwrite the cash flow, not the appreciation.
Negotiation context
- It's been on market 31 days — a 3% lower offer ($252k) is reasonable based on typical stale-listing flexibility.
Risks & watch-outs
- Climate carrying-cost: severe wind risk, 99% chance of damaging wind over 30y; severe wildfire risk; extreme-heat days projected 7→18/yr by 2055 (HVAC capex compounding) — expect insurance premiums to compound above CPI over the hold.
Questions for the listing agent
- What do current leases actually rent for vs. the listed asking? Can we see a recent rent roll and the last 12 months of T-12 income?
- It's been on market 31 days. Have you received any prior offers? Is the seller open to a 22% concession, seller financing, or rate buy-down credit?
- Is there a deadline driving the sale (1031 exchange, divorce, estate, relocation)? That informs how much negotiation room exists.
- The area grade is low — what's the realistic commute time and amenity access for the typical tenant pool here? Any planned neighborhood developments (good or bad) we should know about?
- What's the average days-on-market for RENTAL listings here right now (not sales)? A rising rental-DOM trend means longer vacancies and softer asking-rent achievability than the comps imply.
- What's the recent tenant-quality profile in this submarket — average credit score on applications, eviction rate, late-payment / NSF rate, and stable-employment percentage? A property-management company in the area should have these aggregated.
- How much new for-sale + rental construction is in the pipeline within 1–3 miles? Heavy new supply typically softens prices + rents 12–24 months out; constrained supply supports both.
Investment metrics
- 1% rule
- 0.78% ✗
- Cap rate
- 6.06%
- Cash-on-cash
- -0.83%
- DSCR
- 0.96
- GRM
- 10.7
CMA / ARV
No comps found within radius.
Projected returns pro-forma
-3.0% appreciation · 2.6% rent growth · sell at horizon
- IRR
- -18.1%
- Equity multiple
- 0.37×
- Total profit
- $-46,189
- Equity at exit
- $38,752
- IRR
- -11.1%
- Equity multiple
- 0.34×
- Total profit
- $-47,891
- Equity at exit
- $22,471
Cash invested: $72,772 (down + closing). Projections, not guarantees.
Landlord ↔ Tenant lean methodology
- Overall (STATE)
- 87 Strongly Landlord-Friendly
- State Florida
- 87 Strongly Landlord-Friendly · R+3
- County
- — inherits STATE
- City
- — inherits STATE
ZIP-level market 32807
- Home prices YoY
- -20.1%
- Rents YoY
- 2.6%
- Active inventory
- 172
- Price-to-rent
- 10.7×
Monthly cashflow live
- Estimated rent
- $2,023 medium interval (Pro) →
- Mortgage (P&I)
- −$1,363
- Tax from tax record
- −$177 /mo · $2,124/yr
- Insurance
- −$108
- HOA
- −$0
- Vacancy / Maint / Mgmt
- −$425
- Net cashflow
- $-50
Break-even live
UW: 25.0% down · 7.5% · 30yr · 1.5% tax · 5.0% vac · 8.0% maint · 8.0% mgmt
Financing live
Cash to close
- Down payment
- $64,975
- Closing costs
- $7,797
- Reserves months
- —
- Total cash needed
- —
Loan-product check · same deal, 3 products live
Conventional
25% down · 7.5% · 30yr
- Down + closing
- —
- Monthly P&I
- —
- Monthly cashflow
- —
- DSCR
- —
- Eligible?
- —
Personal DTI + credit; lowest rate.
DSCR
20% down · 8.5% · 30yr
- Down + closing
- —
- Monthly P&I
- —
- Monthly cashflow
- —
- DSCR
- —
- Eligible?
- —
No personal income docs; deal must DSCR.
Hard money
10% down · 12.0% · 12mo
- Down + closing
- —
- Monthly P&I
- —
- Monthly cashflow
- —
- DSCR
- —
- Eligible?
- —
Short-term bridge; refi at stabilization.
Listing history 17 events
-
2026-06-19days on market $259,900 Active 31 DOM
-
2026-06-18days on market $259,900 Active 30 DOM
-
2026-06-17days on market $259,900 Active 29 DOM
-
2026-06-16days on market $259,900 Active 28 DOM
-
2026-06-15days on market $259,900 Active 27 DOM
-
2026-06-14days on market $259,900 Active 25 DOM
-
2026-06-12days on market $259,900 Active 24 DOM
-
2026-06-09days on market $259,900 Active 21 DOM
-
2026-06-08days on market $259,900 Active 20 DOM
-
2026-06-07days on market $259,900 Active 19 DOM
-
2026-06-05days on market $259,900 Active 16 DOM
-
2026-06-02days on market $259,900 Active 14 DOM
-
2026-06-01days on market $259,900 Active 13 DOM
-
2026-05-31days on market $259,900 Active 12 DOM
-
2026-05-30days on market $259,900 Active 11 DOM
-
2026-05-22price $259,900
-
2026-05-15$265,000 Active
ⓘ Source: listings_history table (triggers on properties + properties_extension) + one-shot
backfill from property_details.listing_events for pre-trigger history.
Tax reassessment forecast FL · Resets to sale price
- Current annual tax
- $2,124 · $177/mo
- Projected year-2 tax
- $2,157 · $180/mo
- Expected delta
- +$33/yr (+$3/mo · 1.5%)
ⓘ Screening estimate from a state-policy table — verify with the county assessor before closing.
Climate risk First Street
- Flood 1/10 Low FEMA zone X (unshaded) · 0% chance over 30 yrs
- Wildfire 10/10 Extreme
- Heat 8/10 Severe 7 d/yr ≥108°F today · 18 d/yr by 30 yrs out
- Wind 9/10 Extreme 99% chance of damaging wind over 30 yrs
- Air quality 7/10 Severe 14 unhealthy d/yr today · 15 by 30 yrs out
Nearby sold comps map
Loading sold comps map…
Walkable amenities ~0.75 mi
Loading nearby amenities…
Taxation est. · year 1
- Rental income
- $24,273
- − Mortgage interest
- −$14,558
- − Property taxes
- −$2,124
- − Insurance
- −$1,300
- − Repairs & maintenance
- −$1,942
- − Management
- −$1,942
- − Depreciation
- −$7,561
- Taxable loss
- −$5,154
- Est. tax savings @ 24.0%
- +$1,237
- After-tax cash flow
- $633/yr
For passive investors: Depreciation is non-cash, so a rental often shows a tax loss while cash-flowing — sheltering income. Rental losses are passive: they offset passive income freely, and up to $25,000/yr can offset ordinary (W-2) income if you actively participate and your MAGI is under $100k (phasing out to $0 by $150k); unused losses carry forward. On sale, claimed depreciation is recaptured at up to 25%, and gains may owe capital-gains tax (a 1031 exchange can defer both). Figures are a year-1 estimate at your 24.0% rate — not tax advice; consult a CPA.
Schools (NCES district)
- District
- Baker
- NCES district ID
- 1200060
- Math proficiency
- 53% ▼ -6.00%
- Reading proficiency
- 49% ▼ -3.00%
- Median HH income
- $50,301
- Composite
- 43.67/100
- National rank
- #2958
- State rank
- #28 of 73 in FL
Livability — Sanderson
No livability data for this city. (Only ~50 U.S. cities are tracked.)
Census & demographics
- County
- Orange County · 1,471,359 people
- Metro
- Orlando-Kissimmee-Sanford, FL
- Population (ZIP)
- 34,456
- Household income
- $59,971
- Rent vs Own
- Severe rent burden
- 1566.0
Population outlook (Baker County) Hauer SSP2
- Today (2025)
- 27,607 people
- By 2030
- 27,452 · -0.6%
- By 2040
- 26,637 · -3.5%
- By 2050
- 25,103 · -9.1%
- By 2075
- 19,576 · -29.1%
- By 2100
- 11,664 · -57.7%
Race, ethnicity, and origin ACS 2023
- Neighborhood character
- Majority Hispanic (62%)
- Race & ethnicity
- Hispanic / Latino 62% White 25% Two or more races 24% Black 6% Asian 4%
- Hispanic origin (detail)
- Mexican 6% Puerto Rican 28% Cuban 7% Dominican 5%
- Common ancestry
- Romanian 1% Slovak 1% Lithuanian 1%
- Foreign-born
- 26% · Canada, Jamaica, Vietnam
- Languages at home
- 44% English-only · Spanish 52% Vietnamese 2% Other Indo-European 1%
Political lean MEDSL · Baker
- 2024 margin
- Solid R (+73.1) · D 13.2% · R 86.3%
- 2008→2024 swing
- -15.7pp toward R · 2008: -57.4pp · 2024: -73.1pp
- All cycles
- 2024: R+73.1 2020: R+70.2 2016: R+64.8 2012: R+58.6 2008: R+57.4
Not yet ingested
- Civics
- —
Market trends
- HPI YoY
- ▼ -97.72%
- Current HPI
- 388.4089
- Rent YoY
- ▲ 2.60%
- Metro
- Orlando-Kissimmee-Sanford, FL
- State GDP YoY
- ▲ 3.28%
- F500 in state
- 36
Industry mix (Fortune 500 HQ in FL)
| Industry | F500 HQs | Revenue |
|---|---|---|
| Industrial Technology | 2 | $29B |
|
||
| Insurance | 2 | $17B |
|
||
| Retail | 1 | $60B |
|
||
| Technology Distribution | 1 | $58B |
|
||
| Homebuilding | 1 | $35B |
|
||
| Technology Manufacturing | 1 | $35B |
|
||
Price history
-1.9% since first listed2 events — show timeline
- 2026-05-22 Price Changed $259,900 realMLS
- 2026-05-15 Listed $265,000 realMLS
Property tax history
+2.8%/yrLatest (2025): $2,124 · +3.1% YoY. Source: county tax records.
Cash-flow waterfall
monthlySold comps — $/sqft
last 12 mo · ≤1 miLoading sold comps…