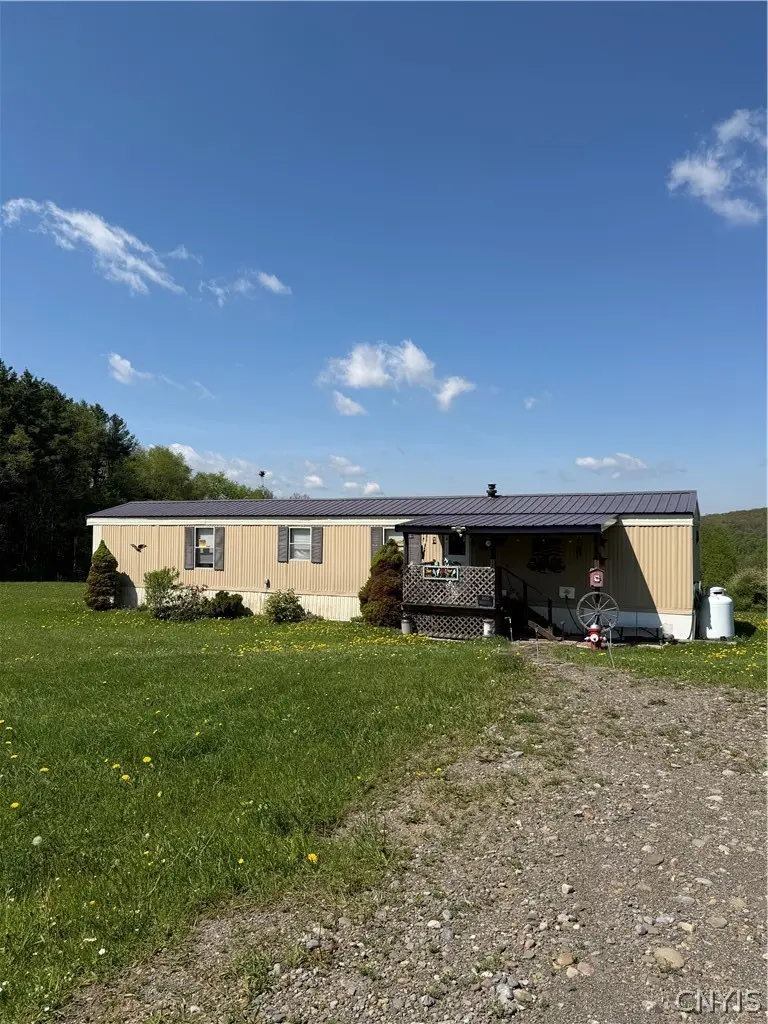
501 Hopkins Crandall Rd · Smyrna, NY
Flood risk 1/10 · Minimal
- FEMA flood zone
- X (unshaded)
- Chance of flooding over 30 yrs
- 0.0%
- Est. flood insurance / yr
- $507 – $1,088
Fire risk 3/10 · Minor
- Est. fire insurance / yr
- $691 – $1,283
Heat risk 1/10 · Minimal
- Hot days now (above 91°F)
- 7 days/yr
- Hot days in 30 yrs
- 16 days/yr
Wind risk 2/10 · Minimal
- Chance of severe wind over 30 yrs
- 1.0%
Air-quality risk 1/10 · Minimal
- Unhealthy air days now
- 0 days/yr
- Unhealthy air days in 30 yrs
- 0 days/yr
Risk factors via First Street. Map © Google.
Why this score? — see what drove the C grade
The composite is a weighted blend of 9 inputs, each scored 0–100. Each bar is that input's sub-score; the figure is the points it added to the 100-point composite (weight × sub-score).
- Cash flow +17.7/30.0
- Appreciation +10.0/10.0
- ARV discount +7.5/15.0
- DSCR +5.5/10.0
- 1% rule +4.2/10.0
- Schools +3.6/10.0
- Livability +2.7/5.0
- Rent growth +2.5/5.0
- Condition / age +2.5/5.0
$110,000
🖨 Deal sheet 📄 Offer letter ✓ Due diligence
Listing remarks MLS
Updated and well tended 2BR home in a great location! Fantastic valley views provide pleasure for every season.
Key facts
- Views
- Updates
- New flooring
Tags
Property features AI
Exterior
- Parking: No garage
- Utilities: Electricity connected; Well water; Septic tank
- Home design: Single-wide mobile home; One-story; Existing structure; Slab foundation
- Construction: Aluminum siding
- Exterior features: Gravel driveway; Leased propane tank; Agricultural, rectangular lot
Interior
- Kitchen: Dishwasher; Gas oven; Gas range; Refrigerator; Eat-in kitchen
- Bedrooms: 2 main-level bedrooms
- Flooring: Laminate; Varies
- Bathrooms: 1 full bathroom (main level)
- Heating & cooling: Propane forced-air heating
- Interior features: Ceiling fan(s); Eat-in kitchen; Kitchen/family room combo; Main level primary bedroom; Bedroom on main level
- Laundry & utility: Washer and dryer on main level; Propane water heater
Neighborhood map
What this means for you Summary
Snapshot
- This is a 2-bed/1.0-bath manufactured listed at $110k.
Deal economics
- At list price, monthly cash flow is $89 ($1k/yr) — positive.
- The deal already cash-flows at list — no discount required.
- To meet the 1% rule (rent ≥ 1% of price), the offer needs to be $102k (7.6% below list).
- Recommended offer: $102k (7.6% below list) — sets the bar for 1% rule.
Location & tenants
- Location reads 53/100 on livability (#1,161 in NY) — a working-class tenant base; expect higher turnover. Strengths: cost of living A+; Watch: health & safety C-, housing D, schools F.
- Sherburne-Earlville Central School District (rural): math 34% / reading 51% proficiency, ranked #492 of 590 in NY (top 83%) — families likely to look elsewhere, expect single-tenant / working-renter base with shorter leases.
- Market conditions: 8 active listings in the ZIP; 151 units permitted in Chenango County in 2024 (96 in 5+ unit buildings).
Forward outlook
- In year one you build about $12k of equity ($761 loan paydown + $11k appreciation (10.0% local appreciation)).
- Chenango County population projected at -26% by 2050 — secular population decline; favor cash flow + early exit over multi-decade hold.
- At projected returns (10.0% appreciation + 3.0% rent growth), your $31k cash investment doubles in ~3 years — after that, you're playing with house money.
- By year 4, paydown + projected appreciation supports a ~$42k cash-out refi (75% LTV) — recoverable capital for the next deal without selling this one.
Negotiation context
- It's been on market 31 days — a 3% lower offer ($107k) is reasonable based on typical stale-listing flexibility.
- 3 sale attempts since 20y ago with the ask held roughly flat each time — persistent listings suggest the price (not the market) is what's stuck; bring a comps-based counter.
- Current owner paid $65k; list at $110k implies a 69% gain — meaningful room to come down on a strong offer.
Questions for the listing agent
- It's been on market 31 days. Have you received any prior offers? Is the seller open to a 8% concession, seller financing, or rate buy-down credit?
- Is there a deadline driving the sale (1031 exchange, divorce, estate, relocation)? That informs how much negotiation room exists.
- Schools are F-rated, which usually means shorter tenancies and higher turnover. Who's the typical renter profile here, and what's been the actual vacancy rate?
- Crime grade is F in this area — have there been break-ins, vandalism, or insurance claims at this property in the last 3 years? What carrier currently insures it and at what premium?
- What's the average days-on-market for RENTAL listings here right now (not sales)? A rising rental-DOM trend means longer vacancies and softer asking-rent achievability than the comps imply.
- What's the recent tenant-quality profile in this submarket — average credit score on applications, eviction rate, late-payment / NSF rate, and stable-employment percentage? A property-management company in the area should have these aggregated.
- How much new for-sale + rental construction is in the pipeline within 1–3 miles? Heavy new supply typically softens prices + rents 12–24 months out; constrained supply supports both.
Investment metrics
- 1% rule
- 0.92% ✗
- Cap rate
- 7.27%
- Cash-on-cash
- 3.48%
- DSCR
- 1.15
- GRM
- 9.0
CMA / ARV
No comps found within radius.
Projected returns pro-forma
10.0% appreciation · 3.0% rent growth · sell at horizon
- IRR
- 26.8%
- Equity multiple
- 3.13×
- Total profit
- $65,585
- Equity at exit
- $99,097
- IRR
- 23.4%
- Equity multiple
- 7.12×
- Total profit
- $188,636
- Equity at exit
- $213,706
Cash invested: $30,800 (down + closing). Projections, not guarantees.
Landlord ↔ Tenant lean methodology
- Overall (STATE)
- 15 Strongly Tenant-Friendly
- State New York
- 15 Strongly Tenant-Friendly · D+10
- County
- — inherits STATE
- City
- — inherits STATE
ZIP-level market 13464
- Home prices YoY
- 4.9%
- Active inventory
- 8
- Price-to-rent
- 9.0×
Monthly cashflow live
- Estimated rent
- $1,017 medium interval (Pro) →
- Mortgage (P&I)
- −$577
- Tax from tax record
- −$91 /mo · $1,093/yr
- Insurance
- −$46
- HOA
- −$0
- Vacancy / Maint / Mgmt
- −$213
- Net cashflow
- $89
Break-even live
UW: 25.0% down · 7.5% · 30yr · 1.5% tax · 5.0% vac · 8.0% maint · 8.0% mgmt
Financing live
Cash to close
- Down payment
- $27,500
- Closing costs
- $3,300
- Reserves months
- —
- Total cash needed
- —
Loan-product check · same deal, 3 products live
Conventional
25% down · 7.5% · 30yr
- Down + closing
- —
- Monthly P&I
- —
- Monthly cashflow
- —
- DSCR
- —
- Eligible?
- —
Personal DTI + credit; lowest rate.
DSCR
20% down · 8.5% · 30yr
- Down + closing
- —
- Monthly P&I
- —
- Monthly cashflow
- —
- DSCR
- —
- Eligible?
- —
No personal income docs; deal must DSCR.
Hard money
10% down · 12.0% · 12mo
- Down + closing
- —
- Monthly P&I
- —
- Monthly cashflow
- —
- DSCR
- —
- Eligible?
- —
Short-term bridge; refi at stabilization.
Listing history 24 events
-
2026-06-18days on market $110,000 Active 31 DOM
-
2026-06-17days on market $110,000 Active 30 DOM
-
2026-06-16days on market $110,000 Active 29 DOM
-
2026-06-15days on market $110,000 Active 28 DOM
-
2026-06-13days on market $110,000 Active 26 DOM
-
2026-06-12days on market $110,000 Active 25 DOM
-
2026-06-09days on market $110,000 Active 22 DOM
-
2026-06-08days on market $110,000 Active 21 DOM
-
2026-06-07days on market $110,000 Active 20 DOM
-
2026-06-07days on market $110,000 Active 19 DOM
-
2026-06-04days on market $110,000 Active 16 DOM
-
2026-06-02days on market $110,000 Active 15 DOM
-
2026-06-01days on market $110,000 Active 14 DOM
-
2026-05-31days on market $110,000 Active 13 DOM
-
2026-05-18$110,000 Active
-
2008-12-30soldstatus $65,000 111-char remark
Show marketing remark (111 chars)
Updated and well tended 2BR home in a great location! Fantastic valley views provide pleasure for every season.
-
2008-12-29soldstatus $64,999
-
2008-10-13$69,900 111-char remark
Show marketing remark (111 chars)
Updated and well tended 2BR home in a great location! Fantastic valley views provide pleasure for every season.
-
2006-11-20soldstatus $47,500
-
2006-09-19soldstatus $47,500 129-char remark
Show marketing remark (129 chars)
Country views, spectacular country setting - 2 acres just 15 minutes from Norwich - Great starter home or Getaway!NICE CONDITION!
-
2006-04-28soldstatus $75,000
-
2006-04-04$49,900 129-char remark
Show marketing remark (129 chars)
Country views, spectacular country setting - 2 acres just 15 minutes from Norwich - Great starter home or Getaway!NICE CONDITION!
-
2001-02-05soldstatus $7,500
-
2001-02-05soldstatus $11,000
ⓘ Source: listings_history table (triggers on properties + properties_extension) + one-shot
backfill from property_details.listing_events for pre-trigger history.
Tax reassessment forecast NY · Partial reset (capped growth)
- Current annual tax
- $1,093 · $91/mo
- Projected year-2 tax
- $1,476 · $123/mo
- Expected delta
- +$383/yr (+$32/mo · 35.1%)
ⓘ Screening estimate from a state-policy table — verify with the county assessor before closing.
Climate risk First Street
- Flood 1/10 Low FEMA zone X (unshaded) · 0% chance over 30 yrs
- Wildfire 3/10 Moderate
- Heat 1/10 Low 7 d/yr ≥91°F today · 16 d/yr by 30 yrs out
- Wind 2/10 Low 100% chance of damaging wind over 30 yrs
- Air quality 1/10 Low 0 unhealthy d/yr today · 0 by 30 yrs out
Nearby sold comps map
Loading sold comps map…
Walkable amenities ~0.75 mi
Loading nearby amenities…
Taxation est. · year 1
- Rental income
- $12,199
- − Mortgage interest
- −$6,162
- − Property taxes
- −$1,093
- − Insurance
- −$550
- − Repairs & maintenance
- −$976
- − Management
- −$976
- − Depreciation
- −$3,200
- Taxable loss
- −$758
- Est. tax savings @ 24.0%
- +$182
- After-tax cash flow
- $1,254/yr
For passive investors: Depreciation is non-cash, so a rental often shows a tax loss while cash-flowing — sheltering income. Rental losses are passive: they offset passive income freely, and up to $25,000/yr can offset ordinary (W-2) income if you actively participate and your MAGI is under $100k (phasing out to $0 by $150k); unused losses carry forward. On sale, claimed depreciation is recaptured at up to 25%, and gains may owe capital-gains tax (a 1031 exchange can defer both). Figures are a year-1 estimate at your 24.0% rate — not tax advice; consult a CPA.
Schools (NCES district)
- District
- Sherburne-Earlville Central School District
- NCES district ID
- 3626700
- Math proficiency
- 34% ▼ -8.00%
- Reading proficiency
- 51% ▲ 12.00%
- Median HH income
- $47,060
- Composite
- 36.22/100
- National rank
- #4725
- State rank
- #492 of 590 in NY
Livability — Smyrna
- Score
- 53/100
- State rank
- #1161
- US rank
- #24610
Category grades
Schools grade is shown separately in the Schools card above.
Census & demographics
- Population (ZIP)
- 1,154
Population outlook (Chenango County) Hauer SSP2
- Today (2025)
- 45,669 people
- By 2030
- 43,484 · -4.8%
- By 2040
- 38,774 · -15.1%
- By 2050
- 34,000 · -25.6%
- By 2075
- 24,637 · -46.1%
- By 2100
- 16,452 · -64.0%
Race, ethnicity, and origin ACS 2023
- Neighborhood character
- Predominantly White (95%)
- Race & ethnicity
- White 95% Two or more races 4%
- Common ancestry
- Lithuanian 2% Iranian 2% Slovak 2%
- Languages at home
- 95% English-only · Spanish 3% French/Haitian/Cajun 1% Other Asian/Pacific 1%
Political lean MEDSL · Chenango
- 2024 margin
- Strong R (+27.2) · D 36.4% · R 63.6%
- 2008→2024 swing
- -26.1pp toward R · 2008: -1.1pp · 2024: -27.2pp
- All cycles
- 2024: R+27.2 2020: R+23.3 2016: R+28.1 2012: R+3.4 2008: R+1.1
Not yet ingested
- Civics
- —
Market trends
- HPI YoY
- ▲ 15.85%
- Current HPI
- 338.4559
- Rent YoY
- —
- Metro
- —
- State GDP YoY
- ▲ 2.60%
- F500 in state
- 92
Industry mix (Fortune 500 HQ in NY)
| Industry | F500 HQs | Revenue |
|---|---|---|
| Financial Services | 10 | $950B |
|
||
| Consumer Goods | 9 | $162B |
|
||
| Insurance | 4 | $225B |
|
||
| Telecommunications | 2 | $144B |
|
||
| Pharmaceuticals | 2 | $112B |
|
||
| Media / Entertainment | 2 | $69B |
|
||
Price history
+1366.7% since first listed10 events — show timeline
- 2026-05-18 Listed $110,000 CNYIS
- 2008-12-30 Sold (MLS) $65,000 UNYREIS
- 2008-12-29 Sold (Public Records) $64,999 Public Records
- 2008-10-13 Listed $69,900 UNYREIS
- 2006-11-20 Sold (Public Records) $47,500 Public Records
- 2006-09-19 Sold (MLS) $47,500 UNYREIS
- 2006-04-28 Sold (Public Records) $75,000 Public Records
- 2006-04-04 Listed $49,900 UNYREIS
- 2001-02-05 Sold (Public Records) $11,000 Public Records
- 2001-02-05 Sold (Public Records) $7,500 Public Records
Property tax history
-0.1%/yrLatest (2025): $1,093 · +0.4% YoY. Source: county tax records.
Cash-flow waterfall
monthlySold comps — $/sqft
last 12 mo · ≤1 miLoading sold comps…