 Multi-family
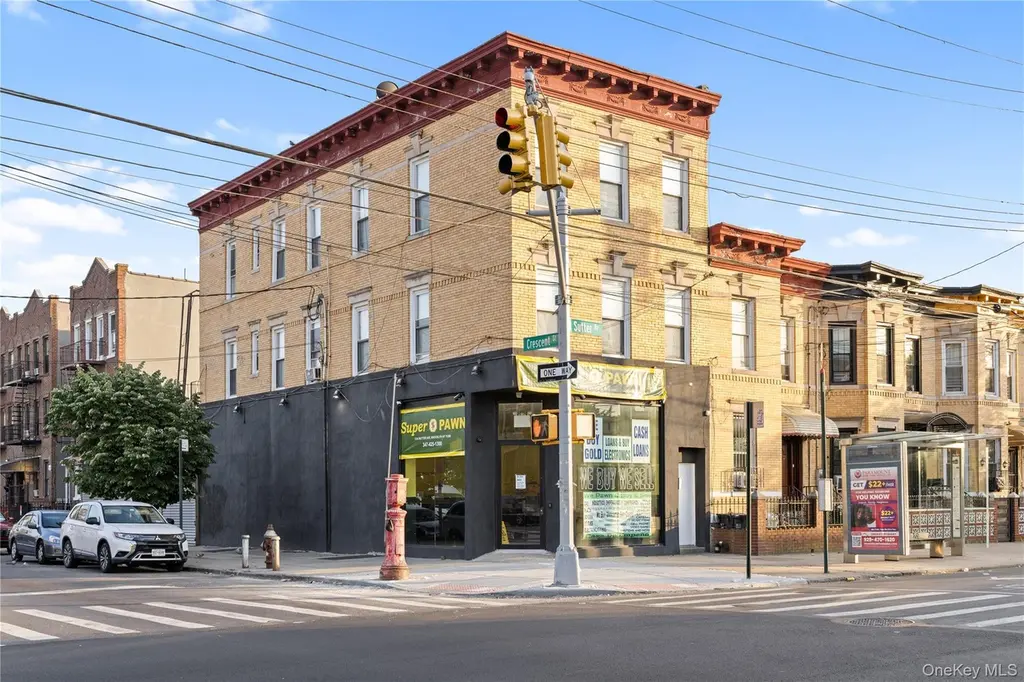
1314 Sutter Ave · New York, NY
Flood risk No data
- FEMA flood zone
- —
- Chance of flooding over 30 yrs
- —
- Est. flood insurance / yr
- —
Fire risk No data
- Est. fire insurance / yr
- —
Heat risk No data
- Hot days now (above threshold)
- —
- Hot days in 30 yrs
- —
Wind risk No data
- Chance of severe wind over 30 yrs
- —
Air-quality risk No data
- Unhealthy air days now
- —
- Unhealthy air days in 30 yrs
- —
Risk factors via First Street. Map © Google.
Why this score? — see what drove the C+ grade
The composite is a weighted blend of 9 inputs, each scored 0–100. Each bar is that input's sub-score; the figure is the points it added to the 100-point composite (weight × sub-score).
- Cash flow +25.7/30.0
- DSCR +8.6/10.0
- 1% rule +6.8/10.0
- ARV discount +5.4/15.0
- Schools +5.0/10.0
- Rent growth +4.0/5.0
- Livability +3.8/5.0
- Condition / age +3.8/5.0
- Appreciation +0.0/10.0
$1,199,000
🖨 Deal sheet 📄 Offer letter ✓ Due diligence
Multi-family units
County records classify this as Multi-Family (2-4 Unit). Listing-text estimate: 1 unit. estimate disagrees with records
Listing remarks
An impressive footprint in 11208, this corner property is 3 stories plus a full basement and has 4 garages that can be used for parking or additional storage. The ground floor offers approximately 1,100 square feet of retail space occupied by an established pawn shop. The second and third floors are residential, with a 3-bedroom, 1-bathroom unit on each floor. The residential units are vacant, providing the flexibility to enjoy owner-occupancy and/or strong rental income. Private parking allows for easy transportation with your own vehicle and the luxury of four garages offers additional income potential, whether used for parking, storage, or leased separately. Public transportation is a dr
Key facts
- Walking distance
- Full basement
- Private parking
Tags
Property features AI
Exterior
- Parking: Garage; 4-car garage
- Utilities: Public sewer; Electricity connected; Natural gas connected; Phone connected; Public trash collection; Water connected
- Home design: Triplex
- Construction: Brick construction
- Exterior features: Brick exterior; Not waterfront
Interior
- Kitchen: Eat-in kitchen layout
- Heating & cooling: Natural gas heating; Wall/window air conditioning units
- Interior features: Eat-in kitchen; Full, partially finished basement
Neighborhood map
What this means for you Summary
Snapshot
- This is a multifamily listed at $1.20M. Condition is rated good.
Deal economics
- At list price, monthly cash flow is $3k ($35k/yr) — positive.
- The deal already cash-flows at list — no discount required.
- Meets the 1% rule at list price ($14k rent vs $1.20M).
- Cap rate 9.2% vs local median 2.6% in New York — top-decile yield for the area; either an underpriced asset or a hidden risk that comps aren't pricing in. Stress-test before assuming the spread holds.
Location & tenants
- Location reads 75/100 on livability (#268 in NY, #4,188 nationally) — a middle-class / working-renter tenant base. Strengths: amenities A+, commute A+, health & safety A; Watch: crime F, cost of living F.
- Market conditions: Rents rising fast (+6.1%/yr); 192 active listings in the ZIP; 3 comparable units currently listed for rent nearby; rentals at typical pace (median 17d on market — plan ~3-4 weeks tenant-placement turnaround); 10,063 units permitted in Kings County in 2024 (9,789 in 5+ unit buildings).
- At $14,141/mo this rent would consume 273% of the median local household income ($62k/yr) (locally 7574% of renters already pay >50% of income on rent) — very limited rent-growth headroom before tenants either downsize or default.
Forward outlook
- Local home prices are declining (-3.0%/yr); year-one equity from $8k of loan paydown is wiped out by about $36k of value loss. Plan a longer hold.
- Kings County population projected at +13% by 2050 — modest demand growth; plan on rents tracking national, not racing it.
- At projected returns (-3.0% appreciation + 6.1% rent growth), your $336k cash investment doubles in ~8 years — after that, you're playing with house money.
Negotiation context
- Only 14 days on market — expect competitive offers; lowballing is unlikely to land.
Risks & watch-outs
- Watch-outs: built in 1923 — expect roof / HVAC / electrical / plumbing capex.
Questions for the listing agent
- Built in 1923 — when were the roof, HVAC, electrical panel, plumbing, and water heater last replaced?
- Is there a deadline driving the sale (1031 exchange, divorce, estate, relocation)? That informs how much negotiation room exists.
- Schools are B-rated — typically a magnet for longer-tenancy family renters. What's the average tenant stay here, and is there a school-zone premium baked into asking?
- Crime grade is F in this area — have there been break-ins, vandalism, or insurance claims at this property in the last 3 years? What carrier currently insures it and at what premium?
- What's the average days-on-market for RENTAL listings here right now (not sales)? A rising rental-DOM trend means longer vacancies and softer asking-rent achievability than the comps imply.
- What's the recent tenant-quality profile in this submarket — average credit score on applications, eviction rate, late-payment / NSF rate, and stable-employment percentage? A property-management company in the area should have these aggregated.
- How much new apartment / multifamily construction is in the pipeline within 1–3 miles? Heavy new supply (>2% of stock underway) typically softens rents 12–24 months out; light construction supports rent growth.
Investment metrics
- 1% rule
- 1.18% ✓
- Cap rate
- 9.18%
- Cash-on-cash
- 10.31%
- DSCR
- 1.46
- GRM
- 7.1
CMA / ARV
- ARV (on-the-fly)
- $1,145,100
- Comps found
- 8
Show comp detail 8 sales within ~0.75 mi
| Address | Dist | Beds/Ba | Sqft | Sold | Price | $/sf | Match |
|---|---|---|---|---|---|---|---|
| 369 Milford St | 0.38mi | 8/1.0 | 3,198 (-3%) | 5mo | $1,200,000 | $375 | 73 |
| 309 Berriman St | 0.51mi | 6/4.0 | 3,432 (+4%) | 6mo | $1,090,000 | $318 | 65 |
| 1140 Sutter Ave | 0.35mi | 8/3.0 | 3,420 (+4%) | 19mo | $694,785 | $203 | 62 |
| 7602 Blake Ave | 0.52mi | 7/3.0 | 3,036 (-8%) | 1mo | $640,000 | $211 | 62 |
| 747 Essex St | 0.69mi | 7/5.0 | 3,600 (+9%) | 3mo | $1,250,000 | $347 | 50 |
| 1017 Dumont Ave | 0.68mi | 8/4.0 | 3,116 (-6%) | 17mo | $618,500 | $198 | 45 |
| 9735 77th St | 0.72mi | 8/2.0 | 2,984 (-10%) | 8mo | $1,450,000 | $486 | 44 |
| 390 Essex St | 0.67mi | 8/5.0 | 2,812 (-15%) | 8mo | $1,140,000 | $405 | 37 |
Match score weights: distance 35% · size 25% · config 20% · recency 20%. Top-matched comps best support the ARV.
Projected returns pro-forma
-3.0% appreciation · 6.14% rent growth · sell at horizon
- IRR
- 2.7%
- Equity multiple
- 1.11×
- Total profit
- $35,775
- Equity at exit
- $178,775
- IRR
- 15.1%
- Equity multiple
- 2.40×
- Total profit
- $470,352
- Equity at exit
- $103,668
Cash invested: $335,720 (down + closing). Projections, not guarantees.
Landlord ↔ Tenant lean methodology
- Overall (CITY)
- 0 Strongly Tenant-Friendly
- State New York
- 15 Strongly Tenant-Friendly · D+10
- County
- — inherits STATE
- City New York
- 0 Strongly Tenant-Friendly · D+34
ZIP-level market 11208
- Rents YoY
- 6.1%
- Active inventory
- 192
- Price-to-rent
- 28.3×
Monthly cashflow live
- Estimated rent
- $14,141 high interval (Pro) →
- Mortgage (P&I)
- −$6,288
- Tax est. 1.5%
- −$1,499 /mo · $17,985/yr
- Insurance
- −$500
- HOA
- −$0
- Vacancy / Maint / Mgmt
- −$2,970
- Net cashflow
- $2,885
Break-even live
4-unit breakdown (identical units grouped — click to expand)
| Units | Beds | Baths | Est. rent |
|---|---|---|---|
| 4× units | 3 | 1 | $14,140 |
| #1 | 3 | 1 | $3,535 |
| #2 | 3 | 1 | $3,535 |
| #3 | 3 | 1 | $3,535 |
| #4 | 3 | 1 | $3,535 |
| Total (4 units) | $14,141 | ||
UW: 25.0% down · 7.5% · 30yr · 1.5% tax · 5.0% vac · 8.0% maint · 8.0% mgmt
Financing live
Cash to close
- Down payment
- $299,750
- Closing costs
- $35,970
- Reserves months
- —
- Total cash needed
- —
Loan-product check · same deal, 3 products live
Conventional
25% down · 7.5% · 30yr
- Down + closing
- —
- Monthly P&I
- —
- Monthly cashflow
- —
- DSCR
- —
- Eligible?
- —
Personal DTI + credit; lowest rate.
DSCR
20% down · 8.5% · 30yr
- Down + closing
- —
- Monthly P&I
- —
- Monthly cashflow
- —
- DSCR
- —
- Eligible?
- —
No personal income docs; deal must DSCR.
Hard money
10% down · 12.0% · 12mo
- Down + closing
- —
- Monthly P&I
- —
- Monthly cashflow
- —
- DSCR
- —
- Eligible?
- —
Short-term bridge; refi at stabilization.
Rent comps 3 comps
| Address | Beds | Baths | Sqft | Rent | $/sqft | DOM | Units | Dist |
|---|---|---|---|---|---|---|---|---|
| 10124 78th St Ozone Park, NY | 3.0 | 1.0 | 2299 | $3,500 | $1.52 | 24d | 1 | 0.70mi |
| 74-38 Jamaica Ave Unit 2 Jamaica, NY | 2.0 | 1.0 | 2480 | $2,800 | $1.13 | 17d | 1 | 1.27mi |
| 97-30 91st St Unit 2 Jamaica, NY | 3.0 | 2.0 | 3465 | $3,000 | $0.87 | 14d | 1 | 1.30mi |
Listing history 9 events
-
2026-06-18days on market $1,199,000 Active 14 DOM
-
2026-06-17days on market $1,199,000 Active 13 DOM
-
2026-06-16days on market $1,199,000 Active 12 DOM
-
2026-06-15days on market $1,199,000 Active 11 DOM
-
2026-06-13days on market $1,199,000 Active 9 DOM
-
2026-06-09days on market $1,199,000 Active 5 DOM
-
2026-06-08days on market $1,199,000 Active 4 DOM
-
2026-06-07remarks 699-char remark
-
2026-06-07$1,199,000 Active 3 DOM
ⓘ Source: listings_history table (triggers on properties + properties_extension) + one-shot
backfill from property_details.listing_events for pre-trigger history.
Nearby sold comps map
Loading sold comps map…
Walkable amenities ~0.75 mi
Loading nearby amenities…
Taxation est. · year 1
- Rental income
- $169,692
- − Mortgage interest
- −$67,163
- − Property taxes
- −$17,985
- − Insurance
- −$5,995
- − Repairs & maintenance
- −$13,575
- − Management
- −$13,575
- − Depreciation
- −$34,880
- Taxable income
- $16,519
- Est. tax owed @ 24.0%
- −$3,964
- After-tax cash flow
- $30,660/yr
For passive investors: Depreciation is non-cash, so a rental often shows a tax loss while cash-flowing — sheltering income. Rental losses are passive: they offset passive income freely, and up to $25,000/yr can offset ordinary (W-2) income if you actively participate and your MAGI is under $100k (phasing out to $0 by $150k); unused losses carry forward. On sale, claimed depreciation is recaptured at up to 25%, and gains may owe capital-gains tax (a 1031 exchange can defer both). Figures are a year-1 estimate at your 24.0% rate — not tax advice; consult a CPA.
Condition & rehab AI · 14 photos
The property is in good condition with some minor repairs and maintenance needed. Upgrading the exterior walls, kitchen flooring, and HVAC system can significantly increase its resale and rental value.
Repairs flagged
- Minor Kitchen flooring — The flooring in the kitchen may need replacement due to wear and tear.
- Minor Living area flooring — The flooring in the living areas may need replacement due to wear and tear.
Value-add opportunities
- Resale Painting the exterior walls — Painting the exterior walls can enhance the curb appeal and make the property more attractive to potential buyers.
- Resale Upgrading the kitchen flooring — Upgrading the kitchen flooring can improve the overall look and feel of the kitchen, making it more appealing to potential buyers.
- Resale Upgrading the living area flooring — Upgrading the living area flooring can improve the overall look and feel of the living areas, making it more appealing to potential buyers.
- Rental Upgrading the HVAC system — Upgrading the HVAC system can improve the comfort and energy efficiency of the property, making it more attractive to potential renters.
Renovation cost estimate screening
| Repair item | Severity | Est. cost |
|---|---|---|
| Kitchen flooring · The flooring in the kitchen may need replacement due to wear and tear. | Minor | $500–3,000 |
| Living area flooring · The flooring in the living areas may need replacement due to wear and tear. | Minor | $500–3,000 |
| Total estimated repair cost · 2 items | $1,000–6,000 |
Value-add ROI direction
- Resale Painting the exterior walls — Painting the exterior walls can enhance the curb appeal and make the property more attractive to potential buyers. ↑
- Resale Upgrading the kitchen flooring — Upgrading the kitchen flooring can improve the overall look and feel of the kitchen, making it more appealing to potential buyers. ↑
- Resale Upgrading the living area flooring — Upgrading the living area flooring can improve the overall look and feel of the living areas, making it more appealing to potential buyers. ↑
- Rental Upgrading the HVAC system — Upgrading the HVAC system can improve the comfort and energy efficiency of the property, making it more attractive to potential renters. ↑
ⓘ Cost ranges are severity-bucket heuristics (US national rule-of-thumb). Get contractor quotes + a written scope before underwriting a rehab budget.
Schools (NCES district)
No district data.
Livability — New York
- Score
- 75/100
- State rank
- #268
- US rank
- #4188
Category grades
Schools grade is shown separately in the Schools card above.
Census & demographics
- Census place
- New York, NY
- County
- Kings County · 2,614,986 people
- City population
- 7,731,280
- Metro
- New York-Newark-Jersey City, NY-NJ-PA
- Population (ZIP)
- 105,428
- Household income
- $62,077
- Rent vs Own
- Severe rent burden
- 7574.0
Population outlook (Kings County) Hauer SSP2
- Today (2025)
- 2,847,441 people
- By 2030
- 2,937,006 · +3.1%
- By 2040
- 3,095,491 · +8.7%
- By 2050
- 3,228,968 · +13.4%
- By 2075
- 3,321,723 · +16.7%
- By 2100
- 3,111,387 · +9.3%
Race, ethnicity, and origin ACS 2023
- Neighborhood character
- Diverse neighborhood (Simpson 0.66)
- Race & ethnicity
- Black 42% Hispanic / Latino 39% Asian 10% Two or more races 8% White 3%
- Hispanic origin (detail)
- Mexican 2% Puerto Rican 9% Dominican 16%
- Common ancestry
- Hispanic 1%
- Foreign-born
- 40% · Canada, China, Mexico
- Languages at home
- 48% English-only · Spanish 36% Other Indo-European 11% French/Haitian/Cajun 1%
Political lean MEDSL · Kings
- 2024 margin
- Solid D (+44.0) · D 72.0% · R 28.0%
- 2008→2024 swing
- -15.5pp toward R · 2008: 59.4pp · 2024: 44.0pp
- All cycles
- 2024: D+44.0 2020: D+54.8 2016: D+61.8 2012: D+63.9 2008: D+59.4
Not yet ingested
- Civics
- —
Market trends
- HPI YoY
- ▼ -546.38%
- Current HPI
- 376.1489
- Rent YoY
- ▲ 6.14%
- Metro
- New York-Newark-Jersey City, NY-NJ-PA
- State GDP YoY
- ▲ 2.60%
- F500 in state
- 92
Industry mix (Fortune 500 HQ in NY)
| Industry | F500 HQs | Revenue |
|---|---|---|
| Financial Services | 10 | $950B |
|
||
| Consumer Goods | 9 | $162B |
|
||
| Insurance | 4 | $225B |
|
||
| Telecommunications | 2 | $144B |
|
||
| Pharmaceuticals | 2 | $112B |
|
||
| Media / Entertainment | 2 | $69B |
|
||
Price history
1 event — show timeline
- 2026-06-03 Listed $1,199,000 OneKey® MLS as Distributed by MLS Grid
Cash-flow waterfall
monthlySold comps — $/sqft
last 12 mo · ≤1 miLoading sold comps…