 7-Plex
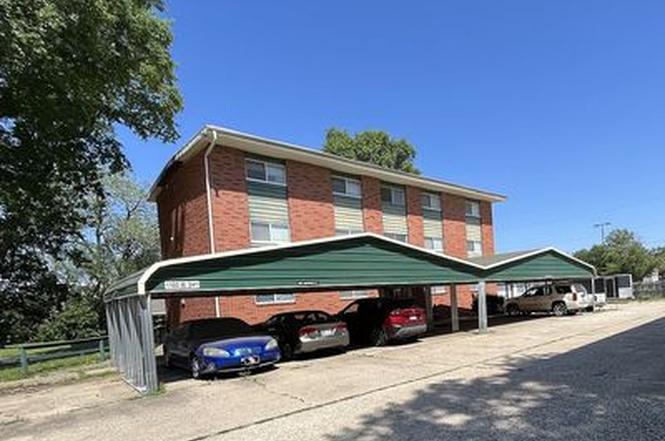
1102 W 24th St · Lawrence, KS
Flood risk 4/10 · Minor
- FEMA flood zone
- X (unshaded)
- Chance of flooding over 30 yrs
- 0.2%
- Est. flood insurance / yr
- $473 – $860
Fire risk 1/10 · Minimal
- Est. fire insurance / yr
- $1,154 – $2,142
Heat risk 5/10 · Moderate
- Hot days now (above 109°F)
- 7 days/yr
- Hot days in 30 yrs
- 16 days/yr
Wind risk 2/10 · Minimal
- Chance of severe wind over 30 yrs
- —
Air-quality risk 2/10 · Minimal
- Unhealthy air days now
- 2 days/yr
- Unhealthy air days in 30 yrs
- 2 days/yr
Risk factors via First Street. Map © Google.
Why this score? — see what drove the B grade
The composite is a weighted blend of 9 inputs, each scored 0–100. Each bar is that input's sub-score; the figure is the points it added to the 100-point composite (weight × sub-score).
- Cash flow +30.0/30.0
- 1% rule +10.0/10.0
- DSCR +10.0/10.0
- ARV discount +7.5/15.0
- Rent growth +4.8/5.0
- Livability +4.4/5.0
- Schools +3.2/10.0
- Condition / age +2.5/5.0
- Appreciation +0.0/10.0
$695,000
🖨 Deal sheet 📄 Offer letter ✓ Due diligence
Multi-family units
County records classify this as Multi-Family (5+ Unit). Listing-text estimate: 7 units. confirmed
5+ unit building — per-unit beds/baths from public records are typically unavailable; the breakdown below (if shown) is an estimate from the listing text.
Listing remarks
7-unit apartment complex. 6 units with 2 bedrooms and 1 bathroom 1 unit is a studio house Yearly income $70,080
Key facts
- Built 1964
- Listed 8 days
Neighborhood map
What this means for you Summary
Snapshot
- This is a 7 × 13-bed/7.0-bath units multifamily listed at $695k.
Deal economics
- At list price, monthly cash flow is $7k ($90k/yr) — positive. Per door: $1k/mo.
- The deal already cash-flows at list — no discount required.
- Meets the 1% rule at list price ($15k rent vs $695k).
- Cap rate 19.2% vs local median 2.7% in Lawrence — top-decile yield for the area; either an underpriced asset or a hidden risk that comps aren't pricing in. Stress-test before assuming the spread holds.
Location & tenants
- Location reads 88/100 on livability (#1 in KS, #237 nationally) — a professional / high-income tenant draw. Strengths: amenities A+, commute A+, cost of living A+; Watch: crime D-.
- Lawrence (urban): math 31% / reading 44% proficiency, ranked #46 of 169 in KS (top 27%) — families likely to look elsewhere, expect single-tenant / working-renter base with shorter leases.
- Market conditions: Rents rising fast (+9.4%/yr); 61 active listings in the ZIP; 246 units permitted in Douglas County in 2024 (38 in 5+ unit buildings).
- At $14,998/mo this rent would consume 275% of the median local household income ($65k/yr) (locally 1201% of renters already pay >50% of income on rent) — very limited rent-growth headroom before tenants either downsize or default.
Forward outlook
- Local home prices are declining (-3.0%/yr); year-one equity from $5k of loan paydown is wiped out by about $21k of value loss. Plan a longer hold.
- Douglas County population projected at +39% by 2050 — long-run rental-demand tailwind backs the buy-and-hold thesis.
- At projected returns (-3.0% appreciation + 8.0% rent growth), your $195k cash investment doubles in ~3 years — after that, you're playing with house money.
Negotiation context
- Only 9 days on market — expect competitive offers; lowballing is unlikely to land.
Risks & watch-outs
- Climate carrying-cost: extreme-heat days projected 7→16/yr by 2055 (HVAC capex compounding) — expect insurance premiums to compound above CPI over the hold.
Questions for the listing agent
- Can we see the unit-by-unit rent roll, current vacancy, and any below-market leases? What's the average tenancy length?
- What capital expenditures (roof, boiler, parking lot, exteriors) have been made in the last 5 years, and what's planned in the next 2?
- Built in 1964 — when were the roof, HVAC, electrical panel, plumbing, and water heater last replaced?
- Is there a deadline driving the sale (1031 exchange, divorce, estate, relocation)? That informs how much negotiation room exists.
- Crime grade is D in this area — have there been break-ins, vandalism, or insurance claims at this property in the last 3 years? What carrier currently insures it and at what premium?
- What's the average days-on-market for RENTAL listings here right now (not sales)? A rising rental-DOM trend means longer vacancies and softer asking-rent achievability than the comps imply.
- What's the recent tenant-quality profile in this submarket — average credit score on applications, eviction rate, late-payment / NSF rate, and stable-employment percentage? A property-management company in the area should have these aggregated.
- How much new apartment / multifamily construction is in the pipeline within 1–3 miles? Heavy new supply (>2% of stock underway) typically softens rents 12–24 months out; light construction supports rent growth.
Investment metrics
- 1% rule
- 2.16% ✓
- Cap rate
- 19.23%
- Cash-on-cash
- 46.19%
- DSCR
- 3.06
- GRM
- 3.9
CMA / ARV
No comps found within radius.
Projected returns pro-forma
-3.0% appreciation · 8.0% rent growth · sell at horizon
- IRR
- 48.8%
- Equity multiple
- 3.28×
- Total profit
- $443,657
- Equity at exit
- $103,627
- IRR
- 56.4%
- Equity multiple
- 7.99×
- Total profit
- $1,361,182
- Equity at exit
- $60,091
Cash invested: $194,600 (down + closing). Projections, not guarantees.
Landlord ↔ Tenant lean methodology
- Overall (STATE)
- 83 Strongly Landlord-Friendly
- State Kansas
- 83 Strongly Landlord-Friendly · R+10
- County
- — inherits STATE
- City
- — inherits STATE
ZIP-level market 66046
- Rents YoY
- 9.4%
- Active inventory
- 61
- Price-to-rent
- 27.0×
Monthly cashflow live
- Estimated rent
- $14,998 medium interval (Pro) →
- Mortgage (P&I)
- −$3,645
- Tax from tax record
- −$424 /mo · $5,086/yr
- Insurance
- −$290
- HOA
- −$0
- Vacancy / Maint / Mgmt
- −$3,150
- Net cashflow
- $7,490
Break-even live
7-unit breakdown (identical units grouped — click to expand)
| Units | Beds | Baths | Est. rent |
|---|---|---|---|
| 7× units | 13 | 7 | $15,001 |
| #1 | 13 | 7 | $2,143 |
| #2 | 13 | 7 | $2,143 |
| #3 | 13 | 7 | $2,143 |
| #4 | 13 | 7 | $2,143 |
| #5 | 13 | 7 | $2,143 |
| #6 | 13 | 7 | $2,143 |
| #7 | 13 | 7 | $2,143 |
| Total (7 units) | $14,998 | ||
UW: 25.0% down · 7.5% · 30yr · 1.5% tax · 5.0% vac · 8.0% maint · 8.0% mgmt
Financing live
Cash to close
- Down payment
- $173,750
- Closing costs
- $20,850
- Reserves months
- —
- Total cash needed
- —
Loan-product check · same deal, 3 products live
Conventional
25% down · 7.5% · 30yr
- Down + closing
- —
- Monthly P&I
- —
- Monthly cashflow
- —
- DSCR
- —
- Eligible?
- —
Personal DTI + credit; lowest rate.
DSCR
20% down · 8.5% · 30yr
- Down + closing
- —
- Monthly P&I
- —
- Monthly cashflow
- —
- DSCR
- —
- Eligible?
- —
No personal income docs; deal must DSCR.
Hard money
10% down · 12.0% · 12mo
- Down + closing
- —
- Monthly P&I
- —
- Monthly cashflow
- —
- DSCR
- —
- Eligible?
- —
Short-term bridge; refi at stabilization.
Listing history 8 events
-
2026-06-19days on market $695,000 Active 9 DOM
-
2026-06-18days on market $695,000 Active 8 DOM
-
2026-06-17days on market $695,000 Active 7 DOM
-
2026-06-16days on market $695,000 Active 6 DOM
-
2026-06-15days on market $695,000 Active 5 DOM
-
2026-06-14days on market $695,000 Active 3 DOM
-
2026-06-13remarks 111-char remark
-
2026-06-13$695,000 Active 2 DOM
ⓘ Source: listings_history table (triggers on properties + properties_extension) + one-shot
backfill from property_details.listing_events for pre-trigger history.
Tax reassessment forecast KS · Resets to sale price
- Current annual tax
- $5,086 · $424/mo
- Projected year-2 tax
- $9,800 · $817/mo
- Expected delta
- +$4,713/yr (+$393/mo · 92.7%)
ⓘ Screening estimate from a state-policy table — verify with the county assessor before closing.
Climate risk First Street
- Flood 4/10 Moderate FEMA zone X (unshaded) · 20% chance over 30 yrs
- Wildfire 1/10 Low
- Heat 5/10 Major 7 d/yr ≥109°F today · 16 d/yr by 30 yrs out
- Wind 2/10 Low
- Air quality 2/10 Low 2 unhealthy d/yr today · 2 by 30 yrs out
Nearby sold comps map
Loading sold comps map…
Walkable amenities ~0.75 mi
Loading nearby amenities…
Taxation est. · year 1
- Rental income
- $179,976
- − Mortgage interest
- −$38,931
- − Property taxes
- −$5,086
- − Insurance
- −$3,475
- − Repairs & maintenance
- −$14,398
- − Management
- −$14,398
- − Depreciation
- −$20,218
- Taxable income
- $83,470
- Est. tax owed @ 24.0%
- −$20,033
- After-tax cash flow
- $69,851/yr
For passive investors: Depreciation is non-cash, so a rental often shows a tax loss while cash-flowing — sheltering income. Rental losses are passive: they offset passive income freely, and up to $25,000/yr can offset ordinary (W-2) income if you actively participate and your MAGI is under $100k (phasing out to $0 by $150k); unused losses carry forward. On sale, claimed depreciation is recaptured at up to 25%, and gains may owe capital-gains tax (a 1031 exchange can defer both). Figures are a year-1 estimate at your 24.0% rate — not tax advice; consult a CPA.
Schools (NCES district)
- District
- Lawrence
- NCES district ID
- 2008400
- Math proficiency
- 31% ▼ -7.00%
- Reading proficiency
- 44% ▬ 0.00%
- Median HH income
- $46,259
- Composite
- 32.02/100
- National rank
- #5826
- State rank
- #46 of 169 in KS
Livability — Lawrence
- Score
- 88/100
- State rank
- #1
- US rank
- #237
Category grades
Schools grade is shown separately in the Schools card above.
Census & demographics
- Census place
- Lawrence, KS
- County
- Douglas County · 100,966 people
- City population
- 100,966
- Metro
- Lawrence, KS
- Population (ZIP)
- 19,658
- Household income
- $65,478
- Rent vs Own
- Severe rent burden
- 1201.0
Population outlook (Douglas County) Hauer SSP2
- Today (2025)
- 136,863 people
- By 2030
- 147,255 · +7.6%
- By 2040
- 167,760 · +22.6%
- By 2050
- 190,593 · +39.3%
- By 2075
- 253,850 · +85.5%
- By 2100
- 314,741 · +130.0%
Race, ethnicity, and origin ACS 2023
- Neighborhood character
- Predominantly White (68%)
- Race & ethnicity
- White 68% Two or more races 10% Asian 9% Hispanic / Latino 7% Black 6% Native American 3%
- Hispanic origin (detail)
- Mexican 5%
- Common ancestry
- Slovak 3% Iranian 3% Italian 2%
- Foreign-born
- 11% · China, Canada, Vietnam
- Languages at home
- 85% English-only · Chinese 4% Spanish 3% Other Asian/Pacific 2%
Political lean MEDSL · Douglas
- 2024 margin
- Solid D (+38.0) · D 68.2% · R 30.2% · Other 1.6%
- 2008→2024 swing
- +7.2pp toward D · 2008: 30.8pp · 2024: 38.0pp
- All cycles
- 2024: D+38.0 2020: D+39.5 2016: D+32.7 2012: D+23.7 2008: D+30.8
Not yet ingested
- Civics
- —
Market trends
- HPI YoY
- ▼ -246.73%
- Current HPI
- 236.534
- Rent YoY
- ▲ 9.36%
- Metro
- Lawrence, KS
- State GDP YoY
- —
- F500 in state
- 0
Price history
4 events — show timeline
- 2026-06-11 Listed $695,000 FSBO.com
- 2023-08-31 Sold (Public Records) — Public Records
- 2012-03-06 Sold (Public Records) — Public Records
- 1998-11-10 Sold (Public Records) — Public Records
Property tax history
+3.8%/yrLatest (2025): $5,086 · +8.0% YoY. Source: county tax records.
Cash-flow waterfall
monthlySold comps — $/sqft
last 12 mo · ≤1 miLoading sold comps…