2 Kaseberg · Roseville, CA
Flood risk 1/10 · Minimal
- FEMA flood zone
- X (unshaded)
- Chance of flooding over 30 yrs
- 0.0%
- Est. flood insurance / yr
- $507 – $1,088
Fire risk 5/10 · Moderate
- Est. fire insurance / yr
- $659 – $1,223
Heat risk 7/10 · Major
- Hot days now (above 104°F)
- 7 days/yr
- Hot days in 30 yrs
- 16 days/yr
Wind risk 1/10 · Minimal
- Chance of severe wind over 30 yrs
- —
Air-quality risk 10/10 · Severe
- Unhealthy air days now
- 33 days/yr
- Unhealthy air days in 30 yrs
- 37 days/yr
Risk factors via First Street. Map © Google.
Why this score? — see what drove the B+ grade
The composite is a weighted blend of 9 inputs, each scored 0–100. Each bar is that input's sub-score; the figure is the points it added to the 100-point composite (weight × sub-score).
- Cash flow +30.0/30.0
- ARV discount +11.0/15.0
- 1% rule +10.0/10.0
- DSCR +10.0/10.0
- Schools +5.1/10.0
- Livability +3.9/5.0
- Rent growth +2.9/5.0
- Condition / age +2.5/5.0
- Appreciation +0.0/10.0
$189,900
🖨 Deal sheet 📄 Offer letter ✓ Due diligence
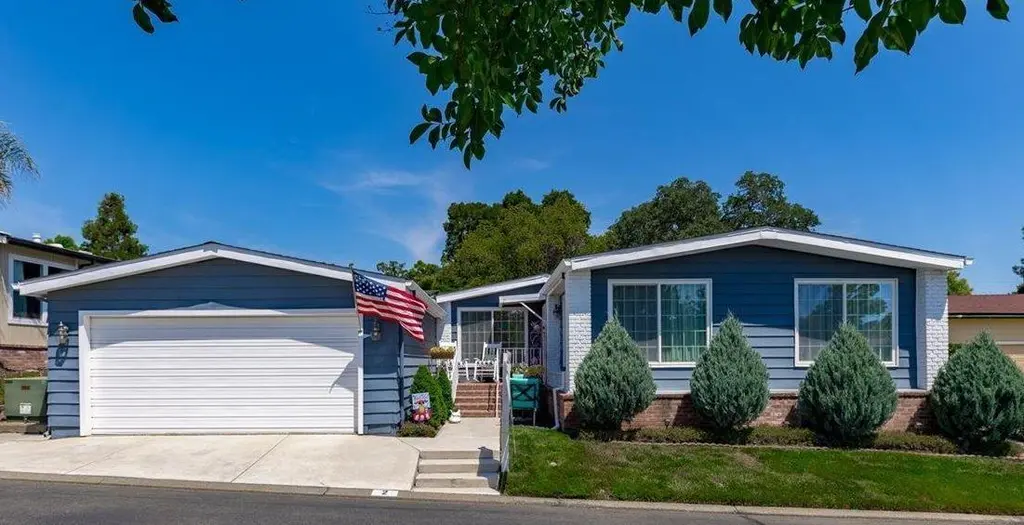
Listing remarks
Welcome to the highly sought-after Senior Community of Diamond K Estates in West Roseville. This beautiful triple-wide home is the largest model in the community and offers exceptional space and comfort. Diamond K Estates is also the only senior community in the area featuring two-car garages. This well-maintained home features three spacious bedrooms, including a large primary suite with a walk-in closet. The home offers both a generous family room and a separate living room, providing plenty of space for relaxing or entertaining guests. Step inside and discover a true buyer's delight, showcasing pride of ownership and thoughtful care throughout. Diamond K Estates is an active senior commu
Key facts
- Olympic-size pool
- Clubhouse
- Living room
Tags
Property features AI
Finance
- Financial info: Land lease: No (note: a land lease amount field is present but not included per instructions)
- HOA & community: No homeowners association; Senior community
Exterior
- Parking: Boat storage available; Garage door opener; Guest parking available
- Security: No specific security features listed
- Utilities: Public water; Public sewer; Cable available; Internet available; Gas plumbed with individual gas meter; 220V in kitchen and in laundry
- Home design: Manufactured home in park; Triple-wide; Built in 1979; Golden West / Country Estates manufacturer
- Construction: Composition roof; Skirting: aluminum and wood
- Exterior features: Auto sprinkler front and rear
Interior
- Kitchen: Breakfast area; Pantry cabinet; Ceramic countertops
- Bedrooms: 3 bedrooms
- Flooring: Carpet; Laminate
- Bathrooms: 2 full bathrooms; Tub with shower over; Shower stall(s)
- Heating & cooling: Central heating; Central cooling; Ceiling fan(s); Fireplace heating (decorative electric)
- Interior features: Cathedral/vaulted living room ceiling; One decorative electric fireplace in the living room; Carpeted and covered/enclosed deck/patio area; Pets allowed
- Laundry & utility: Washer and dryer included; Gas hookup in laundry; Laundry located inside
Neighborhood map
What this means for you Summary
Snapshot
- This is a 3-bed/2.0-bath manufactured listed at $190k.
Deal economics
- At list price, monthly cash flow is $1k ($12k/yr) — positive.
- The deal already cash-flows at list — no discount required.
- Meets the 1% rule at list price ($3k rent vs $190k).
- Recommended offer: $179k (6.0% below list) — sets the bar for market timing.
- Cap rate 12.7% vs local median 2.8% in Roseville — top-decile yield for the area; either an underpriced asset or a hidden risk that comps aren't pricing in. Stress-test before assuming the spread holds.
Location & tenants
- Location reads 77/100 on livability (#90 in CA, #3,239 nationally) — a middle-class / working-renter tenant base. Strengths: commute A+, employment A+, housing A+; Watch: cost of living F.
- Roseville Joint Union High (urban): math 42% / reading 71% proficiency, ranked #86 of 517 in CA (top 17%) — acceptable for families but not a draw, mixed tenant base, ~2y average lease.
- Market conditions: Rents rising (+1.8%/yr); 167 active listings in the ZIP; 13 comparable units currently listed for rent nearby; rentals leasing fast (median 7d on market — plan ~1-2 weeks tenant-placement turnaround); solid renter incomes; 3,535 units permitted in Placer County in 2024 (689 in 5+ unit buildings).
- This rent runs 35% of the median local income ($101k/yr) — at the standard rent-burdened threshold; future hikes will face affordability resistance.
Forward outlook
- Local home prices are declining (-3.0%/yr); year-one equity from $1k of loan paydown is wiped out by about $6k of value loss. Plan a longer hold.
- Placer County population projected at +20% by 2050 — long-run rental-demand tailwind backs the buy-and-hold thesis.
- At projected returns (-3.0% appreciation + 1.8% rent growth), your $53k cash investment doubles in ~6 years — after that, you're playing with house money.
Negotiation context
- It's been on market 63 days — a 6% lower offer ($179k) is reasonable based on typical stale-listing flexibility.
Risks & watch-outs
- Climate carrying-cost: moderate wildfire risk; extreme-heat days projected 7→16/yr by 2055 (HVAC capex compounding) — expect insurance premiums to compound above CPI over the hold.
Questions for the listing agent
- It's been on market 63 days. Have you received any prior offers? Is the seller open to a 6% concession, seller financing, or rate buy-down credit?
- Built in 1979 — when were the roof, HVAC, electrical panel, plumbing, and water heater last replaced?
- Why hasn't it sold? Are there any deal-killer items the seller is aware of (foundation, flood, title, zoning, code violations)?
- Is there a deadline driving the sale (1031 exchange, divorce, estate, relocation)? That informs how much negotiation room exists.
- Schools are B-rated — typically a magnet for longer-tenancy family renters. What's the average tenant stay here, and is there a school-zone premium baked into asking?
- What's the average days-on-market for RENTAL listings here right now (not sales)? A rising rental-DOM trend means longer vacancies and softer asking-rent achievability than the comps imply.
- What's the recent tenant-quality profile in this submarket — average credit score on applications, eviction rate, late-payment / NSF rate, and stable-employment percentage? A property-management company in the area should have these aggregated.
- How much new for-sale + rental construction is in the pipeline within 1–3 miles? Heavy new supply typically softens prices + rents 12–24 months out; constrained supply supports both.
Investment metrics
- 1% rule
- 1.55% ✓
- Cap rate
- 12.69%
- Cash-on-cash
- 22.85%
- DSCR
- 2.02
- GRM
- 5.4
CMA / ARV
- ARV (on-the-fly)
- $206,000
- Comps found
- 7
Show comp detail 7 sales within ~0.75 mi
| Address | Dist | Beds/Ba | Sqft | Sold | Price | $/sf | Match |
|---|---|---|---|---|---|---|---|
| 116 Kaseberg Dr | 0.17mi | 2/2.0 (-1) | 2,160 (+8%) | 1mo | $175,000 | $81 | 73 |
| 27 Hancock Dr | 0.15mi | 2/2.0 (-1) | 1,790 (-10%) | 0mo | $189,000 | $106 | 70 |
| 144 Kaseberg Dr | 0.20mi | 2/2.0 (-1) | 1,788 (-11%) | 8mo | $153,000 | $86 | 61 |
| 255 Kirkwood Dr | 0.35mi | 3/2.5 | 1,760 (-12%) | 2mo | $134,500 | $76 | 60 |
| 290 Lafayette | 0.15mi | 2/2.0 (-1) | 1,708 (-15%) | 5mo | $175,900 | $103 | 59 |
| 128 Kaseberg Dr | 0.28mi | 3/2.5 | 1,840 (-8%) | 17mo | $215,500 | $117 | 58 |
| 140 Kaseberg Dr | 0.24mi | 2/2.0 (-1) | 2,108 (+5%) | 21mo | $235,000 | $111 | 58 |
Match score weights: distance 35% · size 25% · config 20% · recency 20%. Top-matched comps best support the ARV.
Projected returns pro-forma
-3.0% appreciation · 1.75% rent growth · sell at horizon
- IRR
- 14.4%
- Equity multiple
- 1.57×
- Total profit
- $30,095
- Equity at exit
- $28,315
- IRR
- 22.2%
- Equity multiple
- 2.78×
- Total profit
- $94,784
- Equity at exit
- $16,419
Cash invested: $53,172 (down + closing). Projections, not guarantees.
Landlord ↔ Tenant lean methodology
- Overall (STATE)
- 18 Strongly Tenant-Friendly
- State California
- 18 Strongly Tenant-Friendly · D+13
- County
- — inherits STATE
- City
- — inherits STATE
ZIP-level market 95678
- Rents YoY
- 1.8%
- Active inventory
- 167
- Price-to-rent
- 5.4×
Monthly cashflow live
- Estimated rent
- $2,943 high interval (Pro) →
- Mortgage (P&I)
- −$996
- Tax est. 1.5%
- −$237 /mo · $2,848/yr
- Insurance
- −$79
- HOA
- −$0
- Vacancy / Maint / Mgmt
- −$618
- Net cashflow
- $1,012
Break-even live
UW: 25.0% down · 7.5% · 30yr · 1.5% tax · 5.0% vac · 8.0% maint · 8.0% mgmt
Financing live
Cash to close
- Down payment
- $47,475
- Closing costs
- $5,697
- Reserves months
- —
- Total cash needed
- —
Loan-product check · same deal, 3 products live
Conventional
25% down · 7.5% · 30yr
- Down + closing
- —
- Monthly P&I
- —
- Monthly cashflow
- —
- DSCR
- —
- Eligible?
- —
Personal DTI + credit; lowest rate.
DSCR
20% down · 8.5% · 30yr
- Down + closing
- —
- Monthly P&I
- —
- Monthly cashflow
- —
- DSCR
- —
- Eligible?
- —
No personal income docs; deal must DSCR.
Hard money
10% down · 12.0% · 12mo
- Down + closing
- —
- Monthly P&I
- —
- Monthly cashflow
- —
- DSCR
- —
- Eligible?
- —
Short-term bridge; refi at stabilization.
Rent comps 13 comps
| Address | Beds | Baths | Sqft | Rent | $/sqft | DOM | Units | Dist |
|---|---|---|---|---|---|---|---|---|
| 304 Diamond Oaks Rd Roseville, CA | 3.0 | 2.0 | 2116 | $3,200 | $1.51 | 10d | 1 | 0.49mi |
| 1317 Rice Ln Roseville, CA | 3.0 | 2.0 | 1442 | $2,395 | $1.66 | 1d | 1 | 0.54mi |
| 1243 S Bluff Dr Roseville, CA | 3.0 | 2.0 | 1433 | $2,795 | $1.95 | 21d | 1 | 0.54mi |
| 317 Aspen Ct Roseville, CA | 3.0 | 2.0 | 1744 | $3,200 | $1.83 | 1d | 1 | 0.57mi |
| 409 Washington Blvd Roseville, CA | 3.0 | 2.0 | 2000 | $1,995 | $1.00 | 1d | 1 | 1.03mi |
| 2301 Aldridge Ln Roseville, CA | 4.0 | 3.0 | 2310 | $3,100 | $1.34 | 16d | 1 | 1.13mi |
| 1422 Lorimer Way Roseville, CA | 4.0 | 2.0 | 1650 | $2,795 | $1.69 | 1d | 1 | 1.22mi |
| 523 Cascade Dr Roseville, CA | 4.0 | 3.0 | 2616 | $3,395 | $1.30 | 14d | 1 | 1.25mi |
| 412 Avila Dr Roseville, CA | 3.0 | 3.0 | 1839 | $2,900 | $1.58 | 1d | 1 | 1.29mi |
| 201 Sapphire Ct Roseville, CA | 3.0 | 3.0 | 1488 | $2,750 | $1.85 | 19d | 1 | 1.31mi |
| 129 Vernon St Apt 403 Roseville, CA | 2.0 | 2.0 | 2112 | $4,500 | $2.13 | 7d | 1 | 1.41mi |
| 120 Ivy St Roseville, CA | 3.0 | 2.5 | 1525 | $2,595 | $1.70 | 1d | 1 | 1.41mi |
| 174 Talmont Cir Roseville, CA | 3.0 | 3.0 | 1526 | $2,749 | $1.80 | 14d | 1 | 1.45mi |
Climate risk First Street
- Flood 1/10 Low FEMA zone X (unshaded) · 0% chance over 30 yrs
- Wildfire 5/10 Major
- Heat 7/10 Severe 7 d/yr ≥104°F today · 16 d/yr by 30 yrs out
- Wind 1/10 Low
- Air quality 10/10 Extreme 33 unhealthy d/yr today · 37 by 30 yrs out
Nearby sold comps map
Loading sold comps map…
Walkable amenities ~0.75 mi
Loading nearby amenities…
Taxation est. · year 1
- Rental income
- $35,312
- − Mortgage interest
- −$10,637
- − Property taxes
- −$2,848
- − Insurance
- −$950
- − Repairs & maintenance
- −$2,825
- − Management
- −$2,825
- − Depreciation
- −$5,524
- Taxable income
- $9,702
- Est. tax owed @ 24.0%
- −$2,329
- After-tax cash flow
- $9,820/yr
For passive investors: Depreciation is non-cash, so a rental often shows a tax loss while cash-flowing — sheltering income. Rental losses are passive: they offset passive income freely, and up to $25,000/yr can offset ordinary (W-2) income if you actively participate and your MAGI is under $100k (phasing out to $0 by $150k); unused losses carry forward. On sale, claimed depreciation is recaptured at up to 25%, and gains may owe capital-gains tax (a 1031 exchange can defer both). Figures are a year-1 estimate at your 24.0% rate — not tax advice; consult a CPA.
Schools (NCES district)
- District
- Roseville Joint Union High
- NCES district ID
- 0633630
- Math proficiency
- 42% ▼ -6.00%
- Reading proficiency
- 71% ▼ -3.00%
- Median HH income
- $81,930
- Composite
- 51.11/100
- National rank
- #1763
- State rank
- #86 of 517 in CA
Livability — Roseville
- Score
- 77/100
- State rank
- #90
- US rank
- #3239
Category grades
Schools grade is shown separately in the Schools card above.
Census & demographics
- Census place
- Roseville, CA
- County
- Placer County · 390,510 people
- City population
- 161,837
- Metro
- Sacramento-Roseville-Folsom, CA
- Population (ZIP)
- 45,346
- Household income
- $100,554
- Rent vs Own
- Severe rent burden
- 2544.0
Population outlook (Placer County) Hauer SSP2
- Today (2025)
- 422,709 people
- By 2030
- 444,249 · +5.1%
- By 2040
- 480,192 · +13.6%
- By 2050
- 506,390 · +19.8%
- By 2075
- 550,219 · +30.2%
- By 2100
- 547,760 · +29.6%
Race, ethnicity, and origin ACS 2023
- Neighborhood character
- Diverse neighborhood (Simpson 0.58)
- Race & ethnicity
- White 60% Hispanic / Latino 23% Two or more races 17% Asian 8% Black 2%
- Hispanic origin (detail)
- Mexican 16% Puerto Rican 1%
- Common ancestry
- Russian 3% Slovak 2% Italian 2%
- Foreign-born
- 14% · Canada, China, South Korea
- Languages at home
- 79% English-only · Spanish 10% Other Indo-European 4% Russian/Polish/Slavic 2%
Political lean MEDSL · Placer
- 2024 margin
- Lean R (+8.5) · D 44.3% · R 52.8% · Other 2.9%
- 2008→2024 swing
- +2.8pp toward D · 2008: -11.3pp · 2024: -8.5pp
- All cycles
- 2024: R+8.5 2020: R+6.7 2016: R+11.3 2012: R+20.1 2008: R+11.3
Not yet ingested
- Civics
- —
Market trends
- HPI YoY
- ▼ -418.46%
- Current HPI
- 272.0182
- Rent YoY
- ▲ 1.75%
- Metro
- Sacramento-Roseville-Folsom, CA
- State GDP YoY
- ▲ 3.21%
- F500 in state
- 116
Industry mix (Fortune 500 HQ in CA)
| Industry | F500 HQs | Revenue |
|---|---|---|
| Technology | 27 | $1,492B |
|
||
| Financial Services | 3 | $174B |
|
||
| Retail | 3 | $44B |
|
||
| Insurance | 3 | $26B |
|
||
| Media / Entertainment | 2 | $115B |
|
||
| Pharmaceuticals / Biotech | 2 | $62B |
|
||
Cash-flow waterfall
monthlySold comps — $/sqft
last 12 mo · ≤1 miLoading sold comps…