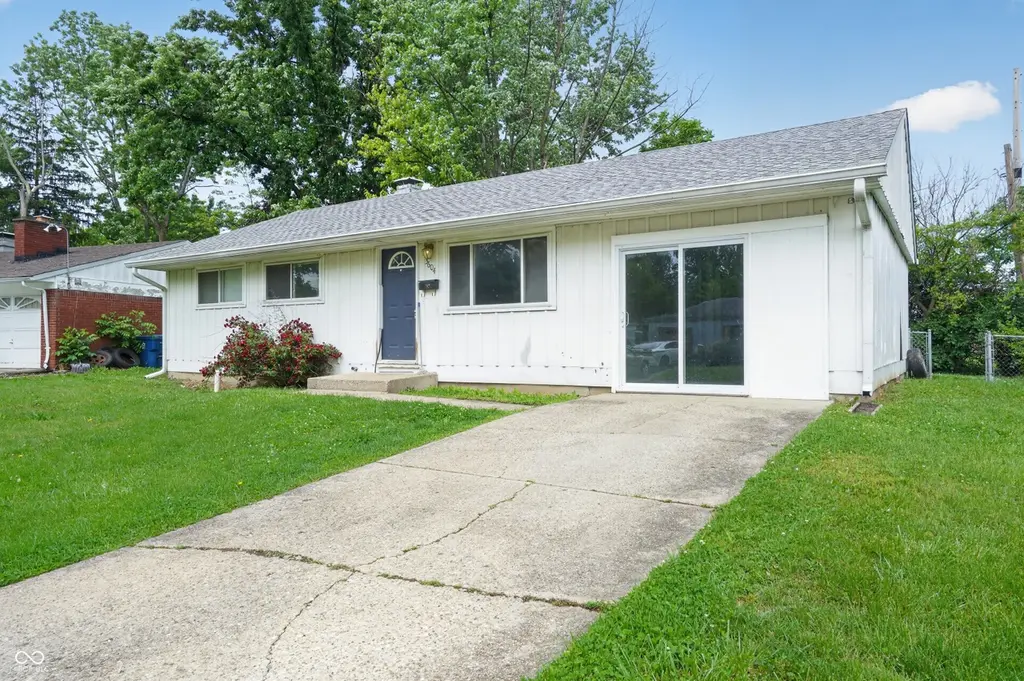
3604 Biscayne Rd · Indianapolis city (balance), IN
Flood risk 1/10 · Minimal
- FEMA flood zone
- X (unshaded)
- Chance of flooding over 30 yrs
- 0.0%
- Est. flood insurance / yr
- $507 – $1,088
Fire risk 1/10 · Minimal
- Est. fire insurance / yr
- $717 – $1,331
Heat risk 3/10 · Minor
- Hot days now (above 101°F)
- 7 days/yr
- Hot days in 30 yrs
- 18 days/yr
Wind risk 2/10 · Minimal
- Chance of severe wind over 30 yrs
- 1.0%
Air-quality risk 3/10 · Minor
- Unhealthy air days now
- 3 days/yr
- Unhealthy air days in 30 yrs
- 4 days/yr
Risk factors via First Street. Map © Google.
Why this score? — see what drove the C grade
The composite is a weighted blend of 9 inputs, each scored 0–100. Each bar is that input's sub-score; the figure is the points it added to the 100-point composite (weight × sub-score).
- Cash flow +19.9/30.0
- ARV discount +15.0/15.0
- DSCR +6.3/10.0
- 1% rule +5.6/10.0
- Rent growth +4.2/5.0
- Livability +2.5/5.0
- Condition / age +2.5/5.0
- Schools +1.4/10.0
- Appreciation +0.0/10.0
$134,900
🖨 Deal sheet 📄 Offer letter ✓ Due diligence
Listing remarks MLS
Incredible amount of space in this 3 bedroom home with living room and family room PLUS basement. You will be surprised at the excellent condition of this 3 bedroom home. In addition there is a full basement with tons of storage shelfing already in place. The laundry room is in the basement but still plenty of space for workout room or game table.
Key facts
- Functional kitchen
- Garage conversion
- Private patio
Tags
Property features AI
Finance
- Other: Lot size about 0.14 acre (less than 1/4 acre); Converted garage noted in directions
Exterior
- Parking: Paver block parking
- Security: Smoke detectors
- Utilities: Public water; Municipal sewer connected; Natural gas connected; 200+ amp electric service; Solid waste service available
- Home design: Single-family residence; Updated/remodeled condition; One level; Faces west
- Construction: Brick and vinyl siding exterior; Full foundation
- Exterior features: Covered patio/porch; Storage shed; City lot with curbs, sidewalks, street lights and storm sewer; Mature trees
Interior
- Kitchen: Dishwasher; Electric oven; Refrigerator; Range hood
- Bedrooms: Three bedrooms on the main level (one is 10 x 10, one is 11 x 10, one listed as 10 x 10)
- Bathrooms: One full bath and one half bath on the main level
- Interior features: Supplemental storage; Full basement with exterior entry
- Laundry & utility: Laundry located in the basement
Neighborhood map
What this means for you Summary
Snapshot
- This is a 3-bed/1.5-bath single-family listed at $135k.
Deal economics
- At list price, monthly cash flow is $163 ($2k/yr) — positive.
- The deal already cash-flows at list — no discount required.
- Meets the 1% rule at list price ($1k rent vs $135k).
- Recommended offer: $133k (1.5% below list) — sets the bar for market timing.
- Cap rate 7.7% vs local median 4.4% in Indianapolis city (balance) — top-decile yield for the area; either an underpriced asset or a hidden risk that comps aren't pricing in. Stress-test before assuming the spread holds.
Location & tenants
- Location reads: area grade C — affects rentability + tenant quality, not the cash-flow math above.
- Indianapolis Public Schools (urban): math 14% / reading 20% proficiency, ranked #286 of 301 in IN (top 95%) — low school quality limits family demand, transient renter base, plan for 1-2y turnover; 77% free/reduced lunch — lower-income household profile, screen leases tightly.
- Market conditions: Rents rising fast (+6.8%/yr); 151 active listings in the ZIP; 39 comparable units currently listed for rent nearby; rentals at typical pace (median 18d on market — plan ~3-4 weeks tenant-placement turnaround); 1,906 units permitted in Marion County in 2024 (621 in 5+ unit buildings).
- This rent runs 34% of the median local income ($50k/yr) — at the standard rent-burdened threshold; future hikes will face affordability resistance.
Forward outlook
- Local home prices are declining (-3.0%/yr); year-one equity from $933 of loan paydown is wiped out by about $4k of value loss. Plan a longer hold.
- Marion County population projected at +18% by 2050 — long-run rental-demand tailwind backs the buy-and-hold thesis.
- At projected returns (-3.0% appreciation + 6.8% rent growth), your $38k cash investment doubles in ~10 years — after that, you're playing with house money.
Negotiation context
- It's been on market 20 days — a 2% lower offer ($133k) is reasonable based on typical stale-listing flexibility.
- 4 sale attempts since 12y ago with the ask held roughly flat each time — persistent listings suggest the price (not the market) is what's stuck; bring a comps-based counter.
- Current owner paid $60k; list at $135k implies a 125% gain — meaningful room to come down on a strong offer.
Questions for the listing agent
- Built in 1960 — when were the roof, HVAC, electrical panel, plumbing, and water heater last replaced?
- Is there a deadline driving the sale (1031 exchange, divorce, estate, relocation)? That informs how much negotiation room exists.
- What's the average days-on-market for RENTAL listings here right now (not sales)? A rising rental-DOM trend means longer vacancies and softer asking-rent achievability than the comps imply.
- What's the recent tenant-quality profile in this submarket — average credit score on applications, eviction rate, late-payment / NSF rate, and stable-employment percentage? A property-management company in the area should have these aggregated.
- How much new for-sale + rental construction is in the pipeline within 1–3 miles? Heavy new supply typically softens prices + rents 12–24 months out; constrained supply supports both.
Investment metrics
- 1% rule
- 1.06% ✓
- Cap rate
- 7.74%
- Cash-on-cash
- 5.18%
- DSCR
- 1.23
- GRM
- 7.8
CMA / ARV
- ARV (on-the-fly)
- $164,052
- Comps found
- 12
Show comp detail 12 sales within ~0.75 mi
| Address | Dist | Beds/Ba | Sqft | Sold | Price | $/sf | Match |
|---|---|---|---|---|---|---|---|
| 3856 Catalina Ct | 0.37mi | 3/1.0 | 1,344 (+2%) | 3mo | $135,000 | $100 | 76 |
| 9048 E 36th St | 0.33mi | 3/1.0 | 1,311 (-1%) | 7mo | $130,000 | $99 | 75 |
| 3710 Chateau Ct | 0.23mi | 3/1.5 | 1,421 (+7%) | 6mo | $110,000 | $77 | 72 |
| 8540 E 37th Pl | 0.25mi | 3/1.5 | 1,421 (+7%) | 7mo | $179,000 | $126 | 70 |
| 3444 Hermosa Ct | 0.55mi | 3/1.5 | 1,262 (-5%) | 3mo | $145,000 | $115 | 65 |
| 3647 Richelieu Rd | 0.28mi | 4/1.5 (+1) | 1,421 (+7%) | 7mo | $155,000 | $109 | 64 |
| 4040 Aspen Way | 0.66mi | 3/1.0 | 1,344 (+2%) | 1mo | $147,000 | $109 | 63 |
| 3851 Marseille Rd | 0.38mi | 3/1.5 | 1,183 (-11%) | 4mo | $185,000 | $156 | 61 |
| 9036 E 36th St | 0.30mi | 4/2.0 (+1) | 1,458 (+10%) | 6mo | $210,000 | $144 | 57 |
| 3980 Richelieu Rd | 0.54mi | 3/1.5 | 1,456 (+10%) | 9mo | $180,000 | $124 | 51 |
| 8445 Montery Rd | 0.59mi | 4/1.5 (+1) | 1,473 (+11%) | 2mo | $198,000 | $134 | 48 |
| 4138 Balboa Dr | 0.70mi | 4/2.0 (+1) | 1,149 (-13%) | 8mo | $150,000 | $131 | 32 |
Match score weights: distance 35% · size 25% · config 20% · recency 20%. Top-matched comps best support the ARV.
Projected returns pro-forma
-3.0% appreciation · 6.76% rent growth · sell at horizon
- IRR
- -3.9%
- Equity multiple
- 0.85×
- Total profit
- $-5,812
- Equity at exit
- $20,114
- IRR
- 9.7%
- Equity multiple
- 1.89×
- Total profit
- $33,437
- Equity at exit
- $11,664
Cash invested: $37,772 (down + closing). Projections, not guarantees.
Landlord ↔ Tenant lean methodology
- Overall (STATE)
- 90 Strongly Landlord-Friendly
- State Indiana
- 90 Strongly Landlord-Friendly · R+11
- County
- — inherits STATE
- City
- — inherits STATE
ZIP-level market 46226
- Rents YoY
- 6.8%
- Active inventory
- 151
- Price-to-rent
- 7.8×
Monthly cashflow live
- Estimated rent
- $1,434 high interval (Pro) →
- Mortgage (P&I)
- −$707
- Tax from tax record
- −$206 /mo · $2,473/yr
- Insurance
- −$56
- HOA
- −$0
- Vacancy / Maint / Mgmt
- −$301
- Net cashflow
- $163
Break-even live
UW: 25.0% down · 7.5% · 30yr · 1.5% tax · 5.0% vac · 8.0% maint · 8.0% mgmt
Financing live
Cash to close
- Down payment
- $33,725
- Closing costs
- $4,047
- Reserves months
- —
- Total cash needed
- —
Loan-product check · same deal, 3 products live
Conventional
25% down · 7.5% · 30yr
- Down + closing
- —
- Monthly P&I
- —
- Monthly cashflow
- —
- DSCR
- —
- Eligible?
- —
Personal DTI + credit; lowest rate.
DSCR
20% down · 8.5% · 30yr
- Down + closing
- —
- Monthly P&I
- —
- Monthly cashflow
- —
- DSCR
- —
- Eligible?
- —
No personal income docs; deal must DSCR.
Hard money
10% down · 12.0% · 12mo
- Down + closing
- —
- Monthly P&I
- —
- Monthly cashflow
- —
- DSCR
- —
- Eligible?
- —
Short-term bridge; refi at stabilization.
Rent comps 39 comps
| Address | Beds | Baths | Sqft | Rent | $/sqft | DOM | Units | Dist |
|---|---|---|---|---|---|---|---|---|
| 3540 Dubarry Ct Indianapolis, IN | 3.0 | 2.0 | 1297 | $1,400 | $1.08 | 23d | 1 | 0.06mi |
| 3631 Decamp Dr Indianapolis, IN | 3.0 | 1.0 | 1000 | $1,335 | $1.33 | 23d | 1 | 0.11mi |
| 3809 Biscayne Rd Indianapolis, IN | 2.0 | 1.5 | 992 | $1,020 | $1.03 | 14d | 1 | 0.31mi |
| 3815 Biscayne Rd Indianapolis, IN | 3.0 | 1.5 | 1188 | $1,220 | $1.03 | 14d | 1 | 0.32mi |
| 3821 Biscayne Rd Indianapolis, IN | 4.0 | 1.5 | 1188 | $1,325 | $1.12 | 14d | 1 | 0.34mi |
| 3823 Biscayne Rd Indianapolis, IN | 4.0 | 1.5 | 1188 | $1,320 | $1.11 | 14d | 1 | 0.34mi |
| 3829 Biscayne Rd Indianapolis, IN | 4.0 | 1.5 | 1188 | $1,320 | $1.11 | 14d | 1 | 0.36mi |
| 3938 Biscayne Rd Indianapolis, IN | 3.0 | 1.0 | 1000 | $1,895 | $1.90 | 2d | 1 | 0.48mi |
| 8862 Bel Air Ct Indianapolis, IN | 3.0 | 1.0 | 1073 | $1,264 | $1.18 | 17d | 1 | 0.48mi |
| 9226 E 36th Pl Indianapolis, IN | 3.0 | 1.0 | 1073 | $1,250 | $1.16 | 7d | 1 | 0.50mi |
| 8203 Penway St Indianapolis, IN | 3.0 | 1.5 | 1360 | $1,500 | $1.10 | 23d | 1 | 0.50mi |
| 3644 Celtic Dr Indianapolis, IN | 4.0 | 1.5 | 1637 | $1,500 | $0.92 | 14d | 1 | 0.51mi |
| 8738 Montery Rd Indianapolis, IN | 3.0 | 1.0 | 1421 | $1,396 | $0.98 | 7d | 1 | 0.59mi |
| 8724 Montery Rd Indianapolis, IN | 3.0 | 1.0 | 925 | $1,500 | $1.62 | 43d | 1 | 0.59mi |
| 8914 Elmonte Dr Indianapolis, IN | 3.0 | 1.5 | 1500 | $1,600 | $1.07 | 23d | 1 | 0.61mi |
| 3722 Ireland Dr Indianapolis, IN | 3.0 | 2.0 | 1682 | $1,700 | $1.01 | 43d | 1 | 0.62mi |
| 9060 E 39th Pl Indianapolis, IN | 1.0–2.0 | 1.0–1.5 | 820 | $1,040 | $1.27 | 23d | 1 | 0.62mi |
| 3525 Luewan Ct Indianapolis, IN | 4.0 | 1.0 | 1107 | $1,750 | $1.58 | 23d | 1 | 0.65mi |
| 3747 Ireland Dr Indianapolis, IN | 4.0 | 1.5 | 1400 | $1,700 | $1.21 | 23d | 1 | 0.66mi |
| 3519 Jerome Ct Indianapolis, IN | 4.0 | 1.0 | 1107 | $1,995 | $1.80 | 23d | 1 | 0.70mi |
| 3513 Roseway Dr Indianapolis, IN | 3.0 | 2.0 | 1216 | $1,600 | $1.32 | 17d | 1 | 0.71mi |
| 7937 E 34th St Indianapolis, IN | 4.0 | 1.0 | 1450 | $2,000 | $1.38 | 23d | 1 | 0.76mi |
| 7925 Crossbridge Dr Indianapolis, IN | 2.0 | 2.0 | 1072 | $1,200 | $1.12 | 43d | 1 | 0.86mi |
| 7838 Ridgewood Dr Indianapolis, IN | 3.0 | 2.0 | 936 | $1,540 | $1.65 | 43d | 1 | 0.88mi |
| 7838 Ridgewood Dr Indianapolis, IN | 3.0 | 2.0 | 936 | $1,540 | $1.65 | 23d | 1 | 0.89mi |
| 8501 Athens Ct Indianapolis, IN | 4.0 | 1.0 | 1225 | $1,475 | $1.20 | 14d | 1 | 0.91mi |
| 9513 Baker Ct Indianapolis, IN | 4.0 | 2.0 | 1702 | $1,825 | $1.07 | 7d | 1 | 0.92mi |
| 9438 Conried Dr Indianapolis, IN | 3.0 | 1.0 | 1094 | $1,445 | $1.32 | 4d | 1 | 0.93mi |
| 3226 Wellington Ave Indianapolis, IN | 3.0 | 1.0 | 900 | $1,149 | $1.28 | 10d | 1 | 0.97mi |
| 4315 Aspen Way Indianapolis, IN | 3.0 | 1.0 | 1080 | $1,380 | $1.28 | 43d | 1 | 0.98mi |
| 8254 Meadowlark Dr Indianapolis, IN | 3.0 | 1.5 | 1320 | $1,150 | $0.87 | 21d | 1 | 1.06mi |
| 8254 Meadowlark Dr Unit 1 Indianapolis, IN | 3.0 | 1.5 | 1320 | $1,150 | $0.87 | 43d | 1 | 1.06mi |
| 7531 Penway St Indianapolis, IN | 3.0 | 1.5 | 1237 | $1,551 | $1.25 | 7d | 1 | 1.12mi |
| 3962 Strathmore Dr Indianapolis, IN | 3.0 | 1.0 | 925 | $1,250 | $1.35 | 23d | 1 | 1.15mi |
| 9962 Catalina Dr Indianapolis, IN | 3.0 | 1.0 | 1236 | $1,600 | $1.29 | 3d | 1 | 1.22mi |
| 9949 Ellis Dr Indianapolis, IN | 4.0 | 2.0 | 1421 | $1,580 | $1.11 | 2d | 1 | 1.34mi |
| 9634 Meadowlark Dr Indianapolis, IN | 3.0 | 1.5 | 1546 | $1,550 | $1.00 | 16d | 1 | 1.35mi |
| 7845 Bonita Ct Indianapolis, IN | 3.0 | 1.0 | 1073 | $1,400 | $1.30 | 7d | 1 | 1.43mi |
| 7910 Roy Rd Indianapolis, IN | 3.0 | 1.0 | 1073 | $1,445 | $1.35 | 23d | 1 | 1.43mi |
Listing history 13 events
-
2026-06-18days on market $134,900 Active 20 DOM
-
2026-06-17days on market $134,900 Active 19 DOM
-
2026-06-16days on market $134,900 Active 18 DOM
-
2026-06-15days on market $134,900 Active 17 DOM
-
2026-06-13days on market $134,900 Active 15 DOM
-
2026-06-13days on market $134,900 Active 14 DOM
-
2026-06-09days on market $134,900 Active 11 DOM
-
2026-06-08days on market $134,900 Active 10 DOM
-
2026-06-07days on market $134,900 Active 9 DOM
-
2026-06-03days on market $134,900 Active 5 DOM
-
2026-06-02days on market $134,900 Active 4 DOM
-
2026-06-01days on market $134,900 Active 3 DOM
-
2026-05-31days on market $134,900 Active 2 DOM
ⓘ Source: listings_history table (triggers on properties + properties_extension) + one-shot
backfill from property_details.listing_events for pre-trigger history.
Tax reassessment forecast IN · Partial reset (capped growth)
- Current annual tax
- $2,473 · $206/mo
- Projected year-2 tax
- $2,473 · $206/mo
- Expected delta
- $0/yr ($0/mo · 0.0%)
ⓘ Screening estimate from a state-policy table — verify with the county assessor before closing.
Climate risk First Street
- Flood 1/10 Low FEMA zone X (unshaded) · 0% chance over 30 yrs
- Wildfire 1/10 Low
- Heat 3/10 Moderate 7 d/yr ≥101°F today · 18 d/yr by 30 yrs out
- Wind 2/10 Low 100% chance of damaging wind over 30 yrs
- Air quality 3/10 Moderate 3 unhealthy d/yr today · 4 by 30 yrs out
Nearby sold comps map
Loading sold comps map…
Walkable amenities ~0.75 mi
Loading nearby amenities…
Taxation est. · year 1
- Rental income
- $17,204
- − Mortgage interest
- −$7,556
- − Property taxes
- −$2,473
- − Insurance
- −$674
- − Repairs & maintenance
- −$1,376
- − Management
- −$1,376
- − Depreciation
- −$3,924
- Taxable loss
- −$177
- Est. tax savings @ 24.0%
- +$42
- After-tax cash flow
- $1,997/yr
For passive investors: Depreciation is non-cash, so a rental often shows a tax loss while cash-flowing — sheltering income. Rental losses are passive: they offset passive income freely, and up to $25,000/yr can offset ordinary (W-2) income if you actively participate and your MAGI is under $100k (phasing out to $0 by $150k); unused losses carry forward. On sale, claimed depreciation is recaptured at up to 25%, and gains may owe capital-gains tax (a 1031 exchange can defer both). Figures are a year-1 estimate at your 24.0% rate — not tax advice; consult a CPA.
Schools (NCES district)
- District
- Indianapolis Public Schools
- NCES district ID
- 1804770
- Math proficiency
- 14% ▼ -7.00%
- Reading proficiency
- 20% ▼ -3.00%
- Median HH income
- $32,034
- Composite
- 13.69/100
- National rank
- #9499
- State rank
- #286 of 301 in IN
Livability — Indianapolis city (balance)
No livability data for this city. (Only ~50 U.S. cities are tracked.)
Census & demographics
- Census place
- Indianapolis city (balance), IN
- County
- Marion County · 998,460 people
- City population
- 881,119
- Metro
- Indianapolis-Carmel-Anderson, IN
- Population (ZIP)
- 47,099
- Household income
- $50,325
- Rent vs Own
- Severe rent burden
- 2742.0
Population outlook (Marion County) Hauer SSP2
- Today (2025)
- 1,025,572 people
- By 2030
- 1,065,727 · +3.9%
- By 2040
- 1,141,577 · +11.3%
- By 2050
- 1,208,920 · +17.9%
- By 2075
- 1,367,288 · +33.3%
- By 2100
- 1,438,201 · +40.2%
Race, ethnicity, and origin ACS 2023
- Neighborhood character
- Diverse neighborhood (Simpson 0.62)
- Race & ethnicity
- Black 53% White 25% Hispanic / Latino 17% Two or more races 9% Asian 2%
- Hispanic origin (detail)
- Mexican 11%
- Common ancestry
- Lithuanian 1% Italian 1% Romanian 1%
- Foreign-born
- 11% · Canada
- Languages at home
- 86% English-only · Spanish 10% French/Haitian/Cajun 1% Other Asian/Pacific 1%
Political lean MEDSL · Marion
- 2024 margin
- Strong D (+27.7) · D 63.0% · R 35.3% · Other 1.7%
- 2008→2024 swing
- -0.7pp no change · 2008: 28.4pp · 2024: 27.7pp
- All cycles
- 2024: D+27.7 2020: D+29.1 2016: D+22.8 2012: D+22.2 2008: D+28.4
Not yet ingested
- Civics
- —
Market trends
- HPI YoY
- ▼ -218.85%
- Current HPI
- 239.43
- Rent YoY
- ▲ 6.76%
- Metro
- Indianapolis-Carmel-Anderson, IN
- State GDP YoY
- ▲ 2.90%
- F500 in state
- 18
Industry mix (Fortune 500 HQ in IN)
| Industry | F500 HQs | Revenue |
|---|---|---|
| Industrial Machinery | 2 | $37B |
|
||
| Healthcare | 1 | $177B |
|
||
| Pharmaceuticals | 1 | $45B |
|
||
| Metals / Steel | 1 | $18B |
|
||
| Agriculture | 1 | $17B |
|
||
| Packaging | 1 | $12B |
|
||
Price history
+124.8% since first listed12 events — show timeline
- 2026-05-29 Listed $134,900 MIBOR as Distributed by MLS Grid
- 2019-01-10 Sold (Public Records) $60,000 Public Records
- 2019-01-02 Sold (MLS) $60,000 MIBOR as Distributed by MLS Grid
- 2018-12-20 Pending — MIBOR as Distributed by MLS Grid
- 2018-12-11 Price Changed $64,900 MIBOR as Distributed by MLS Grid
- 2018-11-29 Price Changed $67,500 MIBOR as Distributed by MLS Grid
- 2018-11-20 Listed $69,900 MIBOR as Distributed by MLS Grid
- 2015-07-22 Listing Removed — MIBOR as Distributed by MLS Grid
- 2015-06-10 Relisted — MIBOR as Distributed by MLS Grid
- 2015-04-30 Contingent — MIBOR as Distributed by MLS Grid
- 2015-03-04 Price Changed $55,000 MIBOR as Distributed by MLS Grid
- 2014-07-18 Listed $60,000 MIBOR as Distributed by MLS Grid
Property tax history
+8.4%/yrLatest (2025): $2,473 · +25.0% YoY. Source: county tax records.
Cash-flow waterfall
monthlySold comps — $/sqft
last 12 mo · ≤1 miLoading sold comps…