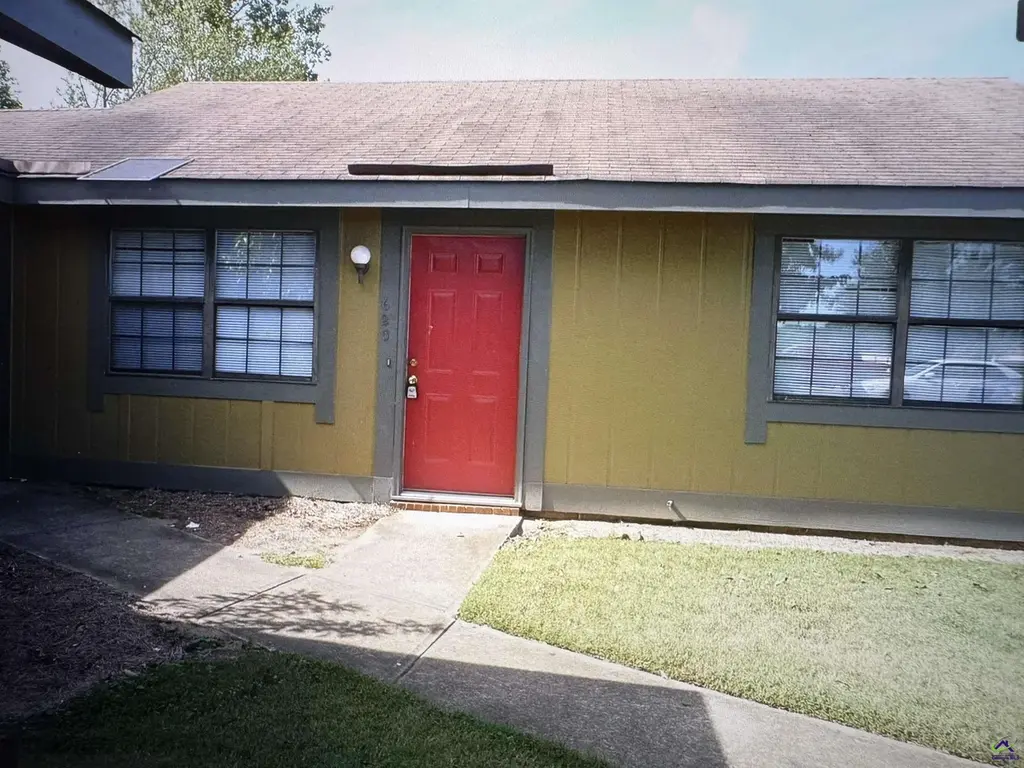
620 Gawin Dr · Warner Robins, GA
Flood risk 1/10 · Minimal
- FEMA flood zone
- X (unshaded)
- Chance of flooding over 30 yrs
- 0.0%
- Est. flood insurance / yr
- $507 – $1,088
Fire risk 4/10 · Minor
- Est. fire insurance / yr
- $963 – $1,789
Heat risk 7/10 · Major
- Hot days now (above 107°F)
- 7 days/yr
- Hot days in 30 yrs
- 19 days/yr
Wind risk 6/10 · Moderate
- Chance of severe wind over 30 yrs
- 67.0%
Air-quality risk 3/10 · Minor
- Unhealthy air days now
- 2 days/yr
- Unhealthy air days in 30 yrs
- 4 days/yr
Risk factors via First Street. Map © Google.
Why this score? — see what drove the C+ grade
The composite is a weighted blend of 9 inputs, each scored 0–100. Each bar is that input's sub-score; the figure is the points it added to the 100-point composite (weight × sub-score).
- Cash flow +27.5/30.0
- DSCR +9.6/10.0
- ARV discount +7.5/15.0
- 1% rule +6.7/10.0
- Schools +3.9/10.0
- Rent growth +3.2/5.0
- Livability +3.2/5.0
- Condition / age +2.5/5.0
- Appreciation +0.0/10.0
$98,000
🖨 Deal sheet 📄 Offer letter ✓ Due diligence
Listing remarks MLS
Cute 2 br, 1 bath condo. Great for owner occupant or as investment property. Condo fee covers exterior maintenance, lawn care and water bill. Call today for a private Tour!!
Key facts
- Washer dryer
- New appliances
- Fenced in back yard
Tags
Property features AI
Finance
- HOA & community: Homeowners association with annual fee
Exterior
- Parking: Detached 2-car garage; 2 covered parking spaces (2 total parking spaces)
- Utilities: Public water; Public sewer
- Home design: Single-family residence; One story
- Construction: 900 above-grade finished square feet
- Exterior features: 29-acre lot
Interior
- Kitchen: Electric range, dishwasher, refrigerator
- Bathrooms: 1 full bathroom and 1 half bathroom
- Heating & cooling: Central heating; Central air conditioning
- Interior features: Electric range, dishwasher, refrigerator
- Laundry & utility: Laundry room
Neighborhood map
What this means for you Summary
Snapshot
- This is a 2-bed/1.0-bath condo listed at $98k.
Deal economics
- At list price, monthly cash flow is $289 ($3k/yr) — positive.
- The deal already cash-flows at list — no discount required.
- Meets the 1% rule at list price ($1k rent vs $98k).
- Recommended offer: $97k (1.5% below list) — sets the bar for market timing.
- Cap rate 9.8% vs local median 4.9% in Warner Robins — top-decile yield for the area; either an underpriced asset or a hidden risk that comps aren't pricing in. Stress-test before assuming the spread holds.
Location & tenants
- Location reads 65/100 on livability (#227 in GA) — a middle-class / working-renter tenant base. Strengths: cost of living A+, housing A+, health & safety A+; Watch: employment D+, crime F, amenities F.
- Houston County (urban): math 43% / reading 46% proficiency, ranked #23 of 174 in GA (top 13%) — families likely to look elsewhere, expect single-tenant / working-renter base with shorter leases.
- Zoned schools: Parkwood Elementary School (math 21% / reading 18%, grade F, #878 of 1,228 statewide, top 75%, 671 students, 84% FRL); Northside Middle School (math 29% / reading 31%, grade F, #243 of 470 statewide, top 53%, 844 students, 84% FRL); Northside High School (math 5% / reading 21%, grade F, #331 of 424 statewide, top 78%, 1,959 students, 84% FRL) — zoned schools average 84% FRL vs 46% district-wide (38 pts higher); higher-poverty schools than district average — tighter screening recommended.
- Zoned-school proficiency averages 21% at this address vs 44% district-wide (-24 pts) — the specific schools serving this property underperform the Houston County average; the district grade overstates school quality for this exact location.
- Market conditions: Rents rising (+2.8%/yr); 161 active listings in the ZIP; 18 comparable units currently listed for rent nearby; rentals at typical pace (median 21d on market — plan ~3-4 weeks tenant-placement turnaround); 44% of comp listings sitting > 30 days — soft ceiling on asking rent; 1,545 units permitted in Houston County in 2024 (336 in 5+ unit buildings).
Forward outlook
- Local home prices are declining (-3.0%/yr); year-one equity from $678 of loan paydown is wiped out by about $3k of value loss. Plan a longer hold.
- Houston County population projected at +22% by 2050 — long-run rental-demand tailwind backs the buy-and-hold thesis.
- At projected returns (-3.0% appreciation + 2.8% rent growth), your $27k cash investment doubles in ~10 years — after that, you're playing with house money.
Negotiation context
- It's been on market 15 days — a 2% lower offer ($97k) is reasonable based on typical stale-listing flexibility.
- 4 sale attempts since 9y ago with the ask held roughly flat each time — persistent listings suggest the price (not the market) is what's stuck; bring a comps-based counter.
- Current owner paid $31k; list at $98k implies a 216% gain — meaningful room to come down on a strong offer.
Risks & watch-outs
- Climate carrying-cost: major wind risk, 67% chance of damaging wind over 30y; extreme-heat days projected 7→19/yr by 2055 (HVAC capex compounding) — expect insurance premiums to compound above CPI over the hold.
Questions for the listing agent
- What does the HOA fee cover, when was the last increase, and are there any pending special assessments or reserve-fund shortfalls?
- Any open or pending special assessments — roof, HVAC, plumbing, elevator, façade? What's the per-unit balance and payoff schedule, and is the seller paying it off at close or rolling it to the buyer?
- Is there a deadline driving the sale (1031 exchange, divorce, estate, relocation)? That informs how much negotiation room exists.
- Schools are D-rated, which usually means shorter tenancies and higher turnover. Who's the typical renter profile here, and what's been the actual vacancy rate?
- Crime grade is F in this area — have there been break-ins, vandalism, or insurance claims at this property in the last 3 years? What carrier currently insures it and at what premium?
- What's the average days-on-market for RENTAL listings here right now (not sales)? A rising rental-DOM trend means longer vacancies and softer asking-rent achievability than the comps imply.
- What's the recent tenant-quality profile in this submarket — average credit score on applications, eviction rate, late-payment / NSF rate, and stable-employment percentage? A property-management company in the area should have these aggregated.
- How much new apartment / multifamily construction is in the pipeline within 1–3 miles? Heavy new supply (>2% of stock underway) typically softens rents 12–24 months out; light construction supports rent growth.
Investment metrics
- 1% rule
- 1.17% ✓
- Cap rate
- 9.83%
- Cash-on-cash
- 12.62%
- DSCR
- 1.56
- GRM
- 7.1
CMA / ARV
No comps found within radius.
Projected returns pro-forma
-3.0% appreciation · 2.78% rent growth · sell at horizon
- IRR
- 2.1%
- Equity multiple
- 1.08×
- Total profit
- $2,230
- Equity at exit
- $14,612
- IRR
- 11.5%
- Equity multiple
- 1.89×
- Total profit
- $24,498
- Equity at exit
- $8,473
Cash invested: $27,440 (down + closing). Projections, not guarantees.
Landlord ↔ Tenant lean methodology
- Overall (STATE)
- 90 Strongly Landlord-Friendly
- State Georgia
- 90 Strongly Landlord-Friendly · R+3
- County
- — inherits STATE
- City
- — inherits STATE
ZIP-level market 31093
- Rents YoY
- 2.8%
- Active inventory
- 161
- Price-to-rent
- 7.1×
Monthly cashflow live
- Estimated rent
- $1,146 high interval (Pro) →
- Mortgage (P&I)
- −$514
- Tax from tax record
- −$52 /mo · $625/yr
- Insurance
- −$41
- HOA est. from 1 same-building comp
- −$10
- Vacancy / Maint / Mgmt
- −$241
- Net cashflow
- $289
Break-even live
UW: 25.0% down · 7.5% · 30yr · 1.5% tax · 5.0% vac · 8.0% maint · 8.0% mgmt
Financing live
Cash to close
- Down payment
- $24,500
- Closing costs
- $2,940
- Reserves months
- —
- Total cash needed
- —
Loan-product check · same deal, 3 products live
Conventional
25% down · 7.5% · 30yr
- Down + closing
- —
- Monthly P&I
- —
- Monthly cashflow
- —
- DSCR
- —
- Eligible?
- —
Personal DTI + credit; lowest rate.
DSCR
20% down · 8.5% · 30yr
- Down + closing
- —
- Monthly P&I
- —
- Monthly cashflow
- —
- DSCR
- —
- Eligible?
- —
No personal income docs; deal must DSCR.
Hard money
10% down · 12.0% · 12mo
- Down + closing
- —
- Monthly P&I
- —
- Monthly cashflow
- —
- DSCR
- —
- Eligible?
- —
Short-term bridge; refi at stabilization.
Rent comps 18 comps
| Address | Beds | Baths | Sqft | Rent | $/sqft | DOM | Units | Dist |
|---|---|---|---|---|---|---|---|---|
| 646 Gawin Dr Warner Robins, GA | 2.0 | 1.5 | 1050 | $1,025 | $0.98 | 43d | 1 | 0.06mi |
| 613 Greenbriar Rd Warner Robins, GA | 1.0–2.0 | 1.0 | 712 | $925 | $1.30 | 13d | 7 | 0.35mi |
| 206 Northlake Dr Warner Robins, GA | 1.0–3.0 | 1.0–2.0 | 942 | $1,058 | $1.12 | 13d | 10 | 0.44mi |
| 310 Northlake Dr Warner Robins, GA | 1.0–2.0 | 1.0–1.5 | 825 | $1,250 | $1.52 | 13d | 23 | 0.57mi |
| 1005 Elberta Rd Warner Robins, GA | 1.0–2.0 | 1.0 | 620 | $1,045 | $1.68 | 43d | 19 | 0.69mi |
| 114 Dixie Trl Warner Robins, GA | 3.0 | 2.0 | 980 | $1,250 | $1.28 | 20d | 1 | 0.70mi |
| 318 Bruce St Warner Robins, GA | 3.0 | 1.0 | 960 | $1,150 | $1.20 | 43d | 1 | 0.95mi |
| 724 N Houston Rd Warner Robins, GA | 1.0 | 1.0 | 680 | $765 | $1.12 | 43d | 1 | 0.98mi |
| 302 Hawaii Ave Unit C Warner Robins, GA | 2.0 | 1.0 | 981 | $1,200 | $1.22 | 13d | 1 | 1.01mi |
| 600 Arizona Ave Warner Robins, GA | 1.0–3.0 | 1.0–1.5 | 912 | $975 | $1.07 | 13d | 29 | 1.05mi |
| 319 Orchard Ln Warner Robins, GA | 3.0 | 1.0 | 950 | $1,400 | $1.47 | 43d | 1 | 1.08mi |
| 111 Marilyn Dr Warner Robins, GA | 3.0 | 1.0 | 912 | $1,250 | $1.37 | 43d | 1 | 1.14mi |
| 111 Marilyn Dr Warner Robins, GA | 3.0 | 1.0 | 912 | $1,175 | $1.29 | 20d | 1 | 1.14mi |
| 705 American Blvd Warner Robins, GA | 3.0 | 2.0 | 1100 | $1,275 | $1.16 | 13d | 1 | 1.22mi |
| 650 American Blvd Warner Robins, GA | 3.0 | 1.0 | 925 | $1,200 | $1.30 | 20d | 1 | 1.26mi |
| 213 Johns Rd Warner Robins, GA | 2.0 | 1.0 | 888 | $1,175 | $1.32 | 13d | 1 | 1.30mi |
| 119 Keith Dr Warner Robins, GA | 3.0 | 2.0 | 1122 | $1,175 | $1.05 | 43d | 1 | 1.41mi |
| 210 Woodcrest Cir Warner Robins, GA | 2.0 | 2.0 | 823 | $1,250 | $1.52 | 43d | 1 | 1.48mi |
HOA detail condo
- Monthly dues
- $0 · $0/yr
- Likely covers
- waterlandscapingexterior maint.
- Assessments
- None detected in remarks — confirm with the listing agent.
Listing history 13 events
-
2026-06-19days on market $98,000 Active 15 DOM
-
2026-06-18days on market $98,000 Active 14 DOM
-
2026-06-17days on market $98,000 Active 13 DOM
-
2026-06-16days on market $98,000 Active 12 DOM
-
2026-06-15days on market $98,000 Active 11 DOM
-
2026-06-14days on market $98,000 Active 9 DOM
-
2026-06-13days on market $98,000 Active 8 DOM
-
2026-06-10days on market $98,000 Active 6 DOM
-
2026-06-09days on market $98,000 Active 5 DOM
-
2026-06-08days on market $98,000 Active 4 DOM
-
2026-06-07days on market $98,000 Active 3 DOM
-
2026-06-05remarks 401-char remark
-
2026-06-05$98,000 Active 1 DOM
ⓘ Source: listings_history table (triggers on properties + properties_extension) + one-shot
backfill from property_details.listing_events for pre-trigger history.
Tax reassessment forecast GA · Resets to sale price
- Current annual tax
- $625 · $52/mo
- Projected year-2 tax
- $902 · $75/mo
- Expected delta
- +$276/yr (+$23/mo · 44.2%)
ⓘ Screening estimate from a state-policy table — verify with the county assessor before closing.
Climate risk First Street
- Flood 1/10 Low FEMA zone X (unshaded) · 0% chance over 30 yrs
- Wildfire 4/10 Moderate
- Heat 7/10 Severe 7 d/yr ≥107°F today · 19 d/yr by 30 yrs out
- Wind 6/10 Major 67% chance of damaging wind over 30 yrs
- Air quality 3/10 Moderate 2 unhealthy d/yr today · 4 by 30 yrs out
Nearby sold comps map
Loading sold comps map…
Walkable amenities ~0.75 mi
Loading nearby amenities…
Taxation est. · year 1
- Rental income
- $13,754
- − Mortgage interest
- −$5,490
- − Property taxes
- −$625
- − Insurance
- −$490
- − Repairs & maintenance
- −$1,100
- − Management
- −$1,100
- − HOA
- −$120
- − Depreciation
- −$2,851
- Taxable income
- $1,978
- Est. tax owed @ 24.0%
- −$475
- After-tax cash flow
- $2,989/yr
For passive investors: Depreciation is non-cash, so a rental often shows a tax loss while cash-flowing — sheltering income. Rental losses are passive: they offset passive income freely, and up to $25,000/yr can offset ordinary (W-2) income if you actively participate and your MAGI is under $100k (phasing out to $0 by $150k); unused losses carry forward. On sale, claimed depreciation is recaptured at up to 25%, and gains may owe capital-gains tax (a 1031 exchange can defer both). Figures are a year-1 estimate at your 24.0% rate — not tax advice; consult a CPA.
Schools (NCES district)
- District
- Houston County
- NCES district ID
- 1302880
- Math proficiency
- 43% ▼ -7.00%
- Reading proficiency
- 46% ▼ -2.00%
- Median HH income
- $54,823
- Composite
- 38.68/100
- National rank
- #4144
- State rank
- #23 of 174 in GA
Livability — Warner Robins
- Score
- 65/100
- State rank
- #227
- US rank
- #13290
Category grades
Schools grade is shown separately in the Schools card above.
Census & demographics
- Census place
- Warner Robins, GA
- County
- Houston County · 157,321 people
- City population
- 92,102
- Metro
- Warner Robins, GA
- Population (ZIP)
- 26,872
- Household income
- $45,991
- Rent vs Own
- Severe rent burden
- 1516.0
Population outlook (Houston County) Hauer SSP2
- Today (2025)
- 169,502 people
- By 2030
- 178,486 · +5.3%
- By 2040
- 194,642 · +14.8%
- By 2050
- 207,119 · +22.2%
- By 2075
- 231,480 · +36.6%
- By 2100
- 235,034 · +38.7%
Race, ethnicity, and origin ACS 2023
- Neighborhood character
- Diverse neighborhood (Simpson 0.64)
- Race & ethnicity
- Black 47% White 35% Hispanic / Latino 10% Two or more races 7% Asian 1%
- Hispanic origin (detail)
- Mexican 5%
- Common ancestry
- Iranian 1% Serbian 1% Italian 1%
- Foreign-born
- 6% · Canada, Vietnam, South Korea
- Languages at home
- 91% English-only · Spanish 8%
Political lean MEDSL · Houston
- 2024 margin
- R (+11.3) · D 44.0% · R 55.3%
- 2008→2024 swing
- +8.9pp toward D · 2008: -20.2pp · 2024: -11.3pp
- All cycles
- 2024: R+11.3 2020: R+12.4 2016: R+21.6 2012: R+20.7 2008: R+20.2
Not yet ingested
- Civics
- —
Market trends
- HPI YoY
- ▼ -130.35%
- Current HPI
- 222.1627
- Rent YoY
- ▲ 2.78%
- Metro
- Warner Robins, GA
- State GDP YoY
- ▲ 2.66%
- F500 in state
- 28
Industry mix (Fortune 500 HQ in GA)
| Industry | F500 HQs | Revenue |
|---|---|---|
| Paper / Packaging | 2 | $29B |
|
||
| Retail | 1 | $160B |
|
||
| Transportation / Logistics | 1 | $91B |
|
||
| Airlines | 1 | $62B |
|
||
| Consumer Goods | 1 | $47B |
|
||
| Utilities | 1 | $25B |
|
||
Price history
+118.3% since first listed8 events — show timeline
- 2026-06-04 Listed $98,000 CGMLS
- 2023-07-27 Rental Removed $975 GAMLS
- 2023-07-27 Listed for Rent $975 GAMLS
- 2019-10-24 Sold (Public Records) $31,000 Public Records
- 2019-10-16 Sold (MLS) $31,000 CGMLS
- 2019-06-18 Listed $39,900 CGMLS
- 2017-09-06 Sold (MLS) $41,850 CGMLS
- 2017-08-18 Listed $44,900 CGMLS
Property tax history
+8.7%/yrLatest (2025): $625 · +8.3% YoY. Source: county tax records.
Cash-flow waterfall
monthlySold comps — $/sqft
last 12 mo · ≤1 miLoading sold comps…