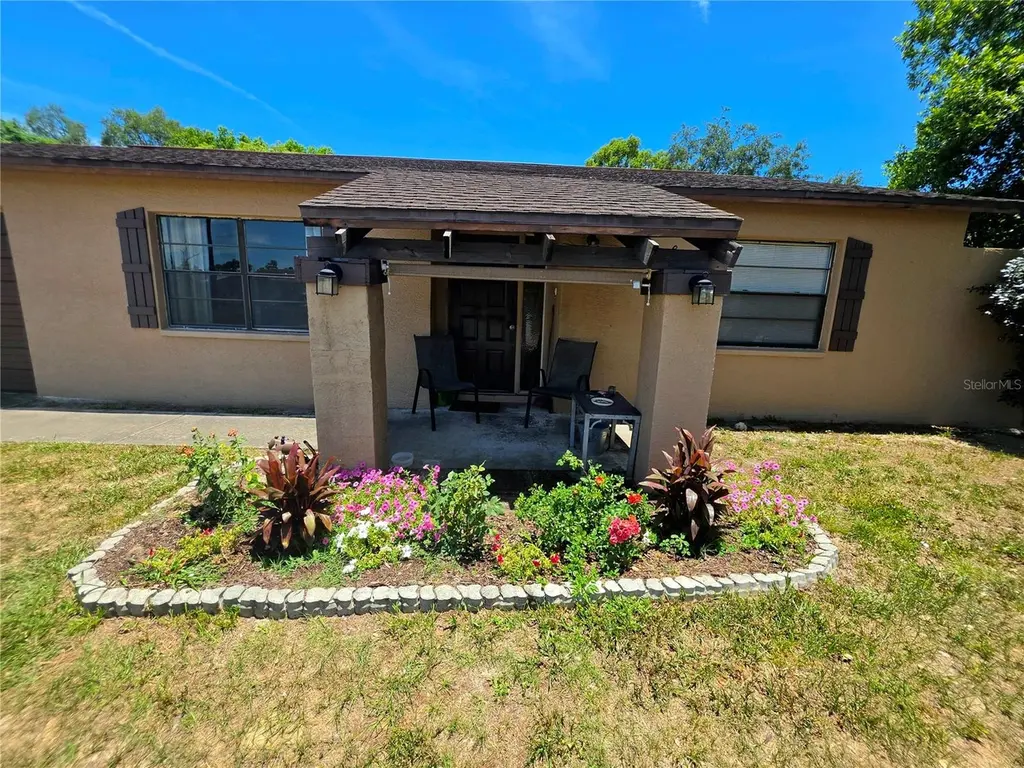
6402 Covewood Dr · Spring Hill, FL
Flood risk 3/10 · Minor
- FEMA flood zone
- X (unshaded)
- Chance of flooding over 30 yrs
- 0.2%
- Est. flood insurance / yr
- $507 – $1,088
Fire risk 5/10 · Moderate
- Est. fire insurance / yr
- $947 – $1,759
Heat risk 10/10 · Severe
- Hot days now (above 110°F)
- 7 days/yr
- Hot days in 30 yrs
- 26 days/yr
Wind risk 9/10 · Severe
- Chance of severe wind over 30 yrs
- 99.0%
Air-quality risk 2/10 · Minimal
- Unhealthy air days now
- 2 days/yr
- Unhealthy air days in 30 yrs
- 2 days/yr
Risk factors via First Street. Map © Google.
Why this score? — see what drove the D+ grade
The composite is a weighted blend of 9 inputs, each scored 0–100. Each bar is that input's sub-score; the figure is the points it added to the 100-point composite (weight × sub-score).
- Cash flow +19.5/30.0
- ARV discount +7.7/15.0
- DSCR +6.2/10.0
- 1% rule +4.4/10.0
- Schools +4.2/10.0
- Livability +3.2/5.0
- Condition / age +2.5/5.0
- Rent growth +1.3/5.0
- Appreciation +0.0/10.0
$250,000
🖨 Deal sheet 📄 Offer letter ✓ Due diligence
Listing remarks
Conveniently located in the heart of Spring Hill, this well-maintained fully fenced block home offers flexibility, comfort, and easy access to everything you need. Featuring 2 bedrooms, 1 bathroom, and 1,038 square feet of living space, the home includes a converted garage currently serving as a third bedroom, providing additional space for guests, a home office, hobby room, or growing household. The conversion can easily be returned to a one-car garage if desired. Situated on a spacious 0.20-acre lot, you'll enjoy room to relax, entertain, garden, or store your outdoor equipment. Major updates include a newer A/C installed in 2022 for added peace of mind. Location is key, and this property
Key facts
- Converted garage
- Newer a/c
- Spacious lot
Tags
Property features AI
Finance
- Other: Homestead exemption indicated
- Financial info: No lease restrictions reported
- HOA & community: No secondary association reported
Exterior
- Parking: Attached garage (1 car)
- Security: Security system
- Utilities: Public water; Septic tank; Electricity available; Cable available; Phone available; Fiber optics available; Broadband/high-speed internet available
- Home design: Single family residence; One story; Faces west; Residential property
- Construction: Block and stucco construction; Shingle roof; Slab foundation; Built on 0.23-acre lot
- Exterior features: Private mailbox; Asphalt road access; Street lights in community
Interior
- Kitchen: Range; Range hood; Microwave; Refrigerator
- Bedrooms: 2 bedrooms (one level)
- Flooring: Carpet; Laminate
- Bathrooms: 1 full bathroom
- Heating & cooling: Central heating; Central air
- Interior features: Ceiling fans; Thermostat; Walk-in closet(s); Security system
- Laundry & utility: Washer hookup; Dryer hookup (electric); Laundry room inside
Neighborhood map
What this means for you Summary
Snapshot
- This is a 2-bed/1.0-bath single-family listed at $250k.
Deal economics
- At list price, monthly cash flow is $282 ($3k/yr) — positive.
- The deal already cash-flows at list — no discount required.
- To meet the 1% rule (rent ≥ 1% of price), the offer needs to be $235k (6.0% below list).
- Recommended offer: $235k (6.0% below list) — sets the bar for 1% rule.
- Cap rate 7.6% vs local median 4.4% in Spring Hill — top-decile yield for the area; either an underpriced asset or a hidden risk that comps aren't pricing in. Stress-test before assuming the spread holds.
Location & tenants
- Location reads 63/100 on livability (#738 in FL) — a middle-class / working-renter tenant base. Strengths: cost of living A+, housing A+; Watch: health & safety C-, employment D+, amenities F.
- Hernando (suburban): math 50% / reading 50% proficiency, ranked #38 of 73 in FL (top 52%) — acceptable for families but not a draw, mixed tenant base, ~2y average lease.
- Market conditions: Rents falling (-4.8%/yr); 738 active listings in the ZIP; 10 comparable units currently listed for rent nearby; rentals at typical pace (median 24d on market — plan ~3-4 weeks tenant-placement turnaround); solid renter incomes; 2,505 units permitted in Hernando County in 2024 (318 in 5+ unit buildings).
- This rent runs 36% of the median local income ($79k/yr) — at the standard rent-burdened threshold; future hikes will face affordability resistance.
Forward outlook
- Local home prices are declining (-3.0%/yr); year-one equity from $2k of loan paydown is wiped out by about $8k of value loss. Plan a longer hold.
- Hernando County population projected at +11% by 2050 — modest demand growth; plan on rents tracking national, not racing it.
Negotiation context
- Only 9 days on market — expect competitive offers; lowballing is unlikely to land.
- Current owner paid $42k; list at $250k implies a 495% gain — meaningful room to come down on a strong offer.
Risks & watch-outs
- Climate carrying-cost: severe wind risk, 99% chance of damaging wind over 30y; moderate wildfire risk; extreme-heat days projected 7→26/yr by 2055 (HVAC capex compounding) — expect insurance premiums to compound above CPI over the hold.
Questions for the listing agent
- Is there a deadline driving the sale (1031 exchange, divorce, estate, relocation)? That informs how much negotiation room exists.
- The area grade is low — what's the realistic commute time and amenity access for the typical tenant pool here? Any planned neighborhood developments (good or bad) we should know about?
- What's the average days-on-market for RENTAL listings here right now (not sales)? A rising rental-DOM trend means longer vacancies and softer asking-rent achievability than the comps imply.
- What's the recent tenant-quality profile in this submarket — average credit score on applications, eviction rate, late-payment / NSF rate, and stable-employment percentage? A property-management company in the area should have these aggregated.
- How much new for-sale + rental construction is in the pipeline within 1–3 miles? Heavy new supply typically softens prices + rents 12–24 months out; constrained supply supports both.
Investment metrics
- 1% rule
- 0.94% ✗
- Cap rate
- 7.65%
- Cash-on-cash
- 4.83%
- DSCR
- 1.22
- GRM
- 8.9
CMA / ARV
- ARV (on-the-fly)
- $251,196
- Comps found
- 12
Show comp detail 12 sales within ~0.75 mi
| Address | Dist | Beds/Ba | Sqft | Sold | Price | $/sf | Match |
|---|---|---|---|---|---|---|---|
| 6347 Shadydale Ave | 0.27mi | 2/1.0 | 1,086 (+5%) | 10mo | $258,000 | $238 | 72 |
| 13186 Thrush St | 0.17mi | 3/2.0 (+1) | 1,114 (+7%) | 2mo | $240,000 | $215 | 69 |
| 12463 Tansboro St | 0.30mi | 2/2.0 | 968 (-7%) | 4mo | $235,000 | $243 | 67 |
| 13082 Lola Dr | 0.27mi | 2/1.0 | 910 (-12%) | 2mo | $218,000 | $240 | 66 |
| 6208 Layton Ave | 0.40mi | 2/2.0 | 1,105 (+6%) | 2mo | $240,000 | $217 | 65 |
| 6450 Crowley Ct | 0.27mi | 2/2.0 | 1,159 (+12%) | 3mo | $280,000 | $242 | 62 |
| 6168 Mariner Blvd | 0.48mi | 2/2.0 | 1,088 (+5%) | 5mo | $195,000 | $179 | 61 |
| 13035 Santee St | 0.41mi | 2/2.0 | 1,138 (+10%) | 3mo | $277,000 | $243 | 58 |
| 12484 Curry Dr | 0.62mi | 3/1.0 (+1) | 990 (-5%) | 3mo | $195,000 | $197 | 56 |
| 13180 Lawrence St | 0.49mi | 2/1.0 | 924 (-11%) | 10mo | $240,000 | $260 | 50 |
| 6012 Landover Blvd | 0.62mi | 2/1.0 | 924 (-11%) | 5mo | $224,900 | $243 | 49 |
| 13208 Siam Dr | 0.67mi | 2/1.0 | 884 (-15%) | 0mo | $215,000 | $243 | 44 |
Match score weights: distance 35% · size 25% · config 20% · recency 20%. Top-matched comps best support the ARV.
Projected returns pro-forma
-3.0% appreciation · 0.0% rent growth · sell at horizon
- IRR
- -12.0%
- Equity multiple
- 0.58×
- Total profit
- $-29,504
- Equity at exit
- $37,276
- IRR
- -7.6%
- Equity multiple
- 0.58×
- Total profit
- $-29,435
- Equity at exit
- $21,615
Cash invested: $70,000 (down + closing). Projections, not guarantees.
Landlord ↔ Tenant lean methodology
- Overall (STATE)
- 87 Strongly Landlord-Friendly
- State Florida
- 87 Strongly Landlord-Friendly · R+3
- County
- — inherits STATE
- City
- — inherits STATE
ZIP-level market 34609
- Home prices YoY
- -23.2%
- Rents YoY
- -4.8%
- Active inventory
- 738
- Price-to-rent
- 8.9×
Monthly cashflow live
- Estimated rent
- $2,351 high interval (Pro) →
- Mortgage (P&I)
- −$1,311
- Tax from tax record
- −$160 /mo · $1,922/yr
- Insurance
- −$104
- HOA
- −$0
- Vacancy / Maint / Mgmt
- −$494
- Net cashflow
- $282
Break-even live
UW: 25.0% down · 7.5% · 30yr · 1.5% tax · 5.0% vac · 8.0% maint · 8.0% mgmt
Financing live
Cash to close
- Down payment
- $62,500
- Closing costs
- $7,500
- Reserves months
- —
- Total cash needed
- —
Loan-product check · same deal, 3 products live
Conventional
25% down · 7.5% · 30yr
- Down + closing
- —
- Monthly P&I
- —
- Monthly cashflow
- —
- DSCR
- —
- Eligible?
- —
Personal DTI + credit; lowest rate.
DSCR
20% down · 8.5% · 30yr
- Down + closing
- —
- Monthly P&I
- —
- Monthly cashflow
- —
- DSCR
- —
- Eligible?
- —
No personal income docs; deal must DSCR.
Hard money
10% down · 12.0% · 12mo
- Down + closing
- —
- Monthly P&I
- —
- Monthly cashflow
- —
- DSCR
- —
- Eligible?
- —
Short-term bridge; refi at stabilization.
Rent comps 10 comps
| Address | Beds | Baths | Sqft | Rent | $/sqft | DOM | Units | Dist |
|---|---|---|---|---|---|---|---|---|
| 13186 Thrush St Spring Hill, FL | 3.0 | 2.0 | 1114 | $1,950 | $1.75 | 24d | 1 | 0.15mi |
| 13109 Lola Dr Spring Hill, FL | 2.0 | 2.0 | 1483 | $4,900 | $3.30 | 24d | 1 | 0.26mi |
| 6289 Mariner Blvd Spring Hill, FL | 3.0 | 2.0 | 1212 | $1,850 | $1.53 | 17d | 1 | 0.31mi |
| 13097 Scottville St Unit 1234463P Spring Hill, FL | 3.0 | 2.0 | 1463 | $3,890 | $2.66 | 1d | 1 | 0.72mi |
| 12454 Seagate St Spring Hill, FL | 3.0 | 2.0 | 1114 | $1,735 | $1.56 | 24d | 1 | 0.80mi |
| 7402 Eastern Circle Dr Brooksville, FL | 2.0 | 1.0 | 720 | $1,200 | $1.67 | 24d | 1 | 1.07mi |
| 7124 Barclay Ave Unit A Spring Hill, FL | 2.0 | 2.0 | 927 | $1,500 | $1.62 | 24d | 1 | 1.30mi |
| 12095 Elgin Blvd Spring Hill, FL | 3.0 | 2.0 | 1284 | $1,849 | $1.44 | 24d | 1 | 1.37mi |
| 14373 Irving St Spring Hill, FL | 2.0 | 1.0 | 828 | $1,750 | $2.11 | 24d | 1 | 1.38mi |
| 5038 Ayrshire Dr Spring Hill, FL | 3.0 | 2.0 | 1418 | $1,850 | $1.30 | 21d | 1 | 1.46mi |
Listing history 8 events
-
2026-06-18days on market $250,000 Active 9 DOM
-
2026-06-17days on market $250,000 Active 8 DOM
-
2026-06-16days on market $250,000 Active 7 DOM
-
2026-06-15days on market $250,000 Active 6 DOM
-
2026-06-13days on market $250,000 Active 4 DOM
-
2026-06-13days on market $250,000 Active 3 DOM
-
2026-06-10remarks 699-char remark
-
2026-06-10$250,000 Active 1 DOM
ⓘ Source: listings_history table (triggers on properties + properties_extension) + one-shot
backfill from property_details.listing_events for pre-trigger history.
Tax reassessment forecast FL · Resets to sale price
- Current annual tax
- $1,922 · $160/mo
- Projected year-2 tax
- $2,075 · $173/mo
- Expected delta
- +$153/yr (+$13/mo · 7.9%)
ⓘ Screening estimate from a state-policy table — verify with the county assessor before closing.
Climate risk First Street
- Flood 3/10 Moderate FEMA zone X (unshaded) · 20% chance over 30 yrs
- Wildfire 5/10 Major
- Heat 10/10 Extreme 7 d/yr ≥110°F today · 26 d/yr by 30 yrs out
- Wind 9/10 Extreme 99% chance of damaging wind over 30 yrs
- Air quality 2/10 Low 2 unhealthy d/yr today · 2 by 30 yrs out
Nearby sold comps map
Loading sold comps map…
Walkable amenities ~0.75 mi
Loading nearby amenities…
Taxation est. · year 1
- Rental income
- $28,212
- − Mortgage interest
- −$14,004
- − Property taxes
- −$1,922
- − Insurance
- −$1,250
- − Repairs & maintenance
- −$2,257
- − Management
- −$2,257
- − Depreciation
- −$7,273
- Taxable loss
- −$751
- Est. tax savings @ 24.0%
- +$180
- After-tax cash flow
- $3,563/yr
For passive investors: Depreciation is non-cash, so a rental often shows a tax loss while cash-flowing — sheltering income. Rental losses are passive: they offset passive income freely, and up to $25,000/yr can offset ordinary (W-2) income if you actively participate and your MAGI is under $100k (phasing out to $0 by $150k); unused losses carry forward. On sale, claimed depreciation is recaptured at up to 25%, and gains may owe capital-gains tax (a 1031 exchange can defer both). Figures are a year-1 estimate at your 24.0% rate — not tax advice; consult a CPA.
Schools (NCES district)
- District
- Hernando
- NCES district ID
- 1200810
- Math proficiency
- 50% ▼ -8.00%
- Reading proficiency
- 50% ▼ -4.00%
- Median HH income
- $41,985
- Composite
- 42.03/100
- National rank
- #3329
- State rank
- #38 of 73 in FL
Livability — Spring Hill
- Score
- 63/100
- State rank
- #738
- US rank
- #15937
Category grades
Schools grade is shown separately in the Schools card above.
Census & demographics
- Census place
- Spring Hill, FL
- County
- Hernando County · 169,677 people
- City population
- 83,915
- Metro
- Tampa-St. Petersburg-Clearwater, FL
- Population (ZIP)
- 47,257
- Household income
- $79,442
- Rent vs Own
- Severe rent burden
- 663.0
Population outlook (Hernando County) Hauer SSP2
- Today (2025)
- 189,218 people
- By 2030
- 194,367 · +2.7%
- By 2040
- 203,398 · +7.5%
- By 2050
- 209,589 · +10.8%
- By 2075
- 218,452 · +15.4%
- By 2100
- 205,923 · +8.8%
Race, ethnicity, and origin ACS 2023
- Neighborhood character
- Predominantly White (65%)
- Race & ethnicity
- White 65% Hispanic / Latino 22% Two or more races 13% Black 6% Asian 3%
- Hispanic origin (detail)
- Mexican 2% Puerto Rican 12% Cuban 3%
- Common ancestry
- Romanian 4% Lithuanian 2% Slovak 1%
- Foreign-born
- 11% · Canada, Jamaica, Philippines
- Languages at home
- 81% English-only · Spanish 15% Other Asian/Pacific 1% Other Indo-European 1%
Political lean MEDSL · Hernando
- 2024 margin
- Solid R (+37.0) · D 31.1% · R 68.2%
- 2008→2024 swing
- -33.5pp toward R · 2008: -3.6pp · 2024: -37.0pp
- All cycles
- 2024: R+37.0 2020: R+30.2 2016: R+29.0 2012: R+8.5 2008: R+3.6
Not yet ingested
- Civics
- —
Market trends
- HPI YoY
- ▼ -86.49%
- Current HPI
- 286.5885
- Rent YoY
- ▼ -4.82%
- Metro
- Tampa-St. Petersburg-Clearwater, FL
- State GDP YoY
- ▲ 3.28%
- F500 in state
- 36
Industry mix (Fortune 500 HQ in FL)
| Industry | F500 HQs | Revenue |
|---|---|---|
| Industrial Technology | 2 | $29B |
|
||
| Insurance | 2 | $17B |
|
||
| Retail | 1 | $60B |
|
||
| Technology Distribution | 1 | $58B |
|
||
| Homebuilding | 1 | $35B |
|
||
| Technology Manufacturing | 1 | $35B |
|
||
Price history
+495.2% since first listed2 events — show timeline
- 2026-06-09 Listed $250,000 Stellar MLS as Distributed by MLS Grid
- 1990-12-01 Sold (Public Records) $42,000 Public Records
Property tax history
+14.5%/yrLatest (2025): $1,922 · +0.8% YoY. Source: county tax records.
Cash-flow waterfall
monthlySold comps — $/sqft
last 12 mo · ≤1 miLoading sold comps…