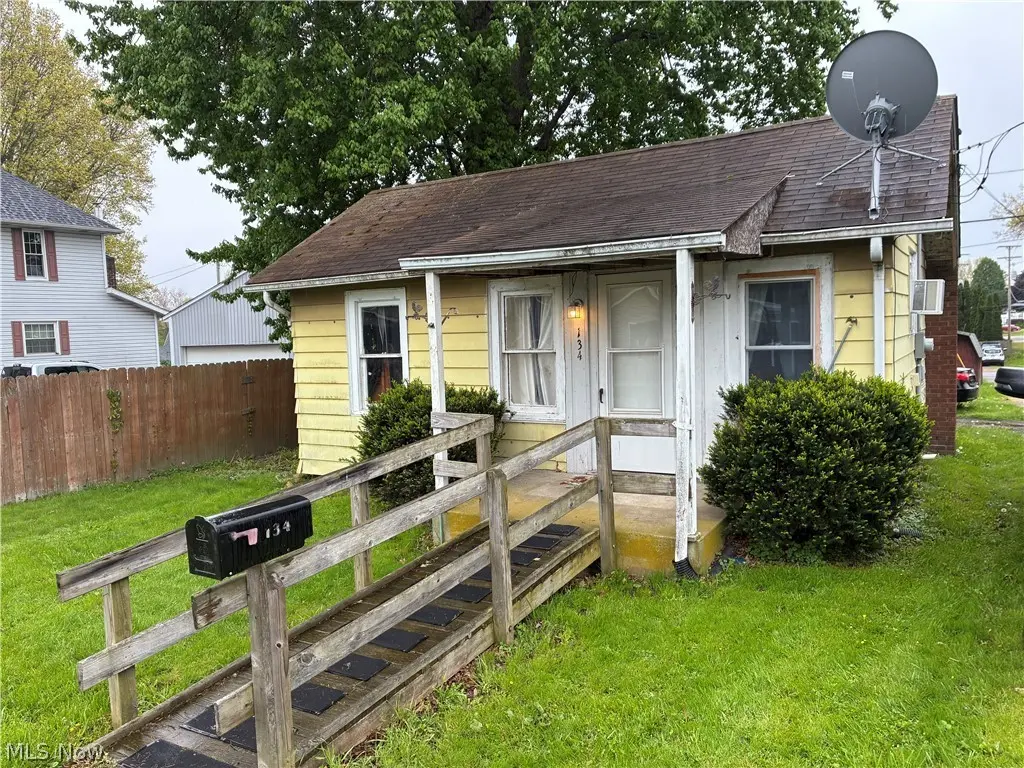
134 Harmon Ave NE · Brewster, OH
Flood risk 1/10 · Minimal
- FEMA flood zone
- X (unshaded)
- Chance of flooding over 30 yrs
- 0.0%
- Est. flood insurance / yr
- $473 – $860
Fire risk 1/10 · Minimal
- Est. fire insurance / yr
- $713 – $1,323
Heat risk 3/10 · Minor
- Hot days now (above 97°F)
- 7 days/yr
- Hot days in 30 yrs
- 17 days/yr
Wind risk 1/10 · Minimal
- Chance of severe wind over 30 yrs
- —
Air-quality risk 2/10 · Minimal
- Unhealthy air days now
- 0 days/yr
- Unhealthy air days in 30 yrs
- 1 days/yr
Risk factors via First Street. Map © Google.
Why this score? — see what drove the B+ grade
The composite is a weighted blend of 9 inputs, each scored 0–100. Each bar is that input's sub-score; the figure is the points it added to the 100-point composite (weight × sub-score).
- Cash flow +30.0/30.0
- 1% rule +10.0/10.0
- DSCR +10.0/10.0
- ARV discount +7.5/15.0
- Appreciation +5.3/10.0
- Schools +4.7/10.0
- Livability +3.2/5.0
- Rent growth +2.5/5.0
- Condition / age +2.5/5.0
$39,900
🖨 Deal sheet 📄 Offer letter ✓ Due diligence
Listing remarks
Small one bed, one bath in Brewster. This home needs some love, but would be a great opportunity in a desired school district. Home has had some updates including a new hot water tank and brand new gas furnace. Priced to sell, set up your showing today.
Key facts
- Hot water tank
- Gas furnace
- 3,998 sq ft lot
Tags
Property features AI
Finance
- Financial info: Annual tax amount reported
Exterior
- Parking: On-street parking
- Utilities: Public water service; Public sewer service
- Home design: Single-story residence
- Construction: Vinyl siding exterior; Asphalt/fiberglass roof
- Exterior features: Lot approximately 0.0918 acres; Public sewer; Public water
Interior
- Bedrooms: One main-level bedroom
- Bathrooms: One full bathroom on the main level
- Heating & cooling: Forced air gas heating; Wall cooling unit(s)
- Interior features: Basement with exterior entry
Neighborhood map
What this means for you Summary
Snapshot
- This is a 1-bed/1.0-bath single-family listed at $40k.
Deal economics
- At list price, monthly cash flow is $548 ($7k/yr) — positive.
- The deal already cash-flows at list — no discount required.
- Meets the 1% rule at list price ($1k rent vs $40k).
Location & tenants
- Location reads 65/100 on livability (#742 in OH) — a middle-class / working-renter tenant base. Strengths: crime A+, cost of living A+, housing A+; Watch: schools F, amenities F, commute F.
- Fairless Local (rural): math 56% / reading 55% proficiency, ranked #365 of 656 in OH (top 56%) — acceptable for families but not a draw, mixed tenant base, ~2y average lease.
- Market conditions: 9 active listings in the ZIP; 528 units permitted in Stark County in 2024 (84 in 5+ unit buildings).
Forward outlook
- In year one you build about $482 of equity ($276 loan paydown + $206 appreciation (0.5% local appreciation)).
- Stark County population projected to shrink 8% by 2050 — rents likely to lag national; underwrite the cash flow, not the appreciation.
- At projected returns (0.5% appreciation + 3.0% rent growth), your $11k cash investment doubles in ~2 years — after that, you're playing with house money.
Negotiation context
- Only 7 days on market — expect competitive offers; lowballing is unlikely to land.
Risks & watch-outs
- Watch-outs: built in 1915 — expect roof / HVAC / electrical / plumbing capex.
Questions for the listing agent
- Built in 1915 — when were the roof, HVAC, electrical panel, plumbing, and water heater last replaced?
- Is there a deadline driving the sale (1031 exchange, divorce, estate, relocation)? That informs how much negotiation room exists.
- Schools are F-rated, which usually means shorter tenancies and higher turnover. Who's the typical renter profile here, and what's been the actual vacancy rate?
- What's the average days-on-market for RENTAL listings here right now (not sales)? A rising rental-DOM trend means longer vacancies and softer asking-rent achievability than the comps imply.
- What's the recent tenant-quality profile in this submarket — average credit score on applications, eviction rate, late-payment / NSF rate, and stable-employment percentage? A property-management company in the area should have these aggregated.
- How much new for-sale + rental construction is in the pipeline within 1–3 miles? Heavy new supply typically softens prices + rents 12–24 months out; constrained supply supports both.
Investment metrics
- 1% rule
- 2.55% ✓
- Cap rate
- 22.79%
- Cash-on-cash
- 58.91%
- DSCR
- 3.62
- GRM
- 3.3
CMA / ARV
- ARV (median comp)
- $80,905
- List price
- $39,900
- Delta
- -50.68%
- Verdict
- UNDERPRICED
- Comps
- 3 within 1.0 mi
Show comp detail 1 sale within ~0.75 mi
| Address | Dist | Beds/Ba | Sqft | Sold | Price | $/sf | Match |
|---|---|---|---|---|---|---|---|
| 134 Harmon Ave NE | 0.00mi | 1/1.0 | 566 (0%) | 1mo | $45,000 | $80 | 99 |
Match score weights: distance 35% · size 25% · config 20% · recency 20%. Top-matched comps best support the ARV.
Projected returns pro-forma
0.52% appreciation · 3.0% rent growth · sell at horizon
- IRR
- 61.2%
- Equity multiple
- 4.11×
- Total profit
- $34,747
- Equity at exit
- $12,626
- IRR
- 62.9%
- Equity multiple
- 8.31×
- Total profit
- $81,613
- Equity at exit
- $16,035
Cash invested: $11,172 (down + closing). Projections, not guarantees.
Landlord ↔ Tenant lean methodology
- Overall (STATE)
- 73 Landlord-Friendly
- State Ohio
- 73 Landlord-Friendly · R+6
- County
- — inherits STATE
- City
- — inherits STATE
ZIP-level market 44613
- Home prices YoY
- 0.3%
- Active inventory
- 9
- Price-to-rent
- 3.3×
Monthly cashflow live
- Estimated rent
- $1,017 medium interval (Pro) →
- Mortgage (P&I)
- −$209
- Tax from tax record
- −$29 /mo · $345/yr
- Insurance
- −$17
- HOA
- −$0
- Vacancy / Maint / Mgmt
- −$213
- Net cashflow
- $548
Break-even live
UW: 25.0% down · 7.5% · 30yr · 1.5% tax · 5.0% vac · 8.0% maint · 8.0% mgmt
Financing live
Cash to close
- Down payment
- $9,975
- Closing costs
- $1,197
- Reserves months
- —
- Total cash needed
- —
Loan-product check · same deal, 3 products live
Conventional
25% down · 7.5% · 30yr
- Down + closing
- —
- Monthly P&I
- —
- Monthly cashflow
- —
- DSCR
- —
- Eligible?
- —
Personal DTI + credit; lowest rate.
DSCR
20% down · 8.5% · 30yr
- Down + closing
- —
- Monthly P&I
- —
- Monthly cashflow
- —
- DSCR
- —
- Eligible?
- —
No personal income docs; deal must DSCR.
Hard money
10% down · 12.0% · 12mo
- Down + closing
- —
- Monthly P&I
- —
- Monthly cashflow
- —
- DSCR
- —
- Eligible?
- —
Short-term bridge; refi at stabilization.
Listing history 6 events
-
2026-05-09status Pending 253-char remark
-
2026-05-06price $39,900 253-char remark
-
2026-05-02$49,900 Active 253-char remark
-
1988-09-13soldstatus $16,000
-
1988-09-13soldstatus $16,000
-
1986-05-02soldstatus $16,000
ⓘ Source: listings_history table (triggers on properties + properties_extension) + one-shot
backfill from property_details.listing_events for pre-trigger history.
Tax reassessment forecast OH · Partial reset (capped growth)
- Current annual tax
- $345 · $29/mo
- Projected year-2 tax
- $484 · $40/mo
- Expected delta
- +$139/yr (+$12/mo · 40.3%)
ⓘ Screening estimate from a state-policy table — verify with the county assessor before closing.
Climate risk First Street
- Flood 1/10 Low FEMA zone X (unshaded) · 0% chance over 30 yrs
- Wildfire 1/10 Low
- Heat 3/10 Moderate 7 d/yr ≥97°F today · 17 d/yr by 30 yrs out
- Wind 1/10 Low
- Air quality 2/10 Low 0 unhealthy d/yr today · 1 by 30 yrs out
Nearby sold comps map
Loading sold comps map…
Walkable amenities ~0.75 mi
Loading nearby amenities…
Taxation est. · year 1
- Rental income
- $12,198
- − Mortgage interest
- −$2,235
- − Property taxes
- −$345
- − Insurance
- −$200
- − Repairs & maintenance
- −$976
- − Management
- −$976
- − Depreciation
- −$1,161
- Taxable income
- $6,307
- Est. tax owed @ 24.0%
- −$1,514
- After-tax cash flow
- $5,068/yr
For passive investors: Depreciation is non-cash, so a rental often shows a tax loss while cash-flowing — sheltering income. Rental losses are passive: they offset passive income freely, and up to $25,000/yr can offset ordinary (W-2) income if you actively participate and your MAGI is under $100k (phasing out to $0 by $150k); unused losses carry forward. On sale, claimed depreciation is recaptured at up to 25%, and gains may owe capital-gains tax (a 1031 exchange can defer both). Figures are a year-1 estimate at your 24.0% rate — not tax advice; consult a CPA.
Schools (NCES district)
- District
- Fairless Local
- NCES district ID
- 3904984
- Math proficiency
- 56% ▼ -6.00%
- Reading proficiency
- 55% ▼ -7.00%
- Median HH income
- $46,217
- Composite
- 46.99/100
- National rank
- #2352
- State rank
- #365 of 656 in OH
Livability — Brewster
- Score
- 65/100
- State rank
- #742
- US rank
- #13369
Category grades
Schools grade is shown separately in the Schools card above.
Census & demographics
- Census place
- Brewster, OH
- County
- Stark · 366,688 people
- City population
- 1,988
- Metro
- Canton-Massillon, OH
- Population (ZIP)
- 1,988
- Household income
- $57,318
- Rent vs Own
- Severe rent burden
- 4.9
Population outlook (Stark County) Hauer SSP2
- Today (2025)
- 373,708 people
- By 2030
- 371,245 · -0.7%
- By 2040
- 361,331 · -3.3%
- By 2050
- 345,290 · -7.6%
- By 2075
- 302,669 · -19.0%
- By 2100
- 238,870 · -36.1%
Race, ethnicity, and origin ACS 2023
- Neighborhood character
- Predominantly White (97%)
- Race & ethnicity
- White 97% Two or more races 2% Black 1%
- Common ancestry
- Lithuanian 3% Scandinavian 3% Romanian 2%
- Foreign-born
- 0%
- Languages at home
- 98% English-only · German/W. Germanic 1% Spanish 1%
Political lean MEDSL · Stark
- 2024 margin
- Strong R (+21.9) · D 38.6% · R 60.5%
- 2008→2024 swing
- -27.4pp toward R · 2008: 5.5pp · 2024: -21.9pp
- All cycles
- 2024: R+21.9 2020: R+18.5 2016: R+17.4 2012: R+0.4 2008: D+5.5
Not yet ingested
- Civics
- —
Market trends
- HPI YoY
- ▲ 0.52%
- Current HPI
- 190.4012
- Rent YoY
- —
- Metro
- —
- State GDP YoY
- ▲ 1.98%
- F500 in state
- 48
Industry mix (Fortune 500 HQ in OH)
| Industry | F500 HQs | Revenue |
|---|---|---|
| Insurance | 3 | $145B |
|
||
| Industrial Machinery | 3 | $49B |
|
||
| Financial Services | 3 | $24B |
|
||
| Consumer Goods | 2 | $93B |
|
||
| Aerospace / Defense | 2 | $47B |
|
||
| Utilities | 2 | $33B |
|
||
Price history
+168.8% since first listed8 events — show timeline
- 2026-05-22 Sold (Public Records) $43,000 Public Records
- 2026-05-22 Sold (MLS) $45,000 MLSNOW
- 2026-05-09 Pending — MLSNOW
- 2026-05-06 Price Changed $39,900 MLSNOW
- 2026-05-02 Listed $49,900 MLSNOW
- 1988-09-13 Sold (Public Records) $16,000 Public Records
- 1988-09-13 Sold (Public Records) $16,000 Public Records
- 1986-05-02 Sold (Public Records) $16,000 Public Records
Property tax history
-2.5%/yrLatest (2024): $345 · -18.9% YoY. Source: county tax records.
Cash-flow waterfall
monthlySold comps — $/sqft
last 12 mo · ≤1 miLoading sold comps…