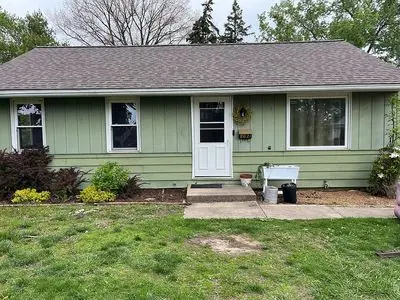
2021 W Overbrook Dr · Peoria, IL
Flood risk 1/10 · Minimal
- FEMA flood zone
- X
- Chance of flooding over 30 yrs
- 0.0%
- Est. flood insurance / yr
- $473 – $860
Fire risk 1/10 · Minimal
- Est. fire insurance / yr
- $804 – $1,492
Heat risk 3/10 · Minor
- Hot days now (above 105°F)
- 7 days/yr
- Hot days in 30 yrs
- 18 days/yr
Wind risk 2/10 · Minimal
- Chance of severe wind over 30 yrs
- 1.0%
Air-quality risk 3/10 · Minor
- Unhealthy air days now
- 1 days/yr
- Unhealthy air days in 30 yrs
- 3 days/yr
Risk factors via First Street. Map © Google.
Why this score? — see what drove the C- grade
The composite is a weighted blend of 9 inputs, each scored 0–100. Each bar is that input's sub-score; the figure is the points it added to the 100-point composite (weight × sub-score).
- Cash flow +21.9/30.0
- ARV discount +8.0/15.0
- 1% rule +7.0/10.0
- DSCR +7.0/10.0
- Livability +3.7/5.0
- Rent growth +3.1/5.0
- Condition / age +2.5/5.0
- Schools +1.1/10.0
- Appreciation +0.0/10.0
$109,000
🖨 Deal sheet 📄 Offer letter ✓ Due diligence
Listing remarks MLS
CONVENIENTLY LOCATED 3 BEDROOM, 1.5 BATH RANCH ON A FULL BASEMENT. HAS SUNKEN FAMILY ROOM, WALK-IN PANTRY, ATTACHED GARAGE AND FINISHABLE BASEMENT. WITH A FEW COSMETIC UPDATES THIS WOULD MAKE A GREAT HOME. SOLD "AS IS". LETTER OF PREQUALIFICATION OR PROOF OF FUNDS REQUIRED WITH ALL OFFERS. ALL MEASUREMENTS APPROXIMATE +-, NOT GUARANTEED. MINIMUM EARNEST MONEY OF $1000 REQUIRED.
Key facts
- Fenced back yard
- Main floor laundry
- Built 1950
Tags
Neighborhood map
What this means for you Summary
Snapshot
- This is a 3-bed/1.5-bath single-family listed at $109k.
Deal economics
- At list price, monthly cash flow is $172 ($2k/yr) — positive.
- The deal already cash-flows at list — no discount required.
- Meets the 1% rule at list price ($1k rent vs $109k).
- Recommended offer: $107k (1.5% below list) — sets the bar for market timing.
- Cap rate 8.2% vs local median 5.6% in Peoria — top-decile yield for the area; either an underpriced asset or a hidden risk that comps aren't pricing in. Stress-test before assuming the spread holds.
Location & tenants
- Location reads 73/100 on livability (#270 in IL) — a middle-class / working-renter tenant base. Strengths: commute A+, cost of living A+, housing A+; Watch: employment D+, schools F, crime F.
- Peoria SD 150 (urban): math 11% / reading 14% proficiency, ranked #554 of 620 in IL (top 89%) — low school quality limits family demand, transient renter base, plan for 1-2y turnover; 70% free/reduced lunch — lower-income household profile, screen leases tightly.
- Market conditions: Rents rising (+2.3%/yr); 180 active listings in the ZIP; 17 comparable units currently listed for rent nearby; rentals leasing fast (median 14d on market — plan ~1-2 weeks tenant-placement turnaround); 73 units permitted in Peoria County in 2024 (0 in 5+ unit buildings).
Forward outlook
- Local home prices are declining (-3.0%/yr); year-one equity from $754 of loan paydown is wiped out by about $3k of value loss. Plan a longer hold.
- Peoria County population projected at -11% by 2050 — secular population decline; favor cash flow + early exit over multi-decade hold.
Negotiation context
- It's been on market 15 days — a 2% lower offer ($107k) is reasonable based on typical stale-listing flexibility.
- 2 sale attempts since 20y ago; this cycle's ask is 82% above the opening price — seller raised mid-cycle; expect resistance to lowballs.
- Current owner paid $56k; list at $109k implies a 96% gain — meaningful room to come down on a strong offer.
Risks & watch-outs
- Watch-outs: property tax is 2.7% of price; built in 1950 — expect roof / HVAC / electrical / plumbing capex.
Questions for the listing agent
- Built in 1950 — when were the roof, HVAC, electrical panel, plumbing, and water heater last replaced?
- Property tax is high relative to price — has the assessment been appealed recently, and will the sale trigger a re-assessment?
- Is there a deadline driving the sale (1031 exchange, divorce, estate, relocation)? That informs how much negotiation room exists.
- Schools are F-rated, which usually means shorter tenancies and higher turnover. Who's the typical renter profile here, and what's been the actual vacancy rate?
- Crime grade is F in this area — have there been break-ins, vandalism, or insurance claims at this property in the last 3 years? What carrier currently insures it and at what premium?
- What's the average days-on-market for RENTAL listings here right now (not sales)? A rising rental-DOM trend means longer vacancies and softer asking-rent achievability than the comps imply.
- What's the recent tenant-quality profile in this submarket — average credit score on applications, eviction rate, late-payment / NSF rate, and stable-employment percentage? A property-management company in the area should have these aggregated.
- How much new for-sale + rental construction is in the pipeline within 1–3 miles? Heavy new supply typically softens prices + rents 12–24 months out; constrained supply supports both.
Investment metrics
- 1% rule
- 1.20% ✓
- Cap rate
- 8.18%
- Cash-on-cash
- 6.76%
- DSCR
- 1.30
- GRM
- 7.0
CMA / ARV
- ARV (median comp)
- $110,132
- List price
- $109,000
- Delta
- -1.03%
- Verdict
- FAIR
- Comps
- 20 within 1.0 mi
Show comp detail 12 sales within ~0.75 mi
| Address | Dist | Beds/Ba | Sqft | Sold | Price | $/sf | Match |
|---|---|---|---|---|---|---|---|
| 3014 N Renwood Ave | 0.32mi | 3/1.0 | 1,254 (-1%) | 2mo | $139,000 | $111 | 80 |
| 2928 N Renwood Ave | 0.29mi | 3/2.0 | 1,238 (-2%) | 1mo | $129,500 | $105 | 80 |
| 2214 W Overbrook Dr | 0.13mi | 3/1.0 | 1,152 (-9%) | 2mo | $140,000 | $122 | 76 |
| 3021 N Mission Rd | 0.27mi | 3/2.0 | 1,380 (+9%) | 5mo | $88,000 | $64 | 66 |
| 2202 W Tripp Ave | 0.42mi | 2/1.0 (-1) | 1,296 (+2%) | 5mo | $31,000 | $24 | 66 |
| 3421 N Rockwood Rd | 0.67mi | 3/1.0 | 1,332 (+5%) | 3mo | $145,900 | $110 | 56 |
| 3423 N EL Vista Ave | 0.62mi | 3/1.0 | 1,183 (-7%) | 5mo | $100,000 | $85 | 54 |
| 1514 W Margaret Ave | 0.48mi | 2/1.0 (-1) | 1,140 (-10%) | 1mo | $122,250 | $107 | 54 |
| 1217 W Gilbert Ave | 0.72mi | 2/1.5 (-1) | 1,165 (-8%) | 0mo | $95,000 | $82 | 48 |
| 1413 W Gilbert Ave | 0.56mi | 2/2.0 (-1) | 1,428 (+13%) | 3mo | $58,000 | $41 | 43 |
| 1324 W Circle Rd | 0.62mi | 3/1.0 | 1,095 (-14%) | 4mo | $72,500 | $66 | 43 |
| 3510 N Elmcroft Ter | 0.74mi | 3/1.0 | 1,092 (-14%) | 1mo | $136,000 | $125 | 40 |
Match score weights: distance 35% · size 25% · config 20% · recency 20%. Top-matched comps best support the ARV.
Projected returns pro-forma
-3.0% appreciation · 2.3% rent growth · sell at horizon
- IRR
- -6.7%
- Equity multiple
- 0.75×
- Total profit
- $-7,547
- Equity at exit
- $16,252
- IRR
- 2.0%
- Equity multiple
- 1.14×
- Total profit
- $4,173
- Equity at exit
- $9,424
Cash invested: $30,520 (down + closing). Projections, not guarantees.
Landlord ↔ Tenant lean methodology
- Overall (STATE)
- 43 Moderately Tenant-Leaning
- State Illinois
- 43 Moderately Tenant-Leaning · D+7
- County
- — inherits STATE
- City
- — inherits STATE
ZIP-level market 61604
- Home prices YoY
- -24.6%
- Rents YoY
- 2.3%
- Active inventory
- 180
- Price-to-rent
- 7.0×
Monthly cashflow live
- Estimated rent
- $1,304 high interval (Pro) →
- Mortgage (P&I)
- −$572
- Tax from tax record
- −$241 /mo · $2,892/yr
- Insurance
- −$45
- HOA
- −$0
- Vacancy / Maint / Mgmt
- −$274
- Net cashflow
- $172
Break-even live
UW: 25.0% down · 7.5% · 30yr · 1.5% tax · 5.0% vac · 8.0% maint · 8.0% mgmt
Financing live
Cash to close
- Down payment
- $27,250
- Closing costs
- $3,270
- Reserves months
- —
- Total cash needed
- —
Loan-product check · same deal, 3 products live
Conventional
25% down · 7.5% · 30yr
- Down + closing
- —
- Monthly P&I
- —
- Monthly cashflow
- —
- DSCR
- —
- Eligible?
- —
Personal DTI + credit; lowest rate.
DSCR
20% down · 8.5% · 30yr
- Down + closing
- —
- Monthly P&I
- —
- Monthly cashflow
- —
- DSCR
- —
- Eligible?
- —
No personal income docs; deal must DSCR.
Hard money
10% down · 12.0% · 12mo
- Down + closing
- —
- Monthly P&I
- —
- Monthly cashflow
- —
- DSCR
- —
- Eligible?
- —
Short-term bridge; refi at stabilization.
Rent comps 17 comps
| Address | Beds | Baths | Sqft | Rent | $/sqft | DOM | Units | Dist |
|---|---|---|---|---|---|---|---|---|
| 2610 N Renwood Ave Peoria, IL | 2.0 | 1.0 | 904 | $1,300 | $1.44 | 13d | 1 | 0.30mi |
| 1413 W Gilbert Ave Peoria, IL | 2.0 | 2.0 | 1428 | $1,500 | $1.05 | 13d | 1 | 0.57mi |
| 3629 N Leroy Ave Unit A Peoria, IL | 2.0 | 1.0 | 1000 | $1,150 | $1.15 | 44d | 1 | 0.69mi |
| 2523 W Nebraska Ave Peoria, IL | 3.0 | 2.0 | 1600 | $1,450 | $0.91 | 21d | 1 | 0.86mi |
| 3108 N Parish Ave Peoria, IL | 3.0 | 1.5 | 967 | $1,750 | $1.81 | 44d | 1 | 0.91mi |
| 2023 N Underhill St Peoria, IL | 3.0 | 1.0 | 1050 | $1,200 | $1.14 | 13d | 1 | 0.99mi |
| 913 W McClure Ave Peoria, IL | 3.0 | 1.0 | 1400 | $1,200 | $0.86 | 21d | 1 | 1.01mi |
| 3601 N Kingston Dr Peoria, IL | 2.0 | 2.0 | 1030 | $1,420 | $1.38 | 13d | 3 | 1.03mi |
| 1801 N Gentry Ln West Peoria, IL | 3.0 | 1.0 | 1000 | $1,650 | $1.65 | 13d | 1 | 1.03mi |
| 4010 N Brandywine Dr Peoria, IL | 1.0–2.0 | 1.0–2.0 | 797 | $1,082 | $1.36 | 13d | 17 | 1.05mi |
| 814 W McClure Ave Peoria, IL | 3.0 | 1.0 | 1148 | $1,100 | $0.96 | 44d | 1 | 1.10mi |
| 903 W Brons Ave Peoria, IL | 3.0 | 1.0 | 971 | $995 | $1.02 | 44d | 1 | 1.13mi |
| 2600 N Lavalle Ct Peoria, IL | 1.0–3.0 | 1.0–2.0 | 803 | $1,150 | $1.43 | 13d | 26 | 1.21mi |
| 3444 W Dorchester Rdg Peoria, IL | 2.0 | 2.0 | 1089 | $1,275 | $1.17 | 13d | 1 | 1.25mi |
| 2109 N Abbey Cir Peoria, IL | 3.0 | 2.0 | 1088 | $1,009 | $0.93 | 13d | 1 | 1.26mi |
| W Crestwood Dr Peoria, IL | 1.0–2.0 | 1.0 | 800 | $975 | $1.22 | 13d | 4 | 1.45mi |
| 1019 N Farmington Rd Unit 1017 Peoria, IL | 3.0 | 1.0 | 1304 | $1,600 | $1.23 | 44d | 1 | 1.50mi |
Listing history 6 events
-
2026-05-12$109,000 Active 310-char remark
-
2010-05-26soldstatus $55,500 396-char remark
Show marketing remark (396 chars)
CONVENIENTLY LOCATED 3 BEDROOM, 1.5 BATH RANCH ON A FULL BASEMENT. HAS SUNKEN FAMILY ROOM, WALK-IN PANTRY, ATTACHED GARAGE AND FINISHABLE BASEMENT. WITH A FEW COSMETIC UPDATES THIS WOULD MAKE A GREAT HOME. SOLD "AS IS". LETTER OF PREQUALIFICATION OR PROOF OF FUNDS REQUIRED WITH ALL OFFERS. ALL MEASUREMENTS APPROXIMATE +-, NOT GUARANTEED. MINIMUM EARNEST MONEY OF $1000 REQUIRED.
-
2010-02-12$59,960 396-char remark
Show marketing remark (396 chars)
CONVENIENTLY LOCATED 3 BEDROOM, 1.5 BATH RANCH ON A FULL BASEMENT. HAS SUNKEN FAMILY ROOM, WALK-IN PANTRY, ATTACHED GARAGE AND FINISHABLE BASEMENT. WITH A FEW COSMETIC UPDATES THIS WOULD MAKE A GREAT HOME. SOLD "AS IS". LETTER OF PREQUALIFICATION OR PROOF OF FUNDS REQUIRED WITH ALL OFFERS. ALL MEASUREMENTS APPROXIMATE +-, NOT GUARANTEED. MINIMUM EARNEST MONEY OF $1000 REQUIRED.
-
2006-10-12soldstatus $87,900
-
2006-10-11soldstatus $87,900
Show marketing remark (188 chars)
Great Family Home with Sunken Family Room & Gas Heater marble Fireplace. Convenient Location, Easy access to I-74. Roof Appears in Good Shape. Nice Rear Yard, Newer Windows throughout.
-
2006-04-01$84,900
Show marketing remark (188 chars)
Great Family Home with Sunken Family Room & Gas Heater marble Fireplace. Convenient Location, Easy access to I-74. Roof Appears in Good Shape. Nice Rear Yard, Newer Windows throughout.
ⓘ Source: listings_history table (triggers on properties + properties_extension) + one-shot
backfill from property_details.listing_events for pre-trigger history.
Tax reassessment forecast IL · Partial reset (capped growth)
- Current annual tax
- $2,892 · $241/mo
- Projected year-2 tax
- $2,892 · $241/mo
- Expected delta
- $0/yr ($0/mo · 0.0%)
ⓘ Screening estimate from a state-policy table — verify with the county assessor before closing.
Climate risk First Street
- Flood 1/10 Low FEMA zone X · 0% chance over 30 yrs
- Wildfire 1/10 Low
- Heat 3/10 Moderate 7 d/yr ≥105°F today · 18 d/yr by 30 yrs out
- Wind 2/10 Low 100% chance of damaging wind over 30 yrs
- Air quality 3/10 Moderate 1 unhealthy d/yr today · 3 by 30 yrs out
Nearby sold comps map
Loading sold comps map…
Walkable amenities ~0.75 mi
Loading nearby amenities…
Taxation est. · year 1
- Rental income
- $15,643
- − Mortgage interest
- −$6,106
- − Property taxes
- −$2,892
- − Insurance
- −$545
- − Repairs & maintenance
- −$1,251
- − Management
- −$1,251
- − Depreciation
- −$3,171
- Taxable income
- $427
- Est. tax owed @ 24.0%
- −$102
- After-tax cash flow
- $1,960/yr
For passive investors: Depreciation is non-cash, so a rental often shows a tax loss while cash-flowing — sheltering income. Rental losses are passive: they offset passive income freely, and up to $25,000/yr can offset ordinary (W-2) income if you actively participate and your MAGI is under $100k (phasing out to $0 by $150k); unused losses carry forward. On sale, claimed depreciation is recaptured at up to 25%, and gains may owe capital-gains tax (a 1031 exchange can defer both). Figures are a year-1 estimate at your 24.0% rate — not tax advice; consult a CPA.
Schools (NCES district)
- District
- Peoria SD 150
- NCES district ID
- 1731230
- Math proficiency
- 11% ▼ -5.00%
- Reading proficiency
- 14% ▼ -4.00%
- Median HH income
- $41,951
- Composite
- 10.92/100
- National rank
- #9751
- State rank
- #554 of 620 in IL
Livability — Peoria
- Score
- 73/100
- State rank
- #270
- US rank
- #5096
Category grades
Schools grade is shown separately in the Schools card above.
Census & demographics
- Census place
- Peoria, IL
- County
- Peoria County · 120,495 people
- City population
- 114,670
- Metro
- Peoria, IL
- Population (ZIP)
- 28,313
- Household income
- $52,414
- Rent vs Own
- Severe rent burden
- 815.0
Population outlook (Peoria County) Hauer SSP2
- Today (2025)
- 183,007 people
- By 2030
- 179,643 · -1.8%
- By 2040
- 171,782 · -6.1%
- By 2050
- 163,508 · -10.7%
- By 2075
- 140,178 · -23.4%
- By 2100
- 114,493 · -37.4%
Race, ethnicity, and origin ACS 2023
- Neighborhood character
- Diverse neighborhood (Simpson 0.61)
- Race & ethnicity
- White 55% Black 29% Two or more races 10% Hispanic / Latino 7% Asian 2%
- Hispanic origin (detail)
- Mexican 5%
- Common ancestry
- Italian 2% Slovak 1% Iranian 1%
- Foreign-born
- 6% · Canada, China
- Languages at home
- 92% English-only · Spanish 4% Chinese 1% French/Haitian/Cajun 1%
Political lean MEDSL · Peoria
- 2024 margin
- Toss-up / Even · D 51.5% · R 46.9% · Other 1.6%
- 2008→2024 swing
- -9.2pp toward R · 2008: 13.9pp · 2024: 4.7pp
- All cycles
- 2024: D+4.7 2020: D+6.3 2016: D+2.8 2012: D+4.4 2008: D+13.9
Not yet ingested
- Civics
- —
Market trends
- HPI YoY
- ▼ -54.15%
- Current HPI
- 165.8838
- Rent YoY
- ▲ 2.30%
- Metro
- Peoria, IL
- State GDP YoY
- ▲ 1.59%
- F500 in state
- 60
Industry mix (Fortune 500 HQ in IL)
| Industry | F500 HQs | Revenue |
|---|---|---|
| Insurance | 4 | $201B |
|
||
| Consumer Goods | 4 | $87B |
|
||
| Industrial Machinery | 3 | $64B |
|
||
| Healthcare | 2 | $55B |
|
||
| Retail / Pharmacy | 1 | $148B |
|
||
| Agriculture / Food | 1 | $86B |
|
||
Price history
-34.6% since first listed5 events — show timeline
- 2010-05-26 Sold (MLS) $55,500 RMLSA as Distributed by MLS Grid
- 2010-02-12 Listed $59,960 RMLSA as Distributed by MLS Grid
- 2006-10-12 Sold (Public Records) $87,900 Public Records
- 2006-10-11 Sold (MLS) $87,900 RMLSA as Distributed by MLS Grid
- 2006-04-01 Listed $84,900 RMLSA as Distributed by MLS Grid
Property tax history
+3.7%/yrLatest (2025): $2,892 · +6.5% YoY. Source: county tax records.
Cash-flow waterfall
monthlySold comps — $/sqft
last 12 mo · ≤1 miLoading sold comps…