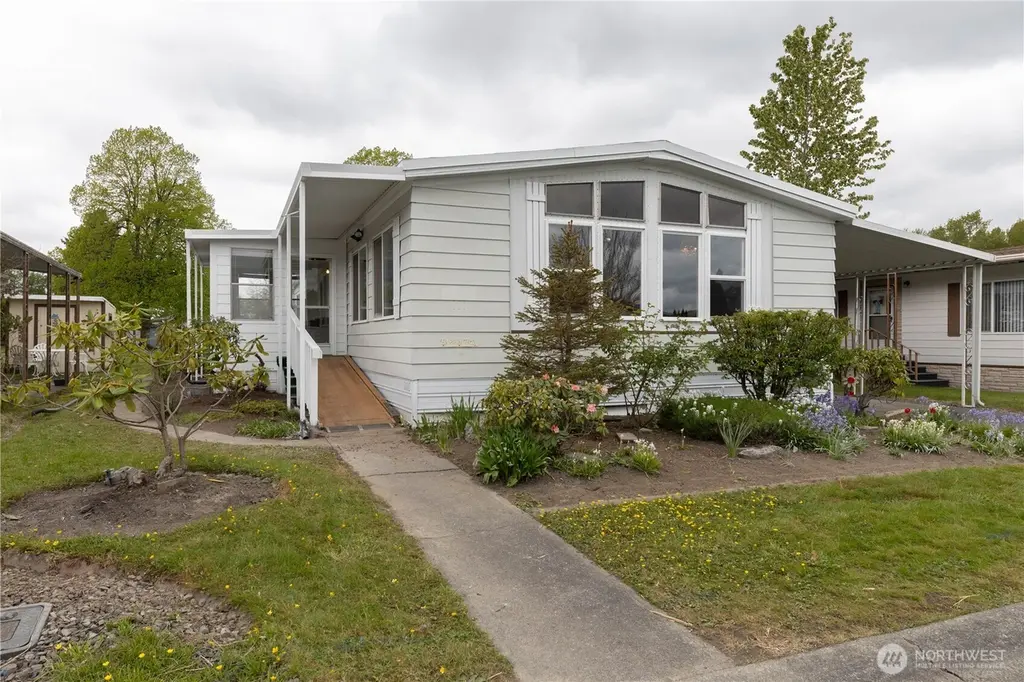
2725 E Fir St #112 · Mount Vernon, WA
Flood risk 4/10 · Minor
- FEMA flood zone
- X
- Chance of flooding over 30 yrs
- 0.22%
- Est. flood insurance / yr
- $507 – $1,088
Fire risk 3/10 · Minor
- Est. fire insurance / yr
- $604 – $1,122
Heat risk 2/10 · Minimal
- Hot days now (above 81°F)
- 8 days/yr
- Hot days in 30 yrs
- 21 days/yr
Wind risk 1/10 · Minimal
- Chance of severe wind over 30 yrs
- —
Air-quality risk 5/10 · Moderate
- Unhealthy air days now
- 7 days/yr
- Unhealthy air days in 30 yrs
- 7 days/yr
Risk factors via First Street. Map © Google.
Why this score? — see what drove the B+ grade
The composite is a weighted blend of 9 inputs, each scored 0–100. Each bar is that input's sub-score; the figure is the points it added to the 100-point composite (weight × sub-score).
- Cash flow +30.0/30.0
- ARV discount +12.6/15.0
- 1% rule +10.0/10.0
- DSCR +10.0/10.0
- Schools +4.0/10.0
- Livability +4.0/5.0
- Rent growth +3.1/5.0
- Condition / age +2.5/5.0
- Appreciation +0.0/10.0
$82,000
🖨 Deal sheet 📄 Offer letter ✓ Due diligence
Listing remarks
Welcome to Park Village, a quiet 55+ gated community in Mount Vernon offering a comfortable, low maintenance lifestyle with an active clubhouse and wonderful amenities. Ideally located just half a block from the clubhouse and set along the pond, this 3 bedroom, 2 bathroom home enjoys a peaceful setting with pond views from select areas of the home. Inside, a centrally located kitchen connects to both the dining room with built ins and a spacious living room, creating an easy, open flow for everyday living. An additional dining nook sits beside sliding glass doors that lead to the covered back deck, and a fully enclosed sunroom provides extra living space to enjoy year-round. The primary sui
Key facts
- Gated community
- Active clubhouse
- Pond views
Tags
Property features AI
Finance
- Other: Suitable for seniors (senior community/exemption)
- Financial info: Listing terms: Cash or Conventional
- HOA & community: Land lease in a senior community (Park Village); park approved for sale; Approximately 125 homes in the park; Park amenities include clubhouse, common area, trails, and high-speed internet availability; Land lease amount: $1,407
Exterior
- Parking: Carport; Uncovered parking
- Utilities: Public water (PUD); Electric water heater (located in main bath closet); Power provided by PSE; Sewer included with HOA dues; Cable and internet via Comcast; Energy sources: Electric and natural gas
- Home design: Manufactured double-wide home (Barrington model 64/24); One level; Faces east; Has view; Good condition
- Construction: Metal skirt; Metal/vinyl and wood construction materials; Torch down roof; Pillar/post/pier foundation; Manufactured after 06/15/1976
- Exterior features: Patio/porch/deck; Landscaped; Open space; Curbs; Paved areas; Metal/vinyl and wood exterior
Interior
- Kitchen: Dishwasher; Garbage disposal; Refrigerator; Stove/Range
- Bedrooms: 3 bedrooms
- Flooring: Vinyl; Carpet
- Bathrooms: 2 full bathrooms (2 tubs, 2 showers)
- Heating & cooling: Heat pump for heating and cooling
- Interior features: Water heater; Walk-in closet; Bath off primary; Entry and dining areas; Kitchen with eating space; Living room; Utility room
- Laundry & utility: Washer; Dryer; Utility room
Neighborhood map
What this means for you Summary
Snapshot
- This is a 3-bed/2.0-bath manufactured listed at $82k.
Deal economics
- At list price, monthly cash flow is $1k ($17k/yr) — positive.
- The deal already cash-flows at list — no discount required.
- Meets the 1% rule at list price ($2k rent vs $82k).
- Recommended offer: $80k (3.0% below list) — sets the bar for market timing.
- Cap rate 26.7% vs local median 2.4% in Mount Vernon — top-decile yield for the area; either an underpriced asset or a hidden risk that comps aren't pricing in. Stress-test before assuming the spread holds.
Location & tenants
- Location reads 79/100 on livability (#106 in WA, #2,120 nationally) — a middle-class / working-renter tenant base. Strengths: commute A+, housing A+, health & safety A+; Watch: cost of living D+.
- Mount Vernon School District (urban): math 41% / reading 47% proficiency, ranked #189 of 291 in WA (top 65%) — families likely to look elsewhere, expect single-tenant / working-renter base with shorter leases.
- Market conditions: Rents rising (+2.3%/yr); 199 active listings in the ZIP; 10 comparable units currently listed for rent nearby; rentals lingering (median 44d on market — plan ~5-8 weeks vacancy on turnover, expect pricing pressure); 50% of comp listings sitting > 30 days — soft ceiling on asking rent; solid renter incomes; 561 units permitted in Skagit County in 2024 (270 in 5+ unit buildings).
- This rent runs 37% of the median local income ($77k/yr) — at the standard rent-burdened threshold; future hikes will face affordability resistance.
Forward outlook
- Local home prices are declining (-3.0%/yr); year-one equity from $567 of loan paydown is wiped out by about $2k of value loss. Plan a longer hold.
- Skagit County population projected at +11% by 2050 — modest demand growth; plan on rents tracking national, not racing it.
- At projected returns (-3.0% appreciation + 2.3% rent growth), your $23k cash investment doubles in ~2 years — after that, you're playing with house money.
Negotiation context
- It's been on market 52 days — a 3% lower offer ($80k) is reasonable based on typical stale-listing flexibility.
- 2 sale attempts since 12y ago with the ask held roughly flat each time — persistent listings suggest the price (not the market) is what's stuck; bring a comps-based counter.
- Current owner paid $29k; list at $82k implies a 183% gain — meaningful room to come down on a strong offer.
Questions for the listing agent
- It's been on market 52 days. Have you received any prior offers? Is the seller open to a 3% concession, seller financing, or rate buy-down credit?
- Built in 1978 — when were the roof, HVAC, electrical panel, plumbing, and water heater last replaced?
- Is there a deadline driving the sale (1031 exchange, divorce, estate, relocation)? That informs how much negotiation room exists.
- What's the average days-on-market for RENTAL listings here right now (not sales)? A rising rental-DOM trend means longer vacancies and softer asking-rent achievability than the comps imply.
- What's the recent tenant-quality profile in this submarket — average credit score on applications, eviction rate, late-payment / NSF rate, and stable-employment percentage? A property-management company in the area should have these aggregated.
- How much new for-sale + rental construction is in the pipeline within 1–3 miles? Heavy new supply typically softens prices + rents 12–24 months out; constrained supply supports both.
Investment metrics
- 1% rule
- 2.90% ✓
- Cap rate
- 26.75%
- Cash-on-cash
- 73.06%
- DSCR
- 4.25
- GRM
- 2.9
CMA / ARV
- ARV (median comp)
- $92,375
- List price
- $82,000
- Delta
- -11.23%
- Verdict
- UNDERPRICED
- Comps
- 15 within 1.0 mi
Show comp detail 12 sales within ~0.75 mi
| Address | Dist | Beds/Ba | Sqft | Sold | Price | $/sf | Match |
|---|---|---|---|---|---|---|---|
| 2725 E Fir St #106 | 0.03mi | 2/2.0 (-1) | 1,440 (0%) | 4mo | $52,000 | $36 | 91 |
| 2725 E Fir St #85 | 0.00mi | 2/2.0 (-1) | 1,428 (-1%) | 13mo | $115,000 | $81 | 83 |
| 2901 Schuller Pl | 0.15mi | 4/2.0 (+1) | 1,504 (+4%) | 2mo | $480,000 | $319 | 79 |
| 2725 E Fir #99 | 0.00mi | 2/2.0 (-1) | 1,524 (+6%) | 9mo | $82,000 | $54 | 78 |
| 2725 E Fir #98 | 0.02mi | 3/2.0 | 1,578 (+10%) | 7mo | $78,500 | $50 | 77 |
| 2725 E Fir St | 0.00mi | 2/2.0 (-1) | 1,334 (-7%) | 11mo | $92,000 | $69 | 73 |
| 2725 E Fir St #13 | 0.00mi | 2/2.0 (-1) | 1,344 (-7%) | 13mo | $97,500 | $73 | 73 |
| 2725 E Fir St #41 | 0.02mi | 2/2.0 (-1) | 1,248 (-13%) | 1mo | $85,000 | $68 | 71 |
| 2725 Fir St #22 | 0.00mi | 2/2.0 (-1) | 1,272 (-12%) | 10mo | $75,500 | $59 | 68 |
| 2725 E Fir St #84 | 0.02mi | 2/2.0 (-1) | 1,280 (-11%) | 10mo | $122,000 | $95 | 67 |
| 1905 N 33rd | 0.64mi | 3/2.0 | 1,274 (-12%) | 9mo | $480,000 | $377 | 44 |
| 1915 N 33rd Pl | 0.67mi | 2/2.0 (-1) | 1,274 (-12%) | 4mo | $399,000 | $313 | 42 |
Match score weights: distance 35% · size 25% · config 20% · recency 20%. Top-matched comps best support the ARV.
Projected returns pro-forma
-3.0% appreciation · 2.33% rent growth · sell at horizon
- IRR
- 72.1%
- Equity multiple
- 4.23×
- Total profit
- $74,130
- Equity at exit
- $12,226
- IRR
- 75.8%
- Equity multiple
- 8.52×
- Total profit
- $172,670
- Equity at exit
- $7,090
Cash invested: $22,960 (down + closing). Projections, not guarantees.
Landlord ↔ Tenant lean methodology
- Overall (STATE)
- 28 Tenant-Leaning
- State Washington
- 28 Tenant-Leaning · D+8
- County
- — inherits STATE
- City
- — inherits STATE
ZIP-level market 98273
- Rents YoY
- 2.3%
- Active inventory
- 199
- Price-to-rent
- 2.9×
Monthly cashflow live
- Estimated rent
- $2,381 high interval (Pro) →
- Mortgage (P&I)
- −$430
- Tax from tax record
- −$19 /mo · $225/yr
- Insurance
- −$34
- HOA
- −$0
- Vacancy / Maint / Mgmt
- −$500
- Net cashflow
- $1,398
Break-even live
UW: 25.0% down · 7.5% · 30yr · 1.5% tax · 5.0% vac · 8.0% maint · 8.0% mgmt
Financing live
Cash to close
- Down payment
- $20,500
- Closing costs
- $2,460
- Reserves months
- —
- Total cash needed
- —
Loan-product check · same deal, 3 products live
Conventional
25% down · 7.5% · 30yr
- Down + closing
- —
- Monthly P&I
- —
- Monthly cashflow
- —
- DSCR
- —
- Eligible?
- —
Personal DTI + credit; lowest rate.
DSCR
20% down · 8.5% · 30yr
- Down + closing
- —
- Monthly P&I
- —
- Monthly cashflow
- —
- DSCR
- —
- Eligible?
- —
No personal income docs; deal must DSCR.
Hard money
10% down · 12.0% · 12mo
- Down + closing
- —
- Monthly P&I
- —
- Monthly cashflow
- —
- DSCR
- —
- Eligible?
- —
Short-term bridge; refi at stabilization.
Rent comps 10 comps
| Address | Beds | Baths | Sqft | Rent | $/sqft | DOM | Units | Dist |
|---|---|---|---|---|---|---|---|---|
| 1521 N 26th St Mount Vernon, WA | 1.0–3.0 | 1.0 | 807 | $1,995 | $2.47 | 21d | 8 | 0.32mi |
| 1115 Nylin Ct Mount Vernon, WA | 3.0 | 1.0 | 1032 | $2,500 | $2.42 | 43d | 1 | 0.50mi |
| 3316 E College Way Unit A Mount Vernon, WA | 3.0 | 1.0 | 916 | $2,000 | $2.18 | 43d | 1 | 0.53mi |
| 119 N 29th Pl Mount Vernon, WA | 3.0 | 1.0 | 1098 | $2,700 | $2.46 | 43d | 1 | 0.62mi |
| 1508 N Waugh Rd Apt B Mount Vernon, WA | 2.0 | 1.0 | 1021 | $2,300 | $2.25 | 21d | 1 | 0.74mi |
| 3129 Arbor St Mount Vernon, WA | 3.0 | 2.0 | 1244 | $2,600 | $2.09 | 21d | 1 | 1.16mi |
| 202 Dallas St Mount Vernon, WA | 3.0 | 2.5 | 1582 | $1,375 | $0.87 | 21d | 1 | 1.32mi |
| 2430 W Meadow Blvd Mount Vernon, WA | 3.0 | 2.5 | 1400 | $3,000 | $2.14 | 43d | 1 | 1.33mi |
| 1002 S 12th St Mount Vernon, WA | 2.0 | 1.0 | 1052 | $2,575 | $2.45 | 21d | 1 | 1.37mi |
| 1511 Shirley Pl Mount Vernon, WA | 2.0 | 1.0 | 936 | $2,250 | $2.40 | 43d | 1 | 1.38mi |
Listing history 20 events
-
2026-06-19days on market $82,000 Active 52 DOM
-
2026-06-18days on market $82,000 Active 51 DOM
-
2026-06-17days on market $82,000 Active 50 DOM
-
2026-06-16days on market $82,000 Active 49 DOM
-
2026-06-15days on market $82,000 Active 48 DOM
-
2026-06-14days on market $82,000 Active 46 DOM
-
2026-06-13days on market $82,000 Active 45 DOM
-
2026-06-10days on market $82,000 Active 43 DOM
-
2026-06-09days on market $82,000 Active 42 DOM
-
2026-06-08days on market $82,000 Active 41 DOM
-
2026-06-07pricedays on market $82,000 Active 40 DOM
-
2026-06-03days on market $85,000 Active 36 DOM
-
2026-06-02days on market $85,000 Active 35 DOM
-
2026-06-01days on market $85,000 Active 34 DOM
-
2026-05-31days on market $85,000 Active 33 DOM
-
2026-05-30days on market $85,000 Active 32 DOM
-
2026-04-28$85,000 Active
-
2014-02-14soldstatus $29,000 Sold
-
2014-02-04status Pending Inspection
-
2014-01-10$32,500 Active
ⓘ Source: listings_history table (triggers on properties + properties_extension) + one-shot
backfill from property_details.listing_events for pre-trigger history.
Tax reassessment forecast WA · Resets to sale price
- Current annual tax
- $225 · $19/mo
- Projected year-2 tax
- $804 · $67/mo
- Expected delta
- +$579/yr (+$48/mo · 257.2%)
ⓘ Screening estimate from a state-policy table — verify with the county assessor before closing.
Climate risk First Street
- Flood 4/10 Moderate FEMA zone X · 22% chance over 30 yrs
- Wildfire 3/10 Moderate
- Heat 2/10 Low 8 d/yr ≥81°F today · 21 d/yr by 30 yrs out
- Wind 1/10 Low
- Air quality 5/10 Major 7 unhealthy d/yr today · 7 by 30 yrs out
Nearby sold comps map
Loading sold comps map…
Walkable amenities ~0.75 mi
Loading nearby amenities…
Taxation est. · year 1
- Rental income
- $28,568
- − Mortgage interest
- −$4,593
- − Property taxes
- −$225
- − Insurance
- −$410
- − Repairs & maintenance
- −$2,285
- − Management
- −$2,285
- − Depreciation
- −$2,385
- Taxable income
- $16,384
- Est. tax owed @ 24.0%
- −$3,932
- After-tax cash flow
- $12,842/yr
For passive investors: Depreciation is non-cash, so a rental often shows a tax loss while cash-flowing — sheltering income. Rental losses are passive: they offset passive income freely, and up to $25,000/yr can offset ordinary (W-2) income if you actively participate and your MAGI is under $100k (phasing out to $0 by $150k); unused losses carry forward. On sale, claimed depreciation is recaptured at up to 25%, and gains may owe capital-gains tax (a 1031 exchange can defer both). Figures are a year-1 estimate at your 24.0% rate — not tax advice; consult a CPA.
Schools (NCES district)
- District
- Mount Vernon School District
- NCES district ID
- 5305400
- Math proficiency
- 41% ▼ -1.00%
- Reading proficiency
- 47% ▲ 1.00%
- Median HH income
- $50,829
- Composite
- 40.14/100
- National rank
- #7848
- State rank
- #189 of 291 in WA
Livability — Mount Vernon
- Score
- 79/100
- State rank
- #106
- US rank
- #2120
Category grades
Schools grade is shown separately in the Schools card above.
Census & demographics
- Census place
- Mount Vernon, WA
- County
- Skagit County · 118,108 people
- City population
- 48,861
- Metro
- Mount Vernon-Anacortes, WA
- Population (ZIP)
- 30,001
- Household income
- $76,717
- Rent vs Own
- Severe rent burden
- 1045.0
Population outlook (Skagit County) Hauer SSP2
- Today (2025)
- 131,498 people
- By 2030
- 135,556 · +3.1%
- By 2040
- 141,717 · +7.8%
- By 2050
- 145,714 · +10.8%
- By 2075
- 152,201 · +15.7%
- By 2100
- 147,980 · +12.5%
Race, ethnicity, and origin ACS 2023
- Neighborhood character
- Majority White (60%)
- Race & ethnicity
- White 60% Hispanic / Latino 32% Two or more races 9% Asian 2% Native American 1%
- Hispanic origin (detail)
- Mexican 30%
- Common ancestry
- Portuguese 6% Slovak 3% Italian 2%
- Foreign-born
- 14% · Canada
- Languages at home
- 71% English-only · Spanish 25% Russian/Polish/Slavic 1% Other Indo-European 1%
Political lean MEDSL · Skagit
- 2024 margin
- Lean D (+8.9) · D 52.9% · R 44.0% · Other 3.0%
- 2008→2024 swing
- -0.7pp no change · 2008: 9.6pp · 2024: 8.9pp
- All cycles
- 2024: D+8.9 2020: D+7.5 2016: D+3.2 2012: D+5.8 2008: D+9.6
Not yet ingested
- Civics
- —
Market trends
- HPI YoY
- ▼ -525.00%
- Current HPI
- 395.3742
- Rent YoY
- ▲ 2.33%
- Metro
- Mount Vernon-Anacortes, WA
- State GDP YoY
- ▲ 4.65%
- F500 in state
- 22
Industry mix (Fortune 500 HQ in WA)
| Industry | F500 HQs | Revenue |
|---|---|---|
| Retail | 2 | $269B |
|
||
| Technology / Retail | 1 | $638B |
|
||
| Technology | 1 | $245B |
|
||
| Telecommunications | 1 | $38B |
|
||
| Food / Beverage | 1 | $36B |
|
||
| Automotive / Trucks | 1 | $34B |
|
||
Price history
+152.3% since first listed5 events — show timeline
- 2026-06-05 Price Changed $82,000 NWMLS as Distributed by MLS Grid
- 2026-04-28 Listed $85,000 NWMLS as Distributed by MLS Grid
- 2014-02-14 Sold (MLS) $29,000 NWMLS as Distributed by MLS Grid
- 2014-02-04 Pending — NWMLS as Distributed by MLS Grid
- 2014-01-10 Listed $32,500 NWMLS as Distributed by MLS Grid
Property tax history
-1.8%/yrLatest (2014): $225 · -1.8% YoY. Source: county tax records.
Cash-flow waterfall
monthlySold comps — $/sqft
last 12 mo · ≤1 miLoading sold comps…