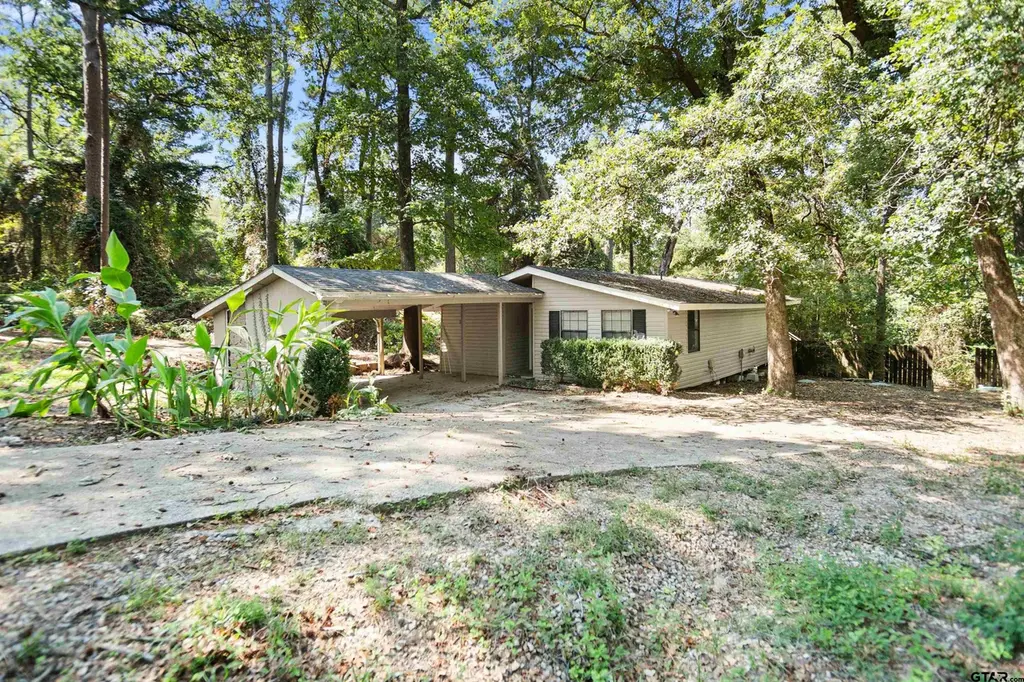
20954 Lakeview Dr · Coffee City, TX
Flood risk 1/10 · Minimal
- FEMA flood zone
- X (unshaded)
- Chance of flooding over 30 yrs
- 0.0%
- Est. flood insurance / yr
- $507 – $1,088
Fire risk 3/10 · Minor
- Est. fire insurance / yr
- $1,222 – $2,270
Heat risk 6/10 · Moderate
- Hot days now (above 109°F)
- 7 days/yr
- Hot days in 30 yrs
- 26 days/yr
Wind risk 6/10 · Moderate
- Chance of severe wind over 30 yrs
- 62.0%
Air-quality risk 1/10 · Minimal
- Unhealthy air days now
- 0 days/yr
- Unhealthy air days in 30 yrs
- 0 days/yr
Risk factors via First Street. Map © Google.
Why this score? — see what drove the C grade
The composite is a weighted blend of 9 inputs, each scored 0–100. Each bar is that input's sub-score; the figure is the points it added to the 100-point composite (weight × sub-score).
- Cash flow +20.8/30.0
- ARV discount +15.0/15.0
- DSCR +6.6/10.0
- 1% rule +5.3/10.0
- Schools +3.3/10.0
- Livability +3.2/5.0
- Rent growth +2.5/5.0
- Condition / age +2.5/5.0
- Appreciation +0.0/10.0
$149,999
🖨 Deal sheet 📄 Offer letter ✓ Due diligence
Listing remarks
Welcome to 20954 Lakeview Drive, a charming 2-bedroom, 2-bathroom home nestled within the Lake Palestine community in Flint, Texas. This residence offers a peaceful retreat in a sought-after lakeside neighborhood. This home features an open-concept design connecting the living, dining, and kitchen areas, providing ample natural light and an inviting atmosphere. The home also features brand new siding and the foundation has recently been leveled. Step outside to appreciate the inviting outdoor spaces, where you can unwind and soak in the beauty of the Lake Palestine community. Embrace the nearby amenities, including lake access, marinas, parks, and community events, that enrich your lakeside
Key facts
- Built 1993
- Listed 44 days
Property features AI
Finance
- HOA & community: Homeowners association with an annual fee of $200 (approximately $16.67/month)
Exterior
- Parking: Concrete parking
- Utilities: Public sewer
- Home design: Single-family detached residence; Single-story
- Construction: Composition roof
- Exterior features: Front porch; Wood fencing; Lake frontage (Lake Palestine)
Interior
- Kitchen: Dishwasher; Electric oven; Electric range
- Flooring: Laminate flooring
- Bathrooms: 2 full bathrooms
- Heating & cooling: Central heating (electric); Central air
- Interior features: Ceiling fans; Central air conditioning; Central electric heating
- Laundry & utility: Electric water heater
Neighborhood map
What this means for you Summary
Snapshot
- This is a 2-bed/2.0-bath single-family listed at $150k.
Deal economics
- At list price, monthly cash flow is $205 ($2k/yr) — positive.
- The deal already cash-flows at list — no discount required.
- Meets the 1% rule at list price ($2k rent vs $150k).
- Recommended offer: $145k (3.0% below list) — sets the bar for market timing.
- Cap rate 7.9% vs local median 3.0% in Coffee City — top-decile yield for the area; either an underpriced asset or a hidden risk that comps aren't pricing in. Stress-test before assuming the spread holds.
Location & tenants
- Location reads 63/100 on livability (#845 in TX) — a middle-class / working-renter tenant base. Strengths: cost of living A+, housing A+; Watch: amenities F, commute F, health & safety D-.
- Tyler ISD (urban): math 39% / reading 38% proficiency, ranked #449 of 826 in TX (top 54%) — families likely to look elsewhere, expect single-tenant / working-renter base with shorter leases; 66% free/reduced lunch — lower-income household profile, screen leases tightly.
- Zoned schools: Owens El (math 49% / reading 58%, grade C, #686 of 4,322 statewide, top 16%, 665 students, 49% FRL); Three Lakes Middle (math 35% / reading 42%, grade F, #704 of 1,662 statewide, top 43%, 873 students, 64% FRL); Tyler Legacy H S (math 34% / reading 49%, grade F, #767 of 1,632 statewide, top 47%, 2,594 students, 58% FRL).
- Market conditions: 354 active listings in the ZIP; 2 comparable units currently listed for rent nearby; solid renter incomes; 595 units permitted in Smith County in 2024 (45 in 5+ unit buildings).
Forward outlook
- Local home prices are declining (-3.0%/yr); year-one equity from $1k of loan paydown is wiped out by about $4k of value loss. Plan a longer hold.
- Smith County population projected at +24% by 2050 — long-run rental-demand tailwind backs the buy-and-hold thesis.
Negotiation context
- It's been on market 45 days — a 3% lower offer ($145k) is reasonable based on typical stale-listing flexibility.
- 2 sale attempts since 3y ago with the ask held roughly flat each time — persistent listings suggest the price (not the market) is what's stuck; bring a comps-based counter.
Risks & watch-outs
- Climate carrying-cost: major wind risk, 62% chance of damaging wind over 30y; extreme-heat days projected 7→26/yr by 2055 (HVAC capex compounding) — expect insurance premiums to compound above CPI over the hold.
Questions for the listing agent
- It's been on market 45 days. Have you received any prior offers? Is the seller open to a 3% concession, seller financing, or rate buy-down credit?
- What does the HOA fee cover, when was the last increase, and are there any pending special assessments or reserve-fund shortfalls?
- Is there a deadline driving the sale (1031 exchange, divorce, estate, relocation)? That informs how much negotiation room exists.
- Schools are F-rated, which usually means shorter tenancies and higher turnover. Who's the typical renter profile here, and what's been the actual vacancy rate?
- What's the average days-on-market for RENTAL listings here right now (not sales)? A rising rental-DOM trend means longer vacancies and softer asking-rent achievability than the comps imply.
- What's the recent tenant-quality profile in this submarket — average credit score on applications, eviction rate, late-payment / NSF rate, and stable-employment percentage? A property-management company in the area should have these aggregated.
- How much new for-sale + rental construction is in the pipeline within 1–3 miles? Heavy new supply typically softens prices + rents 12–24 months out; constrained supply supports both.
Investment metrics
- 1% rule
- 1.03% ✓
- Cap rate
- 7.93%
- Cash-on-cash
- 5.85%
- DSCR
- 1.26
- GRM
- 8.1
CMA / ARV
- ARV (median comp)
- $191,596
- List price
- $149,999
- Delta
- -21.71%
- Verdict
- UNDERPRICED
- Comps
- 4 within 2.0 mi
Projected returns pro-forma
-3.0% appreciation · 3.0% rent growth · sell at horizon
- IRR
- -7.2%
- Equity multiple
- 0.73×
- Total profit
- $-11,242
- Equity at exit
- $22,365
- IRR
- 2.4%
- Equity multiple
- 1.17×
- Total profit
- $7,070
- Equity at exit
- $12,969
Cash invested: $42,000 (down + closing). Projections, not guarantees.
Landlord ↔ Tenant lean methodology
- Overall (STATE)
- 87 Strongly Landlord-Friendly
- State Texas
- 87 Strongly Landlord-Friendly · R+5
- County
- — inherits STATE
- City
- — inherits STATE
ZIP-level market 75762
- Home prices YoY
- -28.4%
- Active inventory
- 354
- Price-to-rent
- 8.1×
Monthly cashflow live
- Estimated rent
- $1,551 medium interval (Pro) →
- Mortgage (P&I)
- −$787
- Tax from tax record
- −$154 /mo · $1,849/yr
- Insurance
- −$62
- HOA
- −$17
- Vacancy / Maint / Mgmt
- −$326
- Net cashflow
- $205
Break-even live
UW: 25.0% down · 7.5% · 30yr · 1.5% tax · 5.0% vac · 8.0% maint · 8.0% mgmt
Financing live
Cash to close
- Down payment
- $37,500
- Closing costs
- $4,500
- Reserves months
- —
- Total cash needed
- —
Loan-product check · same deal, 3 products live
Conventional
25% down · 7.5% · 30yr
- Down + closing
- —
- Monthly P&I
- —
- Monthly cashflow
- —
- DSCR
- —
- Eligible?
- —
Personal DTI + credit; lowest rate.
DSCR
20% down · 8.5% · 30yr
- Down + closing
- —
- Monthly P&I
- —
- Monthly cashflow
- —
- DSCR
- —
- Eligible?
- —
No personal income docs; deal must DSCR.
Hard money
10% down · 12.0% · 12mo
- Down + closing
- —
- Monthly P&I
- —
- Monthly cashflow
- —
- DSCR
- —
- Eligible?
- —
Short-term bridge; refi at stabilization.
Rent comps 2 comps
| Address | Beds | Baths | Sqft | Rent | $/sqft | DOM | Units | Dist |
|---|---|---|---|---|---|---|---|---|
| 20973 Lakeview Dr Flint, TX | 2.0 | 1.0 | 900 | $1,325 | $1.47 | 13d | 1 | 0.04mi |
| 16584 Lakeway Cir Flint, TX | 3.0 | 2.0 | 1500 | $1,050 | $0.70 | 13d | 1 | 1.46mi |
HOA detail
- Monthly dues
- $17 · $204/yr
Listing history 25 events
-
2026-06-19days on market $149,999 Active 45 DOM
-
2026-06-18days on market $149,999 Active 44 DOM
-
2026-06-17days on market $149,999 Active 43 DOM
-
2026-06-16days on market $149,999 Active 42 DOM
-
2026-06-15days on market $149,999 Active 41 DOM
-
2026-06-14days on market $149,999 Active 39 DOM
-
2026-06-13days on market $149,999 Active 38 DOM
-
2026-06-10days on market $149,999 Active 36 DOM
-
2026-06-09days on market $149,999 Active 35 DOM
-
2026-06-08days on market $149,999 Active 34 DOM
-
2026-06-07days on market $149,999 Active 33 DOM
-
2026-06-05days on market $149,999 Active 30 DOM
-
2026-06-02days on market $149,999 Active 28 DOM
-
2026-06-01days on market $149,999 Active 27 DOM
-
2026-05-31days on market $149,999 Active 26 DOM
-
2026-05-30days on market $149,999 Active 25 DOM
-
2026-05-05$149,999 Active 976-char remark
-
2024-02-28price $159,900
-
2024-02-15price $169,900
-
2023-12-01price $179,900
-
2023-10-27price $189,900
-
2023-09-29$199,900 Active
-
2017-11-17soldstatus
-
2005-09-09soldstatus
-
2003-11-11soldstatus
ⓘ Source: listings_history table (triggers on properties + properties_extension) + one-shot
backfill from property_details.listing_events for pre-trigger history.
Tax reassessment forecast TX · Resets to sale price
- Current annual tax
- $1,849 · $154/mo
- Projected year-2 tax
- $2,745 · $229/mo
- Expected delta
- +$896/yr (+$75/mo · 48.4%)
ⓘ Screening estimate from a state-policy table — verify with the county assessor before closing.
Climate risk First Street
- Flood 1/10 Low FEMA zone X (unshaded) · 0% chance over 30 yrs
- Wildfire 3/10 Moderate
- Heat 6/10 Major 7 d/yr ≥109°F today · 26 d/yr by 30 yrs out
- Wind 6/10 Major 62% chance of damaging wind over 30 yrs
- Air quality 1/10 Low 0 unhealthy d/yr today · 0 by 30 yrs out
Nearby sold comps map
Loading sold comps map…
Walkable amenities ~0.75 mi
Loading nearby amenities…
Taxation est. · year 1
- Rental income
- $18,610
- − Mortgage interest
- −$8,402
- − Property taxes
- −$1,849
- − Insurance
- −$750
- − Repairs & maintenance
- −$1,489
- − Management
- −$1,489
- − HOA
- −$204
- − Depreciation
- −$4,364
- Taxable income
- $63
- Est. tax owed @ 24.0%
- −$15
- After-tax cash flow
- $2,444/yr
For passive investors: Depreciation is non-cash, so a rental often shows a tax loss while cash-flowing — sheltering income. Rental losses are passive: they offset passive income freely, and up to $25,000/yr can offset ordinary (W-2) income if you actively participate and your MAGI is under $100k (phasing out to $0 by $150k); unused losses carry forward. On sale, claimed depreciation is recaptured at up to 25%, and gains may owe capital-gains tax (a 1031 exchange can defer both). Figures are a year-1 estimate at your 24.0% rate — not tax advice; consult a CPA.
Schools (NCES district)
- District
- Tyler ISD
- NCES district ID
- 4843470
- Math proficiency
- 39% ▼ -4.00%
- Reading proficiency
- 38% ▼ -1.00%
- Median HH income
- $44,090
- Composite
- 32.69/100
- National rank
- #5650
- State rank
- #449 of 826 in TX
Livability — Coffee City
- Score
- 63/100
- State rank
- #845
- US rank
- #15290
Category grades
Schools grade is shown separately in the Schools card above.
Census & demographics
- County
- Smith County · 180,570 people
- Metro
- Tyler, TX
- Population (ZIP)
- 15,704
- Household income
- $90,057
- Rent vs Own
- Severe rent burden
- 98.0
Population outlook (Smith County) Hauer SSP2
- Today (2025)
- 248,890 people
- By 2030
- 261,665 · +5.1%
- By 2040
- 286,114 · +15.0%
- By 2050
- 308,006 · +23.8%
- By 2075
- 354,171 · +42.3%
- By 2100
- 372,828 · +49.8%
Race, ethnicity, and origin ACS 2023
- Neighborhood character
- Predominantly White (71%)
- Race & ethnicity
- White 71% Hispanic / Latino 16% Two or more races 13% Black 11%
- Hispanic origin (detail)
- Mexican 12%
- Common ancestry
- Iranian 2% Serbian 2% Portuguese 1%
- Foreign-born
- 5% · Canada
- Languages at home
- 85% English-only · Spanish 13%
Political lean MEDSL · Smith
- 2024 margin
- Solid R (+45.1) · D 27.0% · R 72.1%
- 2008→2024 swing
- -5.6pp toward R · 2008: -39.5pp · 2024: -45.1pp
- All cycles
- 2024: R+45.1 2020: R+39.4 2016: R+43.9 2012: R+46.9 2008: R+39.5
Not yet ingested
- Civics
- —
Market trends
- HPI YoY
- ▼ -78.39%
- Current HPI
- 197.2375
- Rent YoY
- —
- Metro
- Tyler, TX
- State GDP YoY
- ▲ 3.95%
- F500 in state
- 110
Industry mix (Fortune 500 HQ in TX)
| Industry | F500 HQs | Revenue |
|---|---|---|
| Energy | 16 | $1,198B |
|
||
| Technology | 5 | $198B |
|
||
| Engineering / Construction | 4 | $72B |
|
||
| Energy Services | 3 | $60B |
|
||
| Utilities | 3 | $41B |
|
||
| Healthcare | 2 | $330B |
|
||
Price history
-25.0% since first listed9 events — show timeline
- 2026-05-05 Listed $149,999 GTAR
- 2024-02-28 Price Changed $159,900 GTAR
- 2024-02-15 Price Changed $169,900 GTAR
- 2023-12-01 Price Changed $179,900 GTAR
- 2023-10-27 Price Changed $189,900 GTAR
- 2023-09-29 Listed $199,900 GTAR
- 2017-11-17 Sold (Public Records) — Public Records
- 2005-09-09 Sold (Public Records) — Public Records
- 2003-11-11 Sold (Public Records) — Public Records
Property tax history
+5.8%/yrLatest (2024): $1,849 · +16.7% YoY. Source: county tax records.
Cash-flow waterfall
monthlySold comps — $/sqft
last 12 mo · ≤1 miLoading sold comps…