 Multi-family
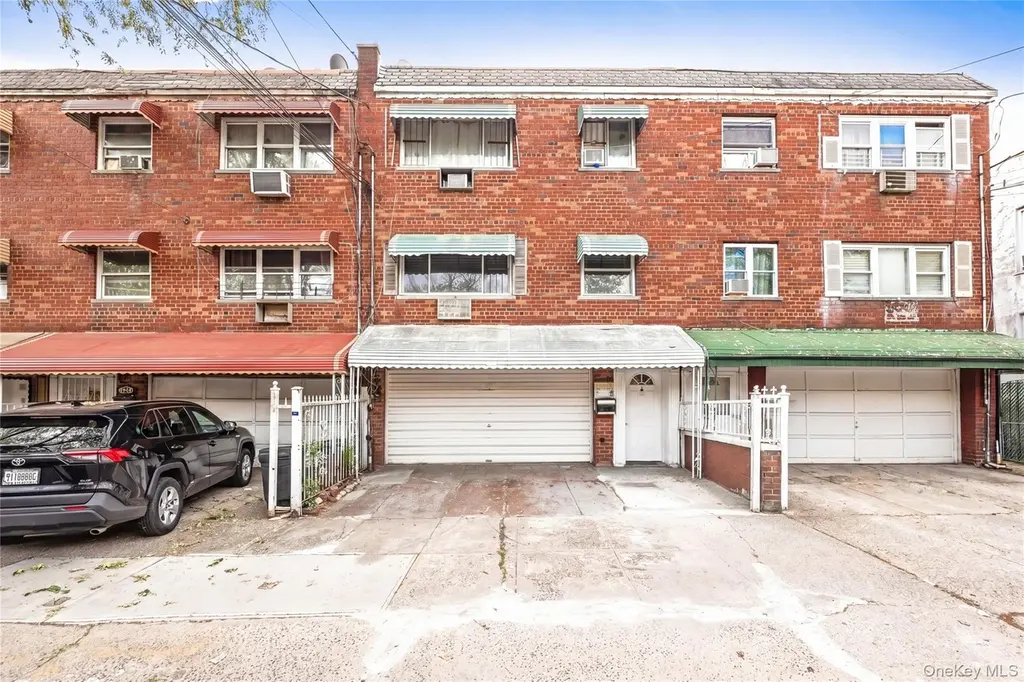
627 Commonwealth Ave · New York, NY
Flood risk 1/10 · Minimal
- FEMA flood zone
- X (unshaded)
- Chance of flooding over 30 yrs
- 0.0%
- Est. flood insurance / yr
- $507 – $1,088
Fire risk 1/10 · Minimal
- Est. fire insurance / yr
- $691 – $1,283
Heat risk 6/10 · Moderate
- Hot days now (above 99°F)
- 7 days/yr
- Hot days in 30 yrs
- 15 days/yr
Wind risk 6/10 · Moderate
- Chance of severe wind over 30 yrs
- 27.0%
Air-quality risk 4/10 · Minor
- Unhealthy air days now
- 5 days/yr
- Unhealthy air days in 30 yrs
- 6 days/yr
Risk factors via First Street. Map © Google.
Why this score? — see what drove the C grade
The composite is a weighted blend of 9 inputs, each scored 0–100. Each bar is that input's sub-score; the figure is the points it added to the 100-point composite (weight × sub-score).
- Cash flow +23.2/30.0
- DSCR +7.5/10.0
- ARV discount +5.8/15.0
- 1% rule +5.3/10.0
- Schools +5.0/10.0
- Livability +3.8/5.0
- Rent growth +2.5/5.0
- Condition / age +2.5/5.0
- Appreciation +0.0/10.0
$949,990
🖨 Deal sheet 📄 Offer letter ✓ Due diligence
Multi-family units
County records classify this as Multi-Family (2-4 Unit). Listing-text estimate: 1 unit. estimate disagrees with records
Listing remarks
Welcome to 627 Commonwealth Ave, a three-level multi-family residence offering 2,850 square feet of living space in a vibrant Bronx neighborhood. Built in 1960, this brick townhouse combines classic urban character with practical functionality across a 2,200 square-foot lot. The home showcases hardwood flooring throughout living areas, creating warmth and continuity. The kitchen features wooden cabinetry, stainless steel appliances, and ample counter space, while the living and dining areas flow naturally with large windows providing abundant natural light. A mirrored accent wall adds visual interest to the main living space, and ceiling fans throughout help with air circulation. This prope
Key facts
- Hardwood flooring
- Large windows
- Wooden cabinetry
Tags
Property features AI
Exterior
- Parking: Covered parking; Driveway; One parking space; One-car garage
- Utilities: Con-Edison electric; Public sewer; Natural gas connected
- Home design: Townhouse; Duplex
- Construction: Brick construction
- Exterior features: Awnings
Interior
- Kitchen: Eat-in kitchen; Open kitchen
- Bedrooms: Two 3-bedroom units
- Flooring: Hardwood floors
- Bathrooms: Two full bathrooms
- Heating & cooling: Baseboard heating; Wall/window air conditioning unit(s)
- Interior features: Eat-in kitchen; Open kitchen; Deck
- Laundry & utility: Basement (full)
Neighborhood map
What this means for you Summary
Snapshot
- This is a 6-bed/2.0-bath multifamily listed at $950k.
Deal economics
- At list price, monthly cash flow is $2k ($21k/yr) — positive.
- The deal already cash-flows at list — no discount required.
- Meets the 1% rule at list price ($10k rent vs $950k).
- Recommended offer: $921k (3.0% below list) — sets the bar for market timing.
- Cap rate 8.5% vs local median 2.6% in New York — top-decile yield for the area; either an underpriced asset or a hidden risk that comps aren't pricing in. Stress-test before assuming the spread holds.
Location & tenants
- Location reads 75/100 on livability (#268 in NY, #4,188 nationally) — a middle-class / working-renter tenant base. Strengths: amenities A+, commute A+, health & safety A; Watch: crime F, cost of living F.
- Market conditions: 141 active listings in the ZIP; 6,929 units permitted in Bronx County in 2024 (6,829 in 5+ unit buildings).
- At $9,740/mo this rent would consume 223% of the median local household income ($52k/yr) (locally 3913% of renters already pay >50% of income on rent) — very limited rent-growth headroom before tenants either downsize or default.
Forward outlook
- Local home prices are declining (-3.0%/yr); year-one equity from $7k of loan paydown is wiped out by about $28k of value loss. Plan a longer hold.
- Bronx County population projected at +21% by 2050 — long-run rental-demand tailwind backs the buy-and-hold thesis.
Negotiation context
- It's been on market 50 days — a 3% lower offer ($921k) is reasonable based on typical stale-listing flexibility.
- 2 sale attempts since 15y ago with the ask held roughly flat each time — persistent listings suggest the price (not the market) is what's stuck; bring a comps-based counter.
- Current owner paid $500k; list at $950k implies a 90% gain — meaningful room to come down on a strong offer.
Risks & watch-outs
- Climate carrying-cost: major wind risk, 27% chance of damaging wind over 30y; extreme-heat days projected 7→15/yr by 2055 (HVAC capex compounding) — expect insurance premiums to compound above CPI over the hold.
Questions for the listing agent
- It's been on market 50 days. Have you received any prior offers? Is the seller open to a 3% concession, seller financing, or rate buy-down credit?
- Built in 1960 — when were the roof, HVAC, electrical panel, plumbing, and water heater last replaced?
- Is there a deadline driving the sale (1031 exchange, divorce, estate, relocation)? That informs how much negotiation room exists.
- Schools are B-rated — typically a magnet for longer-tenancy family renters. What's the average tenant stay here, and is there a school-zone premium baked into asking?
- Crime grade is F in this area — have there been break-ins, vandalism, or insurance claims at this property in the last 3 years? What carrier currently insures it and at what premium?
- What's the average days-on-market for RENTAL listings here right now (not sales)? A rising rental-DOM trend means longer vacancies and softer asking-rent achievability than the comps imply.
- What's the recent tenant-quality profile in this submarket — average credit score on applications, eviction rate, late-payment / NSF rate, and stable-employment percentage? A property-management company in the area should have these aggregated.
- How much new apartment / multifamily construction is in the pipeline within 1–3 miles? Heavy new supply (>2% of stock underway) typically softens rents 12–24 months out; light construction supports rent growth.
Investment metrics
- 1% rule
- 1.03% ✓
- Cap rate
- 8.47%
- Cash-on-cash
- 7.78%
- DSCR
- 1.35
- GRM
- 8.1
CMA / ARV
- ARV (on-the-fly)
- $914,850
- Comps found
- 12
Show comp detail 12 sales within ~0.75 mi
| Address | Dist | Beds/Ba | Sqft | Sold | Price | $/sf | Match |
|---|---|---|---|---|---|---|---|
| 566 Bolton Ave | 0.37mi | 6/2.0 | 2,800 (-2%) | 13mo | $900,000 | $321 | 69 |
| 1815 Patterson Ave | 0.36mi | 5/2.0 (-1) | 2,625 (-8%) | 2mo | $752,200 | $287 | 63 |
| 1894 Seward Ave | 0.35mi | 5/3.0 (-1) | 2,748 (-4%) | 8mo | $850,000 | $309 | 62 |
| 454 Commonwealth Ave | 0.30mi | 7/3.0 (+1) | 2,730 (-4%) | 10mo | $920,000 | $337 | 62 |
| 447 Saint Lawrence Ave | 0.25mi | 7/3.0 (+1) | 2,745 (-4%) | 15mo | $950,000 | $346 | 61 |
| 485 Commonwealth Ave | 0.24mi | 7/3.0 (+1) | 2,650 (-7%) | 10mo | $840,000 | $317 | 60 |
| 622 Saint Lawrence Ave | 0.08mi | 5/— (-1) | 2,540 (-11%) | 21mo | $765,000 | $301 | 56 |
| 1106 Saint Lawrence Ave | 0.73mi | 6/2.0 | 2,800 (-2%) | 9mo | $1,100,000 | $393 | 56 |
| 2067 Seward Ave | 0.70mi | 6/2.0 | 2,680 (-6%) | 5mo | $850,000 | $317 | 54 |
| 410 Thieriot Ave | 0.39mi | 7/3.0 (+1) | 3,110 (+9%) | 6mo | $925,000 | $297 | 53 |
| 1036 Metcalf Ave | 0.66mi | 5/2.0 (-1) | 2,500 (-12%) | 2mo | $870,000 | $348 | 42 |
| 250 Newman Ave | 0.72mi | 5/3.0 (-1) | 2,470 (-13%) | 7mo | $860,000 | $348 | 30 |
Match score weights: distance 35% · size 25% · config 20% · recency 20%. Top-matched comps best support the ARV.
Projected returns pro-forma
-3.0% appreciation · 3.0% rent growth · sell at horizon
- IRR
- -4.5%
- Equity multiple
- 0.83×
- Total profit
- $-44,375
- Equity at exit
- $141,647
- IRR
- 5.2%
- Equity multiple
- 1.38×
- Total profit
- $101,836
- Equity at exit
- $82,138
Cash invested: $265,997 (down + closing). Projections, not guarantees.
Landlord ↔ Tenant lean methodology
- Overall (CITY)
- 0 Strongly Tenant-Friendly
- State New York
- 15 Strongly Tenant-Friendly · D+10
- County
- — inherits STATE
- City New York
- 0 Strongly Tenant-Friendly · D+34
ZIP-level market 10473
- Active inventory
- 141
- Price-to-rent
- 24.4×
Monthly cashflow live
- Estimated rent
- $9,740 medium interval (Pro) →
- Mortgage (P&I)
- −$4,982
- Tax from tax record
- −$593 /mo · $7,119/yr
- Insurance
- −$396
- HOA
- −$0
- Vacancy / Maint / Mgmt
- −$2,045
- Net cashflow
- $1,724
Break-even live
3-unit breakdown (identical units grouped — click to expand)
| Units | Beds | Baths | Est. rent |
|---|---|---|---|
| 3× units | 2 | 1 | $9,741 |
| #1 | 2 | 1 | $3,247 |
| #2 | 2 | 1 | $3,247 |
| #3 | 2 | 1 | $3,247 |
| Total (3 units) | $9,740 | ||
UW: 25.0% down · 7.5% · 30yr · 1.5% tax · 5.0% vac · 8.0% maint · 8.0% mgmt
Financing live
Cash to close
- Down payment
- $237,498
- Closing costs
- $28,500
- Reserves months
- —
- Total cash needed
- —
Loan-product check · same deal, 3 products live
Conventional
25% down · 7.5% · 30yr
- Down + closing
- —
- Monthly P&I
- —
- Monthly cashflow
- —
- DSCR
- —
- Eligible?
- —
Personal DTI + credit; lowest rate.
DSCR
20% down · 8.5% · 30yr
- Down + closing
- —
- Monthly P&I
- —
- Monthly cashflow
- —
- DSCR
- —
- Eligible?
- —
No personal income docs; deal must DSCR.
Hard money
10% down · 12.0% · 12mo
- Down + closing
- —
- Monthly P&I
- —
- Monthly cashflow
- —
- DSCR
- —
- Eligible?
- —
Short-term bridge; refi at stabilization.
Listing history 18 events
-
2026-06-18days on market $949,990 Active 50 DOM
-
2026-06-17days on market $949,990 Active 49 DOM
-
2026-06-16days on market $949,990 Active 48 DOM
-
2026-06-15days on market $949,990 Active 47 DOM
-
2026-06-13days on market $949,990 Active 45 DOM
-
2026-06-10days on market $949,990 Active 41 DOM
-
2026-06-08days on market $949,990 Active 40 DOM
-
2026-06-08days on market $949,990 Active 39 DOM
-
2026-06-04days on market $949,990 Active 36 DOM
-
2026-06-03days on market $949,990 Active 35 DOM
-
2026-06-01days on market $949,990 Active 33 DOM
-
2026-05-31days on market $949,990 Active 32 DOM
-
2026-04-15$949,990 Active
-
2011-06-23historical
-
2011-02-15$429,000
-
2006-07-01soldstatus $499,900
-
2000-02-08soldstatus $175,000
-
1994-10-05soldstatus $180,000
ⓘ Source: listings_history table (triggers on properties + properties_extension) + one-shot
backfill from property_details.listing_events for pre-trigger history.
Tax reassessment forecast NY · Partial reset (capped growth)
- Current annual tax
- $7,119 · $593/mo
- Projected year-2 tax
- $11,587 · $966/mo
- Expected delta
- +$4,468/yr (+$372/mo · 62.8%)
ⓘ Screening estimate from a state-policy table — verify with the county assessor before closing.
Climate risk First Street
- Flood 1/10 Low FEMA zone X (unshaded) · 0% chance over 30 yrs
- Wildfire 1/10 Low
- Heat 6/10 Major 7 d/yr ≥99°F today · 15 d/yr by 30 yrs out
- Wind 6/10 Major 27% chance of damaging wind over 30 yrs
- Air quality 4/10 Moderate 5 unhealthy d/yr today · 6 by 30 yrs out
Nearby sold comps map
Loading sold comps map…
Walkable amenities ~0.75 mi
Loading nearby amenities…
Taxation est. · year 1
- Rental income
- $116,880
- − Mortgage interest
- −$53,214
- − Property taxes
- −$7,119
- − Insurance
- −$4,750
- − Repairs & maintenance
- −$9,350
- − Management
- −$9,350
- − Depreciation
- −$27,636
- Taxable income
- $5,460
- Est. tax owed @ 24.0%
- −$1,310
- After-tax cash flow
- $19,374/yr
For passive investors: Depreciation is non-cash, so a rental often shows a tax loss while cash-flowing — sheltering income. Rental losses are passive: they offset passive income freely, and up to $25,000/yr can offset ordinary (W-2) income if you actively participate and your MAGI is under $100k (phasing out to $0 by $150k); unused losses carry forward. On sale, claimed depreciation is recaptured at up to 25%, and gains may owe capital-gains tax (a 1031 exchange can defer both). Figures are a year-1 estimate at your 24.0% rate — not tax advice; consult a CPA.
Schools (NCES district)
No district data.
Livability — New York
- Score
- 75/100
- State rank
- #268
- US rank
- #4188
Category grades
Schools grade is shown separately in the Schools card above.
Census & demographics
- Census place
- New York, NY
- County
- Bronx County · 1,197,324 people
- City population
- 7,731,280
- Metro
- New York-Newark-Jersey City, NY-NJ-PA
- Population (ZIP)
- 58,855
- Household income
- $52,462
- Rent vs Own
- Severe rent burden
- 3913.0
Population outlook (Bronx County) Hauer SSP2
- Today (2025)
- 1,607,353 people
- By 2030
- 1,681,852 · +4.6%
- By 2040
- 1,824,421 · +13.5%
- By 2050
- 1,945,470 · +21.0%
- By 2075
- 2,187,887 · +36.1%
- By 2100
- 2,244,136 · +39.6%
Race, ethnicity, and origin ACS 2023
- Neighborhood character
- Majority Hispanic (59%)
- Race & ethnicity
- Hispanic / Latino 59% Black 34% Two or more races 12% Asian 2% White 2%
- Hispanic origin (detail)
- Puerto Rican 31% Dominican 20%
- Common ancestry
- British 1%
- Foreign-born
- 23% · Canada, Jamaica
- Languages at home
- 51% English-only · Spanish 45% Other Indo-European 1% French/Haitian/Cajun 1%
Political lean MEDSL · Bronx
- 2024 margin
- Solid D (+45.4) · D 72.7% · R 27.3%
- 2008→2024 swing
- -32.3pp toward R · 2008: 77.8pp · 2024: 45.4pp
- All cycles
- 2024: D+45.4 2020: D+67.6 2016: D+79.1 2012: D+82.9 2008: D+77.8
Not yet ingested
- Civics
- —
Market trends
- HPI YoY
- ▼ -212.70%
- Current HPI
- 276.2941
- Rent YoY
- —
- Metro
- New York-Newark-Jersey City, NY-NJ-PA
- State GDP YoY
- ▲ 2.60%
- F500 in state
- 92
Industry mix (Fortune 500 HQ in NY)
| Industry | F500 HQs | Revenue |
|---|---|---|
| Financial Services | 10 | $950B |
|
||
| Consumer Goods | 9 | $162B |
|
||
| Insurance | 4 | $225B |
|
||
| Telecommunications | 2 | $144B |
|
||
| Pharmaceuticals | 2 | $112B |
|
||
| Media / Entertainment | 2 | $69B |
|
||
Price history
+427.8% since first listed6 events — show timeline
- 2026-04-15 Listed $949,990 OneKey® MLS as Distributed by MLS Grid
- 2011-06-23 Listing Removed — OneKey® MLS as Distributed by MLS Grid
- 2011-02-15 Listed $429,000 OneKey® MLS as Distributed by MLS Grid
- 2006-07-01 Sold (Public Records) $499,900 Public Records
- 2000-02-08 Sold (Public Records) $175,000 Public Records
- 1994-10-05 Sold (Public Records) $180,000 Public Records
Property tax history
+4.1%/yrLatest (2025): $7,119 · +6.0% YoY. Source: county tax records.
Cash-flow waterfall
monthlySold comps — $/sqft
last 12 mo · ≤1 miLoading sold comps…