 🏢 Co-op
347 E 5th St Unit 1A · New York, NY
Flood risk 1/10 · Minimal
- FEMA flood zone
- X (unshaded)
- Chance of flooding over 30 yrs
- 0.0%
- Est. flood insurance / yr
- $507 – $1,088
Fire risk 1/10 · Minimal
- Est. fire insurance / yr
- $691 – $1,283
Heat risk 7/10 · Major
- Hot days now (above 99°F)
- 7 days/yr
- Hot days in 30 yrs
- 15 days/yr
Wind risk 6/10 · Moderate
- Chance of severe wind over 30 yrs
- 27.0%
Air-quality risk 4/10 · Minor
- Unhealthy air days now
- 5 days/yr
- Unhealthy air days in 30 yrs
- 7 days/yr
Risk factors via First Street. Map © Google.
Why this score? — see what drove the B grade
The composite is a weighted blend of 9 inputs, each scored 0–100. Each bar is that input's sub-score; the figure is the points it added to the 100-point composite (weight × sub-score).
- Cash flow +22.6/30.0
- Appreciation +9.7/10.0
- 1% rule +8.2/10.0
- ARV discount +7.5/15.0
- DSCR +7.2/10.0
- Schools +5.0/10.0
- Rent growth +4.8/5.0
- Condition / age +4.0/5.0
- Livability +3.8/5.0
$699,000
🖨 Deal sheet 📄 Offer letter ✓ Due diligence
Listing remarks
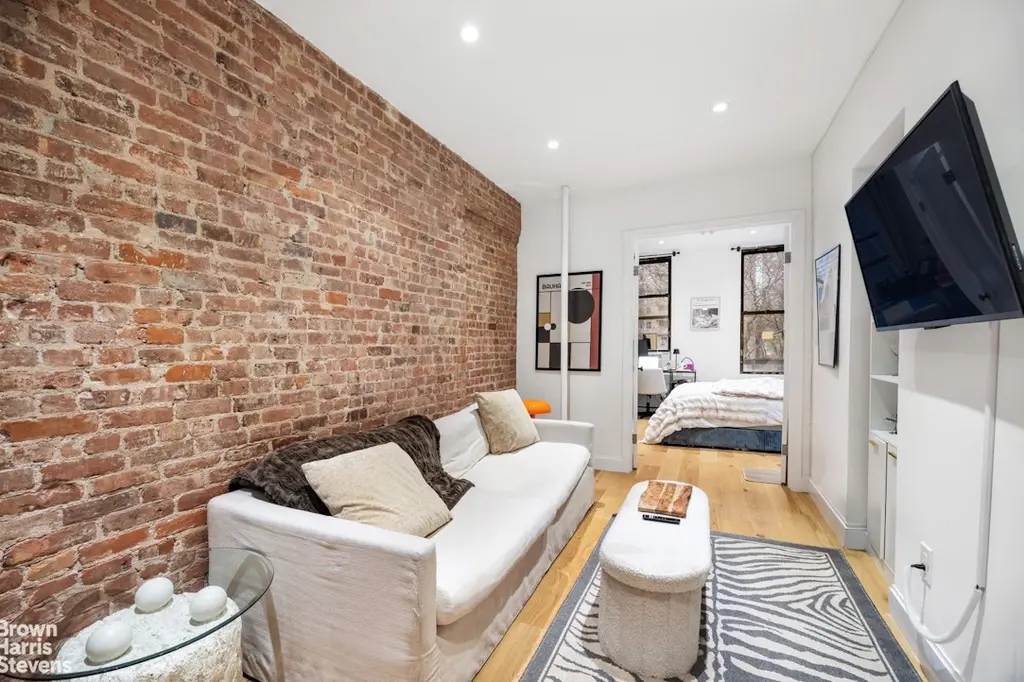
Welcome to 347 East 5th Street, Apartment 1A - a move-in-ready two-bedroom sponsor unit that perfectly blends East Village charm with modern convenience. No board approval & no board package. Just one flight up, this stylish home features exposed brick, wide-plank hardwood floors, and an open-concept kitchen with new countertops, stainless steel appliances, and a dishwasher. An in-unit washer and dryer add everyday ease. The building offers virtual doorman access via Latch, 24/7 professional management, and Verizon Fios compatibility. Pets and guarantors are welcome, providing flexibility for a range of living needs. Ideal as a first downtown home or for sharing with a roommate, t
Key facts
- Open concept kitchen
- Exposed brick
- New countertops
Tags
Property features AI
Finance
- Other: Pets allowed in building (pets policies indicate allowed)
- HOA & community: Monthly association fee of $1,289
Exterior
- Home design: Entry on level 1; Building name: 83 First Avenue
- Exterior features: No notable exterior features listed; Zoning: R7A
Interior
- Bathrooms: 1 full bathroom
- Interior features: Total of 4 rooms; Basement described as 'Other'
- Laundry & utility: In-unit laundry; Building has no laundry facilities
Neighborhood map
What this means for you Summary
Snapshot
- This is a 2-bed/1.0-bath condo listed at $699k. Condition is rated good.
Deal economics
- At list price, monthly cash flow is $1k ($14k/yr) — positive.
- The deal already cash-flows at list — no discount required.
- Meets the 1% rule at list price ($9k rent vs $699k).
- Recommended offer: $689k (1.5% below list) — sets the bar for market timing.
- Cap rate 8.3% vs local median 2.6% in New York — top-decile yield for the area; either an underpriced asset or a hidden risk that comps aren't pricing in. Stress-test before assuming the spread holds.
Location & tenants
- Location reads 75/100 on livability (#268 in NY, #4,188 nationally) — a middle-class / working-renter tenant base. Strengths: amenities A+, commute A+, health & safety A; Watch: crime F, cost of living F.
- Market conditions: Rents rising fast (+9.2%/yr); 361 active listings in the ZIP; 40 comparable units currently listed for rent nearby; rentals at typical pace (median 19d on market — plan ~3-4 weeks tenant-placement turnaround); high-income renter base; 4,467 units permitted in New York County in 2024 (4,463 in 5+ unit buildings).
- At $9,251/mo this rent would consume 72% of the median local household income ($154k/yr) (locally 3480% of renters already pay >50% of income on rent) — very limited rent-growth headroom before tenants either downsize or default.
Forward outlook
- In year one you build about $70k of equity ($5k loan paydown + $65k appreciation (9.3% local appreciation)).
- New York County population projected at +21% by 2050 — long-run rental-demand tailwind backs the buy-and-hold thesis.
- At projected returns (9.3% appreciation + 8.0% rent growth), your $196k cash investment doubles in ~3 years — after that, you're playing with house money.
- By year 2, paydown + projected appreciation supports a ~$112k cash-out refi (75% LTV) — recoverable capital for the next deal without selling this one.
Negotiation context
- It's been on market 17 days — a 2% lower offer ($689k) is reasonable based on typical stale-listing flexibility.
- 2 sale attempts; this cycle's ask has dropped $50k (7%) from the opening price — seller is motivated, your offer sets the floor, not the list.
Risks & watch-outs
- Watch-outs: built in 1869 — expect roof / HVAC / electrical / plumbing capex.
- Climate carrying-cost: major wind risk, 27% chance of damaging wind over 30y; extreme-heat days projected 7→15/yr by 2055 (HVAC capex compounding) — expect insurance premiums to compound above CPI over the hold.
Questions for the listing agent
- Built in 1869 — when were the roof, HVAC, electrical panel, plumbing, and water heater last replaced?
- What does the HOA fee cover, when was the last increase, and are there any pending special assessments or reserve-fund shortfalls?
- Any open or pending special assessments — roof, HVAC, plumbing, elevator, façade? What's the per-unit balance and payoff schedule, and is the seller paying it off at close or rolling it to the buyer?
- Is there a deadline driving the sale (1031 exchange, divorce, estate, relocation)? That informs how much negotiation room exists.
- Schools are B-rated — typically a magnet for longer-tenancy family renters. What's the average tenant stay here, and is there a school-zone premium baked into asking?
- Crime grade is F in this area — have there been break-ins, vandalism, or insurance claims at this property in the last 3 years? What carrier currently insures it and at what premium?
- What's the average days-on-market for RENTAL listings here right now (not sales)? A rising rental-DOM trend means longer vacancies and softer asking-rent achievability than the comps imply.
- What's the recent tenant-quality profile in this submarket — average credit score on applications, eviction rate, late-payment / NSF rate, and stable-employment percentage? A property-management company in the area should have these aggregated.
- How much new apartment / multifamily construction is in the pipeline within 1–3 miles? Heavy new supply (>2% of stock underway) typically softens rents 12–24 months out; light construction supports rent growth.
Investment metrics
- 1% rule
- 1.32% ✓
- Cap rate
- 8.33%
- Cash-on-cash
- 7.29%
- DSCR
- 1.32
- GRM
- 6.3
CMA / ARV
No comps found within radius.
Projected returns pro-forma
9.32% appreciation · 8.0% rent growth · sell at horizon
- IRR
- 30.9%
- Equity multiple
- 3.42×
- Total profit
- $473,860
- Equity at exit
- $595,276
- IRR
- 29.1%
- Equity multiple
- 8.42×
- Total profit
- $1,451,523
- Equity at exit
- $1,248,774
Cash invested: $195,720 (down + closing). Projections, not guarantees.
Landlord ↔ Tenant lean methodology
- Overall (CITY)
- 0 Strongly Tenant-Friendly
- State New York
- 15 Strongly Tenant-Friendly · D+10
- County
- — inherits STATE
- City New York
- 0 Strongly Tenant-Friendly · D+34
ZIP-level market 10003
- Home prices YoY
- 3.4%
- Rents YoY
- 9.2%
- Active inventory
- 361
- Price-to-rent
- 6.3×
Monthly cashflow live
- Estimated rent
- $9,251 high interval (Pro) →
- Mortgage (P&I)
- −$3,666
- Tax est. 1.5%
- −$874 /mo · $10,485/yr
- Insurance
- −$291
- HOA
- −$1,289
- Vacancy / Maint / Mgmt
- −$1,943
- Net cashflow
- $1,189
Break-even live
UW: 25.0% down · 7.5% · 30yr · 1.5% tax · 5.0% vac · 8.0% maint · 8.0% mgmt
Financing live
Cash to close
- Down payment
- $174,750
- Closing costs
- $20,970
- Reserves months
- —
- Total cash needed
- —
Loan-product check · same deal, 3 products live
Conventional
25% down · 7.5% · 30yr
- Down + closing
- —
- Monthly P&I
- —
- Monthly cashflow
- —
- DSCR
- —
- Eligible?
- —
Personal DTI + credit; lowest rate.
DSCR
20% down · 8.5% · 30yr
- Down + closing
- —
- Monthly P&I
- —
- Monthly cashflow
- —
- DSCR
- —
- Eligible?
- —
No personal income docs; deal must DSCR.
Hard money
10% down · 12.0% · 12mo
- Down + closing
- —
- Monthly P&I
- —
- Monthly cashflow
- —
- DSCR
- —
- Eligible?
- —
Short-term bridge; refi at stabilization.
Rent comps 40 comps
| Address | Beds | Baths | Sqft | Rent | $/sqft | DOM | Units | Dist |
|---|---|---|---|---|---|---|---|---|
| 93 1/2 E 7th St Unit 1054297P New York, NY | 2.0 | 1.0 | 495 | $10,000 | $20.20 | 22d | 1 | 0.11mi |
| 212 E 10th St Unit 5A New York, NY | 3.0 | 2.0 | — | $11,500 | — | 7d | 1 | 0.23mi |
| 447 E 9th St Unit 1D New York, NY | 3.0 | 1.0 | — | $8,000 | — | 7d | 1 | 0.24mi |
| 196 Orchard St Unit 6H New York, NY | 3.0 | 2.5 | 1360 | $12,500 | $9.19 | 24d | 1 | 0.26mi |
| 354 Bowery Unit 1035017P New York, NY | 1.0 | 1.0 | 1194 | $18,390 | $15.40 | 6d | 1 | 0.27mi |
| 11 E 1st St New York, NY | 2.0 | 1.0–2.0 | 1060 | $11,225 | $10.59 | 1d | 1 | 0.27mi |
| 166 2nd Ave Unit 9KK New York, NY | 2.0 | 1.5 | 950 | $8,100 | $8.53 | 7d | 1 | 0.28mi |
| 229 Chrystie St New York, NY | 1.0–2.0 | 1.0–2.0 | 810 | $10,485 | $12.94 | 4d | 3 | 0.30mi |
| 112 E 10th St Unit 1021937P New York, NY | 1.0–3.0 | 1.0–2.5 | 1296 | $13,688 | $10.56 | 3d | 2 | 0.30mi |
| 229 Chrystie St Unit 1415A New York, NY | 2.0 | 2.0 | — | $10,100 | — | 24d | 1 | 0.31mi |
| 229 Chrystie St Unit 1120 New York, NY | 2.0 | 2.0 | — | $10,485 | — | 24d | 1 | 0.31mi |
| 310 E 12th St Unit 5J New York, NY | 3.0 | 2.0 | — | $8,700 | — | 24d | 1 | 0.33mi |
| 171 Suffolk St #1265 New York, NY | 1.0–2.0 | 1.0 | 650 | $8,710 | $13.40 | 7d | 2 | 0.33mi |
| 211 E 3rd St Unit 8R New York, NY | 3.0 | 2.0 | — | $8,400 | — | 7d | 1 | 0.34mi |
| 101 E 10th St #1153 New York, NY | 1.0–2.0 | 1.0–2.0 | 575 | $16,510 | $28.71 | 1d | 2 | 0.34mi |
| 209 1st Ave Unit 1370708P New York, NY | 1.0 | 1.0 | 602 | $12,000 | $19.93 | 24d | 1 | 0.36mi |
| 259 Elizabeth St Unit PHA New York, NY | 3.0 | 2.0 | — | $10,200 | — | 24d | 1 | 0.39mi |
| 207 2nd Ave New York, NY | 3.0 | 1.0 | — | $8,250 | — | 7d | 2 | 0.40mi |
| 251 E 13th St New York, NY | 3.0 | 2.0 | — | $10,795 | — | 24d | 1 | 0.41mi |
| 251 E 13th St New York, NY | 3.0 | 2.0 | — | $10,795 | — | 7d | 1 | 0.41mi |
| 51 E Houston St New York, NY | 3.0 | 2.0 | — | $10,500 | — | 24d | 1 | 0.41mi |
| 252 Mott St New York, NY | 3.0 | 2.0 | — | $9,995 | — | 22d | 1 | 0.43mi |
| 252 Mott St New York, NY | 3.0 | 2.0 | — | $9,995 | — | 24d | 1 | 0.43mi |
| 252 Mott St New York, NY | 3.0 | 2.0 | — | $9,995 | — | 2d | 1 | 0.43mi |
| 252 Mott St New York, NY | 3.0 | 2.0 | — | $9,995 | — | 7d | 1 | 0.43mi |
| 248 Mott St New York, NY | 3.0 | 2.0 | — | $9,995 | — | 24d | 1 | 0.44mi |
| 248 Mott St New York, NY | 3.0 | 2.0 | — | $9,995 | — | 4d | 1 | 0.44mi |
| 248 Mott St New York, NY | 3.0 | 2.0 | — | $9,995 | — | 22d | 1 | 0.44mi |
| 202 E 13th St New York, NY | 3.0 | 2.0 | — | $8,995 | — | 24d | 1 | 0.44mi |
| 202 E 13th St New York, NY | 3.0 | 2.0 | — | $8,995 | — | 18d | 1 | 0.44mi |
| 202 E 13th St New York, NY | 3.0 | 2.0 | — | $8,995 | — | 22d | 1 | 0.44mi |
| 60 E 8th St New York, NY | 2.0 | 2.0 | — | $11,000 | — | 24d | 1 | 0.45mi |
| 251 E 2nd St Unit PHA New York, NY | 2.0 | 2.0 | — | $11,000 | — | 24d | 1 | 0.45mi |
| 125 E 12th St Unit 1C New York, NY | 3.0 | 2.5 | 2059 | $20,000 | $9.71 | 4d | 1 | 0.46mi |
| 388 E 10th St Unit 2C New York, NY | 1.0 | 1.0 | — | $5,000 | — | 18d | 1 | 0.48mi |
| 388 E 10th St Unit 1 New York, NY | 2.0 | 1.0 | — | $6,000 | — | 18d | 1 | 0.48mi |
| 510 E 14th St New York, NY | 2.0–3.0 | 2.0–3.0 | — | $9,925 | — | 24d | 2 | 0.48mi |
| 68 Clinton St New York, NY | 3.0 | 1.0 | — | $8,495 | — | 7d | 1 | 0.48mi |
| 234 Mott St Unit 21 New York, NY | 2.0 | 1.0 | — | $7,995 | — | 7d | 1 | 0.48mi |
| 64 Delancey St New York, NY | 3.0 | 1.0 | — | $7,700 | — | 7d | 1 | 0.48mi |
HOA detail condo
- Monthly dues
- $1,289 · $15,468/yr
- Likely covers
- doorman
- Assessments
- None detected in remarks — confirm with the listing agent.
Listing history 13 events
-
2026-06-18days on market $699,000 Active 17 DOM
-
2026-06-17days on market $699,000 Active 16 DOM
-
2026-06-16days on market $699,000 Active 15 DOM
-
2026-06-15days on market $699,000 Active 14 DOM
-
2026-06-13days on market $699,000 Active 12 DOM
-
2026-06-10price $699,000 Active 8 DOM
-
2026-06-09days on market $749,000 Active 8 DOM
-
2026-06-08days on market $749,000 Active 7 DOM
-
2026-06-08days on market $749,000 Active 6 DOM
-
2026-06-04days on market $749,000 Active 3 DOM
-
2026-06-03days on market $749,000 Active 2 DOM
-
2026-06-02remarks 695-char remark
-
2026-06-02$749,000 Active 1 DOM
ⓘ Source: listings_history table (triggers on properties + properties_extension) + one-shot
backfill from property_details.listing_events for pre-trigger history.
Climate risk First Street
- Flood 1/10 Low FEMA zone X (unshaded) · 0% chance over 30 yrs
- Wildfire 1/10 Low
- Heat 7/10 Severe 7 d/yr ≥99°F today · 15 d/yr by 30 yrs out
- Wind 6/10 Major 27% chance of damaging wind over 30 yrs
- Air quality 4/10 Moderate 5 unhealthy d/yr today · 7 by 30 yrs out
Nearby sold comps map
Loading sold comps map…
Walkable amenities ~0.75 mi
Loading nearby amenities…
Taxation est. · year 1
- Rental income
- $111,014
- − Mortgage interest
- −$39,155
- − Property taxes
- −$10,485
- − Insurance
- −$3,495
- − Repairs & maintenance
- −$8,881
- − Management
- −$8,881
- − HOA
- −$15,468
- − Depreciation
- −$20,335
- Taxable income
- $4,315
- Est. tax owed @ 24.0%
- −$1,035
- After-tax cash flow
- $13,230/yr
For passive investors: Depreciation is non-cash, so a rental often shows a tax loss while cash-flowing — sheltering income. Rental losses are passive: they offset passive income freely, and up to $25,000/yr can offset ordinary (W-2) income if you actively participate and your MAGI is under $100k (phasing out to $0 by $150k); unused losses carry forward. On sale, claimed depreciation is recaptured at up to 25%, and gains may owe capital-gains tax (a 1031 exchange can defer both). Figures are a year-1 estimate at your 24.0% rate — not tax advice; consult a CPA.
Condition & rehab AI · 8 photos
This move-in-ready two-bedroom apartment in the East Village offers modern amenities and a charming design, with a good condition score and minimal repairs needed.
Value-add opportunities
- Both landscaping — enhances curb appeal and adds value
- Both paint — refreshes interior and exterior
- Both HVAC upgrade — improves comfort and energy efficiency
- Both landscaping — enhances curb appeal and adds value
Renovation cost estimate screening
Value-add ROI direction
- Both landscaping — enhances curb appeal and adds value ↑
- Both paint — refreshes interior and exterior ↑
- Both HVAC upgrade — improves comfort and energy efficiency ↑
- Both landscaping — enhances curb appeal and adds value ↑
ⓘ Cost ranges are severity-bucket heuristics (US national rule-of-thumb). Get contractor quotes + a written scope before underwriting a rehab budget.
Schools (NCES district)
No district data.
Livability — New York
- Score
- 75/100
- State rank
- #268
- US rank
- #4188
Category grades
Schools grade is shown separately in the Schools card above.
Census & demographics
- Census place
- New York, NY
- County
- New York County · 1,599,927 people
- City population
- 7,731,280
- Metro
- New York-Newark-Jersey City, NY-NJ-PA
- Population (ZIP)
- 53,560
- Household income
- $154,262
- Rent vs Own
- Severe rent burden
- 3480.0
Population outlook (New York County) Hauer SSP2
- Today (2025)
- 1,825,725 people
- By 2030
- 1,904,611 · +4.3%
- By 2040
- 2,052,719 · +12.4%
- By 2050
- 2,206,601 · +20.9%
- By 2075
- 2,509,427 · +37.4%
- By 2100
- 2,702,933 · +48.0%
Race, ethnicity, and origin ACS 2023
- Neighborhood character
- Majority White (64%)
- Race & ethnicity
- White 64% Asian 18% Hispanic / Latino 10% Two or more races 8% Black 4%
- Hispanic origin (detail)
- Puerto Rican 2%
- Common ancestry
- Scotch-Irish 5% Romanian 5% Lithuanian 3%
- Foreign-born
- 20% · Canada, China, South Korea
- Languages at home
- 78% English-only · Spanish 5% Chinese 4% French/Haitian/Cajun 3%
Political lean MEDSL · New York
- 2024 margin
- Solid D (+64.8) · D 82.4% · R 17.6%
- 2008→2024 swing
- -7.4pp toward R · 2008: 72.2pp · 2024: 64.8pp
- All cycles
- 2024: D+64.8 2020: D+74.5 2016: D+77.2 2012: D+69.6 2008: D+72.2
Not yet ingested
- Civics
- —
Market trends
- HPI YoY
- ▲ 9.32%
- Current HPI
- 284.9232
- Rent YoY
- ▲ 9.24%
- Metro
- New York-Newark-Jersey City, NY-NJ-PA
- State GDP YoY
- ▲ 2.60%
- F500 in state
- 92
Industry mix (Fortune 500 HQ in NY)
| Industry | F500 HQs | Revenue |
|---|---|---|
| Financial Services | 10 | $950B |
|
||
| Consumer Goods | 9 | $162B |
|
||
| Insurance | 4 | $225B |
|
||
| Telecommunications | 2 | $144B |
|
||
| Pharmaceuticals | 2 | $112B |
|
||
| Media / Entertainment | 2 | $69B |
|
||
Price history
+12813.8% since first listed5 events — show timeline
- 2026-06-01 Listed $749,000 RLS at REBNY
- 2026-03-06 Price Changed $749,900 RLS at REBNY
- 2025-05-13 Rental Removed $5,495 REBNY
- 2025-05-06 Price Changed $5,495 REBNY
- 2025-05-02 Listed for Rent $5,800 REBNY
Cash-flow waterfall
monthlySold comps — $/sqft
last 12 mo · ≤1 miLoading sold comps…