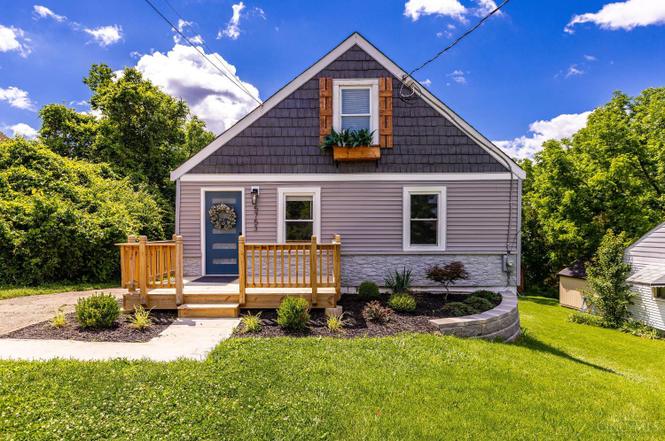
5753 Boomer Rd · Monfort Heights, OH
Flood risk 1/10 · Minimal
- FEMA flood zone
- X (unshaded)
- Chance of flooding over 30 yrs
- 0.0%
- Est. flood insurance / yr
- $473 – $860
Fire risk 1/10 · Minimal
- Est. fire insurance / yr
- $713 – $1,323
Heat risk 4/10 · Minor
- Hot days now (above 102°F)
- 7 days/yr
- Hot days in 30 yrs
- 19 days/yr
Wind risk 2/10 · Minimal
- Chance of severe wind over 30 yrs
- 1.0%
Air-quality risk 2/10 · Minimal
- Unhealthy air days now
- 1 days/yr
- Unhealthy air days in 30 yrs
- 1 days/yr
Risk factors via First Street. Map © Google.
Why this score? — see what drove the F grade
The composite is a weighted blend of 9 inputs, each scored 0–100. Each bar is that input's sub-score; the figure is the points it added to the 100-point composite (weight × sub-score).
- Schools +6.0/10.0
- Cash flow +4.3/30.0
- Livability +4.2/5.0
- ARV discount +2.8/15.0
- Rent growth +2.5/5.0
- Condition / age +2.5/5.0
- 1% rule +0.0/10.0
- DSCR +0.0/10.0
- Appreciation +0.0/10.0
$295,000
🖨 Deal sheet 📄 Offer letter ✓ Due diligence
Listing remarks MLS
Stunning fully rehabbed Cape Cod in Oak Hills School District blends charm and modern luxury! Chef's dream kitchen, new updates throughout. First floor laundry, entertaining deck off kitchen and a spacious backyard with a creek and fire pit. Septic updated to current codes. Basement offers two egresses for additional square footage and value.
Key facts
- Walkout basement
- Rehabbed cape cod
- Spacious backyard
Tags
Property features AI
Finance
- Other: High school district: (information provided but school names excluded per instructions)
- HOA & community: No HOA
Exterior
- Parking: Driveway
- Utilities: Public water; Septic tank sewer; Gas available at street; Electric service (implied); Gas water heater
- Home design: Cape Cod style; Single-family home; One and one half levels; Block foundation; Shingle roof; Residential zoning; Less than 0.5 acre lot (approx. 0.484 acres)
- Construction: Aluminum and vinyl siding; Block foundation; Built with shingle roof
- Exterior features: Deck; Fire pit; Paved road access
Interior
- Kitchen: Eat-in kitchen with island and wood cabinets; Gourmet kitchen with counter bar and walkout; Wood flooring in kitchen; Appliances included: Dishwasher, Electric cooktop, Microwave, Oven/Range, Refrigerator
- Bedrooms: Three bedrooms total; Primary bedroom approx. 12 x 15 (on main level); Second bedroom approx. 9 x 14 (on main level); Third bedroom approx. 13 x 11 (on upper level)
- Flooring: Wood floors in living areas and kitchen; Laminate floor in study/den; Wall-to-wall carpet in finished basement areas
- Bathrooms: Two full bathrooms (one on main level, one on upper level)
- Heating & cooling: Forced air gas heating; Central air conditioning; Gas water heating; Thermostat (smart technology)
- Interior features: Ceiling fan; Recessed lights; Smoke alarm; Seven total rooms; Full basement (partially finished) with walkout, wall-to-wall carpet and laminate flooring
- Laundry & utility: Sump pump
Neighborhood map
What this means for you Summary
Snapshot
- This is a 3-bed/1.0-bath single-family listed at $295k.
Deal economics
- At list price, monthly cash flow is $-786 ($-9k/yr) — negative.
- To cash-flow at today's rent, offer at most $156k (47.1% below list).
- To meet the 1% rule (rent ≥ 1% of price), the offer needs to be $134k (54.4% below list).
- Recommended offer: $134k (54.4% below list) — sets the bar for 1% rule.
Location & tenants
- Location reads 85/100 on livability (#46 in OH, #614 nationally) — a professional / high-income tenant draw. Strengths: commute A+, employment A+, cost of living A+; Watch: amenities F.
- Oak Hills Local (suburban): math 68% / reading 70% proficiency, ranked #141 of 656 in OH (top 22%) — acceptable for families but not a draw, mixed tenant base, ~2y average lease.
- Market conditions: 51 active listings in the ZIP; 3 comparable units currently listed for rent nearby; rentals at typical pace (median 24d on market — plan ~3-4 weeks tenant-placement turnaround); solid renter incomes; 801 units permitted in Hamilton County in 2024 (190 in 5+ unit buildings).
- This rent is only 17% of the median local income ($96k/yr) — well below the 30% rent-burden line; pricing power to push rent on renewal without tenant pushback.
Forward outlook
- Local home prices are declining (-3.0%/yr); year-one equity from $2k of loan paydown is wiped out by about $9k of value loss. Plan a longer hold.
Negotiation context
- Only 1 days on market — expect competitive offers; lowballing is unlikely to land.
- 8 sale attempts since 11y ago with the ask held roughly flat each time — persistent listings suggest the price (not the market) is what's stuck; bring a comps-based counter.
- Current owner paid $115k; list at $295k implies a 157% gain — meaningful room to come down on a strong offer.
Risks & watch-outs
- Watch-outs: built in 1938 — expect roof / HVAC / electrical / plumbing capex.
Questions for the listing agent
- What do current leases actually rent for vs. the listed asking? Can we see a recent rent roll and the last 12 months of T-12 income?
- Built in 1938 — when were the roof, HVAC, electrical panel, plumbing, and water heater last replaced?
- Is there a deadline driving the sale (1031 exchange, divorce, estate, relocation)? That informs how much negotiation room exists.
- Schools are B-rated — typically a magnet for longer-tenancy family renters. What's the average tenant stay here, and is there a school-zone premium baked into asking?
- The area grade is low — what's the realistic commute time and amenity access for the typical tenant pool here? Any planned neighborhood developments (good or bad) we should know about?
- What's the average days-on-market for RENTAL listings here right now (not sales)? A rising rental-DOM trend means longer vacancies and softer asking-rent achievability than the comps imply.
- What's the recent tenant-quality profile in this submarket — average credit score on applications, eviction rate, late-payment / NSF rate, and stable-employment percentage? A property-management company in the area should have these aggregated.
- How much new for-sale + rental construction is in the pipeline within 1–3 miles? Heavy new supply typically softens prices + rents 12–24 months out; constrained supply supports both.
Investment metrics
- 1% rule
- 0.46% ✗
- Cap rate
- 3.10%
- Cash-on-cash
- -11.42%
- DSCR
- 0.49
- GRM
- 18.3
CMA / ARV
- ARV (on-the-fly)
- $267,246
- Comps found
- 6
Show comp detail 6 sales within ~0.75 mi
| Address | Dist | Beds/Ba | Sqft | Sold | Price | $/sf | Match |
|---|---|---|---|---|---|---|---|
| 5753 Boomer Rd | 0.00mi | 3/2.0 | 1,323 (0%) | 12mo | $115,000 | $87 | 86 |
| 5581 Windridge Dr | 0.26mi | 3/2.0 | 1,315 (-1%) | 9mo | $230,000 | $175 | 75 |
| 5050 Valley Ridge Rd | 0.55mi | 3/1.0 | 1,308 (-1%) | 10mo | $264,400 | $202 | 64 |
| 6074 Johnson Rd | 0.45mi | 3/1.5 | 1,426 (+8%) | 3mo | $289,000 | $203 | 62 |
| 5073 Valley Ridge Rd | 0.55mi | 3/2.0 | 1,243 (-6%) | 2mo | $295,000 | $237 | 59 |
| 5622 Reemelin Rd | 0.32mi | 2/1.0 (-1) | 1,449 (+10%) | 10mo | $145,000 | $100 | 56 |
Match score weights: distance 35% · size 25% · config 20% · recency 20%. Top-matched comps best support the ARV.
Projected returns pro-forma
-3.0% appreciation · 3.0% rent growth · sell at horizon
- IRR
- -37.3%
- Equity multiple
- -0.19×
- Total profit
- $-97,956
- Equity at exit
- $43,985
- IRR
- -54.3%
- Equity multiple
- -0.82×
- Total profit
- $-150,147
- Equity at exit
- $25,506
Cash invested: $82,600 (down + closing). Projections, not guarantees.
Landlord ↔ Tenant lean methodology
- Overall (STATE)
- 73 Landlord-Friendly
- State Ohio
- 73 Landlord-Friendly · R+6
- County
- — inherits STATE
- City
- — inherits STATE
ZIP-level market 45247
- Active inventory
- 51
- Price-to-rent
- 18.3×
Monthly cashflow live
- Estimated rent
- $1,345 medium interval (Pro) →
- Mortgage (P&I)
- −$1,547
- Tax from tax record
- −$179 /mo · $2,143/yr
- Insurance
- −$123
- HOA
- −$0
- Vacancy / Maint / Mgmt
- −$282
- Net cashflow
- $-786
Break-even live
UW: 25.0% down · 7.5% · 30yr · 1.5% tax · 5.0% vac · 8.0% maint · 8.0% mgmt
Financing live
Cash to close
- Down payment
- $73,750
- Closing costs
- $8,850
- Reserves months
- —
- Total cash needed
- —
Loan-product check · same deal, 3 products live
Conventional
25% down · 7.5% · 30yr
- Down + closing
- —
- Monthly P&I
- —
- Monthly cashflow
- —
- DSCR
- —
- Eligible?
- —
Personal DTI + credit; lowest rate.
DSCR
20% down · 8.5% · 30yr
- Down + closing
- —
- Monthly P&I
- —
- Monthly cashflow
- —
- DSCR
- —
- Eligible?
- —
No personal income docs; deal must DSCR.
Hard money
10% down · 12.0% · 12mo
- Down + closing
- —
- Monthly P&I
- —
- Monthly cashflow
- —
- DSCR
- —
- Eligible?
- —
Short-term bridge; refi at stabilization.
Rent comps 3 comps
| Address | Beds | Baths | Sqft | Rent | $/sqft | DOM | Units | Dist |
|---|---|---|---|---|---|---|---|---|
| 4364 Harrison Ave Cincinnati, OH | 2.0 | 1.0 | 1000 | $1,095 | $1.09 | 44d | 1 | 1.28mi |
| 4364 Harrison Ave Unit 4364 29 Cincinnati, OH | 2.0 | 1.0 | 1000 | $1,095 | $1.09 | 24d | 1 | 1.28mi |
| 5694 Bridgetown Rd #16 Cincinnati, OH | 2.0 | 2.0 | 1184 | $1,795 | $1.52 | 7d | 1 | 1.37mi |
Listing history 2 events
-
2026-06-19remarks 532-char remark
-
2026-06-19$295,000 Active 1 DOM
ⓘ Source: listings_history table (triggers on properties + properties_extension) + one-shot
backfill from property_details.listing_events for pre-trigger history.
Tax reassessment forecast OH · Partial reset (capped growth)
- Current annual tax
- $2,143 · $179/mo
- Projected year-2 tax
- $3,372 · $281/mo
- Expected delta
- +$1,230/yr (+$102/mo · 57.4%)
ⓘ Screening estimate from a state-policy table — verify with the county assessor before closing.
Climate risk First Street
- Flood 1/10 Low FEMA zone X (unshaded) · 0% chance over 30 yrs
- Wildfire 1/10 Low
- Heat 4/10 Moderate 7 d/yr ≥102°F today · 19 d/yr by 30 yrs out
- Wind 2/10 Low 100% chance of damaging wind over 30 yrs
- Air quality 2/10 Low 1 unhealthy d/yr today · 1 by 30 yrs out
Nearby sold comps map
Loading sold comps map…
Walkable amenities ~0.75 mi
Loading nearby amenities…
Taxation est. · year 1
- Rental income
- $16,140
- − Mortgage interest
- −$16,525
- − Property taxes
- −$2,143
- − Insurance
- −$1,475
- − Repairs & maintenance
- −$1,291
- − Management
- −$1,291
- − Depreciation
- −$8,582
- Taxable loss
- −$15,167
- Est. tax savings @ 24.0%
- +$3,640
- After-tax cash flow
- $-5,791/yr
For passive investors: Depreciation is non-cash, so a rental often shows a tax loss while cash-flowing — sheltering income. Rental losses are passive: they offset passive income freely, and up to $25,000/yr can offset ordinary (W-2) income if you actively participate and your MAGI is under $100k (phasing out to $0 by $150k); unused losses carry forward. On sale, claimed depreciation is recaptured at up to 25%, and gains may owe capital-gains tax (a 1031 exchange can defer both). Figures are a year-1 estimate at your 24.0% rate — not tax advice; consult a CPA.
Schools (NCES district)
- District
- Oak Hills Local
- NCES district ID
- 3904737
- Math proficiency
- 68% ▼ -11.00%
- Reading proficiency
- 70% ▼ -8.00%
- Median HH income
- $67,889
- Composite
- 60.25/100
- National rank
- #858
- State rank
- #141 of 656 in OH
Livability — Monfort Heights
- Score
- 85/100
- State rank
- #46
- US rank
- #614
Category grades
Schools grade is shown separately in the Schools card above.
Census & demographics
- Census place
- Monfort Heights, OH
- County
- Hamilton · 838,887 people
- Metro
- Cincinnati, OH-KY-IN
- Population (ZIP)
- 23,588
- Household income
- $95,810
- Rent vs Own
- Severe rent burden
- 10.7
Population outlook (Hamilton County) Hauer SSP2
- Today (2025)
- 826,054 people
- By 2030
- 830,947 · +0.6%
- By 2040
- 832,319 · +0.8%
- By 2050
- 822,428 · -0.4%
- By 2075
- 788,688 · -4.5%
- By 2100
- 710,674 · -14.0%
Race, ethnicity, and origin ACS 2023
- Neighborhood character
- Predominantly White (87%)
- Race & ethnicity
- White 87% Black 7% Two or more races 4%
- Common ancestry
- Romanian 3% Lithuanian 2% Italian 2%
- Foreign-born
- 3% · China
- Languages at home
- 96% English-only · Arabic 1% Russian/Polish/Slavic 1% Spanish 1%
Political lean MEDSL · Hamilton
- 2024 margin
- D (+14.9) · D 57.0% · R 42.1%
- 2008→2024 swing
- +7.9pp toward D · 2008: 7.0pp · 2024: 14.9pp
- All cycles
- 2024: D+14.9 2020: D+15.9 2016: D+9.5 2012: D+4.9 2008: D+7.0
Not yet ingested
- Civics
- —
Market trends
- HPI YoY
- ▼ -126.31%
- Current HPI
- 204.334
- Rent YoY
- —
- Metro
- —
- State GDP YoY
- ▲ 1.98%
- F500 in state
- 48
Industry mix (Fortune 500 HQ in OH)
| Industry | F500 HQs | Revenue |
|---|---|---|
| Insurance | 3 | $145B |
|
||
| Industrial Machinery | 3 | $49B |
|
||
| Financial Services | 3 | $24B |
|
||
| Consumer Goods | 2 | $93B |
|
||
| Aerospace / Defense | 2 | $47B |
|
||
| Utilities | 2 | $33B |
|
||
Price history
+145.8% since first listed27 events — show timeline
- 2026-06-18 Listed $295,000 Cincy MLS
- 2026-04-01 Listing Removed — Cincy MLS
- 2026-03-24 Contingent — Cincy MLS
- 2026-02-21 Listed $269,900 Cincy MLS
- 2026-02-16 Listing Removed — Cincy MLS
- 2026-01-14 Contingent — Cincy MLS
- 2025-11-25 Price Changed $275,000 Cincy MLS
- 2025-11-10 Price Changed $285,000 Cincy MLS
- 2025-10-27 Listed $295,000 Cincy MLS
- 2025-07-01 Sold (Public Records) $115,000 Public Records
- 2025-06-30 Sold (MLS) $115,000 Cincy MLS
- 2025-06-30 Sold (MLS) $115,000 Dayton MLS
- 2025-06-04 Contingent — Cincy MLS
- 2025-06-04 Contingent — Dayton MLS
- 2025-05-16 Relisted — Dayton MLS
- 2025-05-16 Relisted — Cincy MLS
- 2025-03-07 Contingent — Dayton MLS
- 2025-03-07 Contingent — Cincy MLS
- 2025-02-21 Listed $119,900 Cincy MLS
- 2025-02-21 Listed $119,900 Dayton MLS
- 2015-11-16 Sold (Public Records) $57,000 Public Records
- 2015-11-06 Sold (MLS) $57,000 Cincy MLS
- 2015-10-27 Contingent — Cincy MLS
- 2015-10-07 Price Changed $59,900 Cincy MLS
- 2015-09-04 Price Changed $65,000 Cincy MLS
- 2015-08-13 Listed $75,000 Cincy MLS
- 2000-01-21 Sold (Public Records) $120,000 Public Records
Property tax history
+3.0%/yrLatest (2025): $2,143 · -0.2% YoY. Source: county tax records.
Cash-flow waterfall
monthlySold comps — $/sqft
last 12 mo · ≤1 miLoading sold comps…