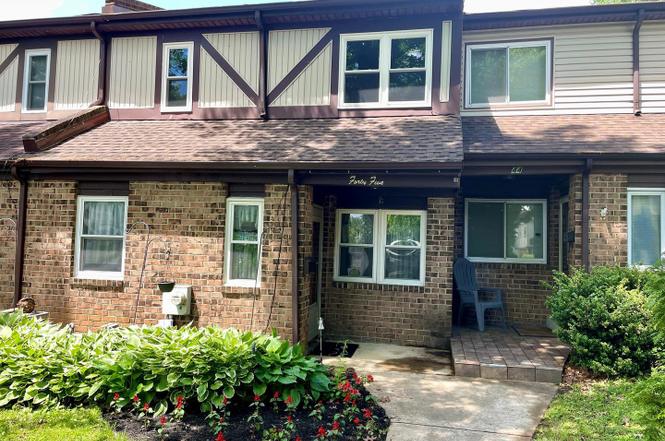
45 Hollybrooke Dr · Levittown, PA
Flood risk 1/10 · Minimal
- FEMA flood zone
- X (unshaded)
- Chance of flooding over 30 yrs
- 0.0%
- Est. flood insurance / yr
- $507 – $1,088
Fire risk 1/10 · Minimal
- Est. fire insurance / yr
- $511 – $949
Heat risk 7/10 · Major
- Hot days now (above 104°F)
- 7 days/yr
- Hot days in 30 yrs
- 15 days/yr
Wind risk 6/10 · Moderate
- Chance of severe wind over 30 yrs
- 27.0%
Air-quality risk 5/10 · Moderate
- Unhealthy air days now
- 6 days/yr
- Unhealthy air days in 30 yrs
- 8 days/yr
Risk factors via First Street. Map © Google.
Why this score? — see what drove the D grade
The composite is a weighted blend of 9 inputs, each scored 0–100. Each bar is that input's sub-score; the figure is the points it added to the 100-point composite (weight × sub-score).
- ARV discount +11.0/15.0
- Cash flow +10.8/30.0
- Schools +4.5/10.0
- Livability +3.8/5.0
- 1% rule +3.1/10.0
- DSCR +3.1/10.0
- Rent growth +2.7/5.0
- Condition / age +2.5/5.0
- Appreciation +0.0/10.0
$325,000
🖨 Deal sheet (PDF) 📄 Offer letter ✓ Due diligence
Listing remarks
Welcome to 45 Holly Brooke Drive in Langhorne, your opportunity to own a 3 bedroom, 2.5 bath townhouse with no HOA fees, offering both value and flexibility in the desirable Neshaminy School District. This move-in ready home has been thoughtfully refreshed to be move-in ready. Be welcomed by fresh landscaping then step inside to a freshly painted interior complemented by new carpeting upstairs. The nicely sized eat-in kitchen features stainless steel appliances and provides a comfortable space for everyday living and casual dining. The spacious living room offers plenty of room to relax or entertain, with direct access to the backyard, creating an easy flow for indoor-outdoor living. Upstai
Key facts
- Built 1976
- Listed 7 days
Property features AI
Finance
- Other: Pets allowed with no pet restrictions
Exterior
- Parking: Parking lot
- Utilities: Public water; Public sewer; Electric service
- Home design: Interior townhouse/rowhouse; Fee simple ownership
- Construction: Mixed construction materials; Slab foundation; Above-grade and below-grade structures noted; Year built source: Assessor
- Exterior features: Lot dimensions approximately 20.00 x 95.00; Ground rent paid annually; Tidal water: no
Interior
- Kitchen: Refrigerator; Dishwasher
- Bedrooms: Three bedrooms on the first upper level
- Bathrooms: Two full bathrooms (all upper levels); One half bathroom on the main level
- Heating & cooling: Forced air heating (electric); Central air conditioning (electric); Electric hot water
- Interior features: Refrigerator; Dishwasher; No basement
Neighborhood map
What this means for you Summary
Snapshot
- This is a 3-bed/2.5-bath townhouse listed at $325k.
Deal economics
- At list price, monthly cash flow is $-151 ($-2k/yr) — negative.
- To cash-flow at today's rent, offer at most $298k (8.2% below list).
- To meet the 1% rule (rent ≥ 1% of price), the offer needs to be $263k (19.2% below list).
- Recommended offer: $263k (19.2% below list) — sets the bar for 1% rule.
- Cap rate 5.7% vs local median 4.0% in Levittown — top-decile yield for the area; either an underpriced asset or a hidden risk that comps aren't pricing in. Stress-test before assuming the spread holds.
Location & tenants
- Location reads 75/100 on livability (#470 in PA, #4,342 nationally) — a middle-class / working-renter tenant base. Strengths: employment A+, housing A+, cost of living A-; Watch: amenities F, commute F.
- Neshaminy SD (suburban): math 41% / reading 57% proficiency, ranked #150 of 539 in PA (top 28%) — families likely to look elsewhere, expect single-tenant / working-renter base with shorter leases; only 19% free/reduced lunch — higher-income household profile.
- Zoned schools: Schweitzer El Sch (math 47% / reading 57%, grade C-, #586 of 1,518 statewide, top 42%, 457 students, 36% FRL); Sandburg Ms (math 22% / reading 51%, grade F, #307 of 512 statewide, top 61%, 686 students, 38% FRL); Neshaminy Hs (math 76% / reading 24%, grade D+, #133 of 437 statewide, top 30%, 2,933 students, 38% FRL) — zoned schools average 37% FRL vs 19% district-wide (19 pts higher); higher-poverty schools than district average — tighter screening recommended.
- Market conditions: Rents flat; 126 active listings in the ZIP; 6 comparable units currently listed for rent nearby; rentals at typical pace (median 19d on market — plan ~3-4 weeks tenant-placement turnaround); solid renter incomes; 663 units permitted in Bucks County in 2024 (106 in 5+ unit buildings).
Forward outlook
- Local home prices are declining (-3.0%/yr); year-one equity from $2k of loan paydown is wiped out by about $10k of value loss. Plan a longer hold.
- Bucks County population projected to shrink 7% by 2050 — rents likely to lag national; underwrite the cash flow, not the appreciation.
Negotiation context
- Only 7 days on market — expect competitive offers; lowballing is unlikely to land.
- 2 sale attempts since 31y ago with the ask held roughly flat each time — persistent listings suggest the price (not the market) is what's stuck; bring a comps-based counter.
- Current owner paid $90k; list at $325k implies a 259% gain — meaningful room to come down on a strong offer.
Risks & watch-outs
- Climate carrying-cost: major wind risk, 27% chance of damaging wind over 30y; extreme-heat days projected 7→15/yr by 2055 (HVAC capex compounding) — expect insurance premiums to compound above CPI over the hold.
Questions for the listing agent
- What do current leases actually rent for vs. the listed asking? Can we see a recent rent roll and the last 12 months of T-12 income?
- Built in 1976 — when were the roof, HVAC, electrical panel, plumbing, and water heater last replaced?
- Is there a deadline driving the sale (1031 exchange, divorce, estate, relocation)? That informs how much negotiation room exists.
- Schools are B-rated — typically a magnet for longer-tenancy family renters. What's the average tenant stay here, and is there a school-zone premium baked into asking?
- The area grade is low — what's the realistic commute time and amenity access for the typical tenant pool here? Any planned neighborhood developments (good or bad) we should know about?
- What's the average days-on-market for RENTAL listings here right now (not sales)? A rising rental-DOM trend means longer vacancies and softer asking-rent achievability than the comps imply.
- What's the recent tenant-quality profile in this submarket — average credit score on applications, eviction rate, late-payment / NSF rate, and stable-employment percentage? A property-management company in the area should have these aggregated.
- How much new for-sale + rental construction is in the pipeline within 1–3 miles? Heavy new supply typically softens prices + rents 12–24 months out; constrained supply supports both.
Investment metrics
- 1% rule
- 0.81% ✗
- Cap rate
- 5.74%
- Cash-on-cash
- -1.99%
- DSCR
- 0.91
- GRM
- 10.3
CMA / ARV
- ARV (median comp)
- $352,374
- List price
- $325,000
- Delta
- -7.77%
- Verdict
- FAIR
- Comps
- 20 within 1.0 mi
Show comp detail 8 sales within ~0.75 mi
| Address | Dist | Beds/Ba | Sqft | Sold | Price | $/sf | Match |
|---|---|---|---|---|---|---|---|
| 24 Boxwood Ln | 0.21mi | 3/2.5 | 1,347 (-3%) | 9mo | $375,000 | $278 | 78 |
| 17 Hollybrooke Dr | 0.05mi | 3/2.5 | 1,432 (+3%) | 18mo | $387,000 | $270 | 78 |
| 31 Carriage Knoll Ct | 0.39mi | 3/2.5 | 1,384 (-0%) | 10mo | $363,000 | $262 | 72 |
| 135 Hollybrooke Dr | 0.15mi | 3/2.5 | 1,544 (+11%) | 10mo | $345,000 | $223 | 66 |
| 35 Hollybrooke Dr | 0.05mi | 3/2.5 | 1,568 (+13%) | 22mo | $386,000 | $246 | 58 |
| 33 Carriage Knoll Ct | 0.38mi | 2/1.5 (-1) | 1,230 (-12%) | 0mo | $375,000 | $305 | 54 |
| 35 Bellaire Dr | 0.32mi | 2/2.0 (-1) | 1,294 (-7%) | 22mo | $295,000 | $228 | 48 |
| 3 Carriage Knoll Ct | 0.36mi | 2/2.5 (-1) | 1,230 (-12%) | 24mo | $335,000 | $272 | 40 |
Match score weights: distance 35% · size 25% · config 20% · recency 20%. Top-matched comps best support the ARV.
Projected returns pro-forma
-3.0% appreciation · 0.81% rent growth · sell at horizon
- IRR
- -22.0%
- Equity multiple
- 0.25×
- Total profit
- $-67,891
- Equity at exit
- $48,459
- IRR
- -22.3%
- Equity multiple
- -0.03×
- Total profit
- $-93,604
- Equity at exit
- $28,100
Cash invested: $91,000 (down + closing). Projections, not guarantees.
Landlord ↔ Tenant lean methodology
- Overall (STATE)
- 62 Landlord-Friendly
- State Pennsylvania
- 62 Landlord-Friendly · EVEN
- County
- — inherits STATE
- City
- — inherits STATE
ZIP-level market 19047
- Rents YoY
- 0.8%
- Active inventory
- 126
- Price-to-rent
- 10.3×
Monthly cashflow live
- Estimated rent
- $2,627 high interval (Pro) →
- Mortgage (P&I)
- −$1,704
- Tax from tax record
- −$386 /mo · $4,635/yr
- Insurance
- −$135
- HOA
- −$0
- Vacancy / Maint / Mgmt
- −$552
- Net cashflow
- $-151
Break-even live
Sensitivity live
| Price | -10% $33 | -5% $-59 | +0% $-151 | +5% $-243 | +10% $-335 |
|---|---|---|---|---|---|
| Rent | -10% $-358 | -5% $-254 | +0% $-151 | +5% $-47 | +10% $57 |
| Rate | -1.0pp $13 | -0.5pp $-68 | base $-151 | +0.5pp $-235 | +1.0pp $-320 |
UW: 25.0% down · 7.5% · 30yr · 1.5% tax · 5.0% vac · 8.0% maint · 8.0% mgmt
Financing live
Cash to close
- Down payment
- $81,250
- Closing costs
- $9,750
- Reserves months
- —
- Total cash needed
- —
Loan-product check · same deal, 3 products live
Conventional
25% down · 7.5% · 30yr
- Down + closing
- —
- Monthly P&I
- —
- Monthly cashflow
- —
- DSCR
- —
- Eligible?
- —
Personal DTI + credit; lowest rate.
DSCR
20% down · 8.5% · 30yr
- Down + closing
- —
- Monthly P&I
- —
- Monthly cashflow
- —
- DSCR
- —
- Eligible?
- —
No personal income docs; deal must DSCR.
Hard money
10% down · 12.0% · 12mo
- Down + closing
- —
- Monthly P&I
- —
- Monthly cashflow
- —
- DSCR
- —
- Eligible?
- —
Short-term bridge; refi at stabilization.
Rent comps 6 comps
| Address | Beds | Baths | Sqft | Rent | $/sqft | DOM | Units | Dist |
|---|---|---|---|---|---|---|---|---|
| 20 Hollybrooke Dr Langhorne, PA | 3.0 | 1.5 | 1320 | $2,450 | $1.86 | 26d | 1 | 0.06mi |
| 800 Trenton Rd Langhorne, PA | 1.0–2.0 | 1.0 | 920 | $2,434 | $2.64 | 0d | 6 | 0.23mi |
| 1970 Veterans Hwy Levittown, PA | 1.0–2.0 | 1.0–2.0 | 853 | $2,380 | $2.79 | 0d | 8 | 0.77mi |
| 564 Hulmeville Ave Unit B Penndel, PA | 3.0 | 1.0 | 900 | $2,500 | $2.78 | 26d | 1 | 0.94mi |
| 564 Hulmeville Ave Unit B Penndel, PA | 3.0 | 1.0 | 900 | $2,300 | $2.56 | 18d | 1 | 0.94mi |
| 122 Glen Ave Langhorne, PA | 3.0 | 2.0 | 1100 | $2,500 | $2.27 | 0d | 1 | 1.39mi |
Listing history 7 events
-
2026-06-15status $325,000 Pending 7 DOM
-
2026-05-15historical $325,000 1052-char remark
-
1995-07-03soldstatus $90,500
-
1995-05-14historical
-
1995-01-14$93,900
-
1986-03-07soldstatus $58,000
-
1983-05-01soldstatus $50,500
ⓘ Source: listings_history table (triggers on properties + properties_extension) + one-shot
backfill from property_details.listing_events for pre-trigger history.
Tax reassessment forecast PA · Partial reset (capped growth)
- Current annual tax
- $4,635 · $386/mo
- Projected year-2 tax
- $4,885 · $407/mo
- Expected delta
- +$250/yr (+$21/mo · 5.4%)
ⓘ Screening estimate from a state-policy table — verify with the county assessor before closing.
Climate risk First Street
- Flood 1/10 Low FEMA zone X (unshaded) · 0% chance over 30 yrs
- Wildfire 1/10 Low
- Heat 7/10 Severe 7 d/yr ≥104°F today · 15 d/yr by 30 yrs out
- Wind 6/10 Major 27% chance of damaging wind over 30 yrs
- Air quality 5/10 Major 6 unhealthy d/yr today · 8 by 30 yrs out
Nearby sold comps map
Loading sold comps map…
Walkable amenities ~0.75 mi
Loading nearby amenities…
Taxation est. · year 1
- Rental income
- $31,526
- − Mortgage interest
- −$18,205
- − Property taxes
- −$4,635
- − Insurance
- −$1,625
- − Repairs & maintenance
- −$2,522
- − Management
- −$2,522
- − Depreciation
- −$9,455
- Taxable loss
- −$7,438
- Est. tax savings @ 24.0%
- +$1,785
- After-tax cash flow
- $-22/yr
For passive investors: Depreciation is non-cash, so a rental often shows a tax loss while cash-flowing — sheltering income. Rental losses are passive: they offset passive income freely, and up to $25,000/yr can offset ordinary (W-2) income if you actively participate and your MAGI is under $100k (phasing out to $0 by $150k); unused losses carry forward. On sale, claimed depreciation is recaptured at up to 25%, and gains may owe capital-gains tax (a 1031 exchange can defer both). Figures are a year-1 estimate at your 24.0% rate — not tax advice; consult a CPA.
Schools (NCES district)
- District
- Neshaminy SD
- NCES district ID
- 4216410
- Math proficiency
- 41% ▼ -10.00%
- Reading proficiency
- 57% ▼ -14.00%
- Median HH income
- $78,072
- Composite
- 44.58/100
- National rank
- #2782
- State rank
- #150 of 539 in PA
Livability — Levittown
- Score
- 75/100
- State rank
- #470
- US rank
- #4342
Category grades
Schools grade is shown separately in the Schools card above.
Census & demographics
- County
- Bucks County · 506,477 people
- City population
- 33,478
- Metro
- Philadelphia-Camden-Wilmington, PA-NJ-DE-MD
- Population (ZIP)
- 34,563
- Household income
- $109,530
- Rent vs Own
- Severe rent burden
- 1064.0
Population outlook (Bucks County) Hauer SSP2
- Today (2025)
- 630,973 people
- By 2030
- 627,093 · -0.6%
- By 2040
- 609,680 · -3.4%
- By 2050
- 584,225 · -7.4%
- By 2075
- 539,840 · -14.4%
- By 2100
- 483,970 · -23.3%
Race, ethnicity, and origin ACS 2023
- Neighborhood character
- Predominantly White (82%)
- Race & ethnicity
- White 82% Two or more races 6% Black 5% Hispanic / Latino 4% Asian 4%
- Common ancestry
- Romanian 7% Slovak 2% Subsaharan African 1%
- Foreign-born
- 7% · Canada, China, Dominican Republic
- Languages at home
- 91% English-only · Other Indo-European 3% Spanish 2% Russian/Polish/Slavic 1%
Political lean MEDSL · Bucks
- 2024 margin
- Toss-up / Even · D 49.5% · R 49.5%
- 2008→2024 swing
- -8.7pp toward R · 2008: 8.7pp · 2024: -0.1pp
- All cycles
- 2024: R+0.1 2020: D+4.4 2016: D+0.6 2012: D+1.2 2008: D+8.7
Not yet ingested
- Civics
- —
Market trends
- HPI YoY
- ▼ -288.47%
- Current HPI
- 304.1718
- Rent YoY
- ▲ 0.81%
- Metro
- Philadelphia-Camden-Wilmington, PA-NJ-DE-MD
- State GDP YoY
- ▲ 1.68%
- F500 in state
- 34
Industry mix (Fortune 500 HQ in PA)
| Industry | F500 HQs | Revenue |
|---|---|---|
| Healthcare | 2 | $309B |
|
||
| Insurance | 2 | $27B |
|
||
| Telecommunications / Media | 1 | $124B |
|
||
| Industrial Distribution | 1 | $22B |
|
||
| Financial Services | 1 | $20B |
|
||
| Chemicals / Materials | 1 | $18B |
|
||
Price history
+543.6% since first listed9 events — show timeline
- 2026-06-15 Pending — BRIGHT MLS
- 2026-05-27 Contingent — BRIGHT MLS
- 2026-05-21 Listed $325,000 BRIGHT MLS
- 2026-05-15 Coming Soon $325,000 BRIGHT MLS
- 1995-07-03 Sold (Public Records) $90,500 Public Records
- 1995-05-14 Listing Removed — BRIGHT MLS
- 1995-01-14 Listed $93,900 BRIGHT MLS
- 1986-03-07 Sold (Public Records) $58,000 Public Records
- 1983-05-01 Sold (Public Records) $50,500 Public Records
Property tax history
+1.5%/yrLatest (2026): $4,635 · +7.2% YoY. Source: county tax records.
Cash-flow waterfall
monthlySold comps — $/sqft
last 12 mo · ≤1 miLoading sold comps…